Login to access
Want to subscribe?
This article is part of: Executive Briefing Service
To find out more about how to join or access this report please contact us
Over 5 years, BT Group's share price has more than tripled, outperforming Apple's and Google's, while its revenues have shrunk. Why, and what can other telcos learn from its success?
BT Group outperformed Apple and Google
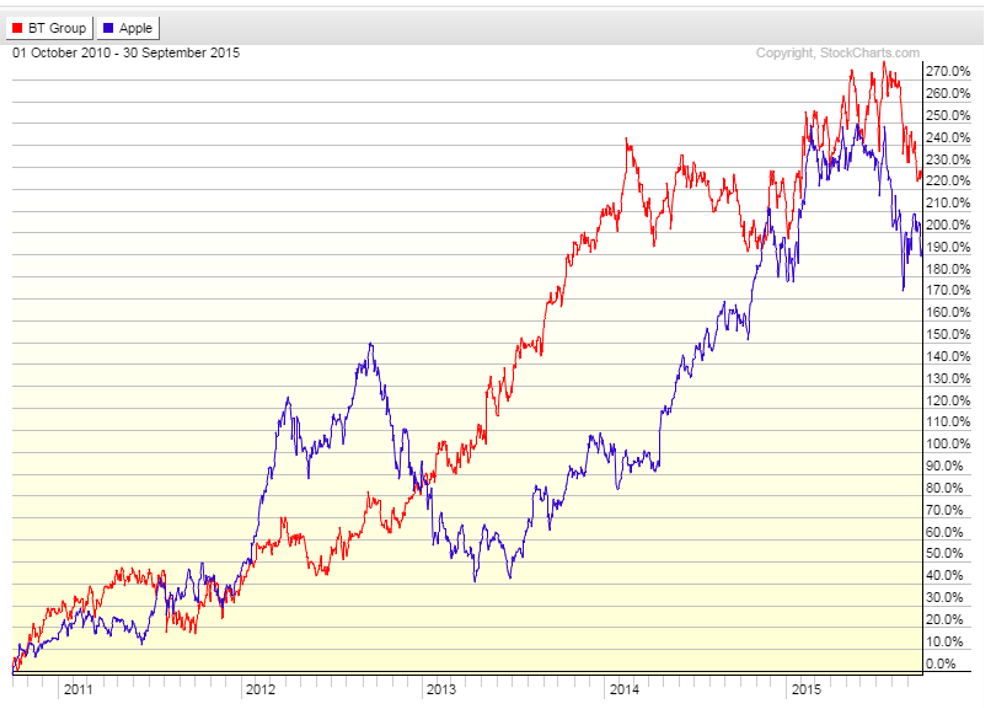
Over the last five years, the share price of BT Group, the UK’s ex-incumbent telecoms operator, has outperformed those of Apple and Google, as well as a raft of other telecoms shares. The following chart shows BT’s share price in red and Apple’s in in blue for comparison.
Figure 1: BT’s Share Price over 5 Years

Source: www.stockcharts.com
Now of course, over a longer period, Apple and Google have raced way ahead of BT in terms of market capitalisation, with Apple’s capital worth $654bn and Google $429bn USD compared to BT’s £35bn (c$53bn USD).
And, with any such analysis, where you start the comparison matters. Nonetheless, BT’s share price performance during this period has been pretty impressive – and it has delivered dividends too.
The total shareholder returns (capital growth plus all dividends) of shares in BT bought in September 2010 are over 200% despite its revenues going down in the period.
So what has happened at BT, then?
Sound basic financials despite falling revenues
Over this 5 year period, BT’s total revenues fell by 12%. However, in this period BT has also managed to grow EBITDA from £5.9bn to £6.3bn – an impressive margin expansion. This clearly cannot go on for ever (a company cannot endlessly shrink its way to higher profits) but this has contributed to positive capital markets sentiment.
Figure 2: BT Group Revenue and EBITDA 2010/11 – 2014/15
[Figure 2]
Source: BT company accounts, STL Partners
BT pays off its debts
BT has also managed to reduce its debt significantly, from £8.8bn to £5.1bn over this period.
Figure 3: BT has reduced its debts by more than a third (£billions)

Source: BT company accounts, STL Partners
Margin expansion and debt reduction suggests good financial management but this does not explain the dramatic growth in firm value (market capitalisation plus net debt) from just over £20bn in March 2011 to circa £40bn today (based on a mid-September 2015 share price).
Figure 4: BT Group’s Firm Value has doubled in 5 Years

Source: BT company accounts, STL Partners
- Introduction: BT’s Share Price Miracle
- So what has happened at BT, then?
- Sound basic financials despite falling revenues
- Paying off its debts
- BT Sport: a phenomenal halo effect?
- Will BT Sport continue to shine?
- Take-Outs from BT’s Success
- Figure 1: BT’s Share Price over 5 Years
- Figure 2: 5-Year Total Shareholder Returns Vs Revenue Growth for leading telecoms players
- Figure 3: BT Group Revenue and EBITDA 2010/11-2014/15
- Figure 4: BT has reduced its debts by more than a third (£billions)
- Figure 5: BT Group’s Firm Value has doubled in 5 Years
- Figure 6: BT Group has improved key market valuation ratios
- Figure 7: BT ‘broadband and TV’ compared to BT Consumer Division
- Figure 8: Comparing Firm Values / Revenue Ratios
- Figure 9: BT Sport’s impact on broadband
