How to build an open source telco – and why?

If you don’t subscribe to our research yet, you can download the free report as part of our sample report series.

Introduction: Why an open source telecom?

Commercial pressures and technological opportunities

For telcos in many markets, declining revenues is a harsh reality. Price competition is placing telcos under pressure to reduce capital spending and operating costs.

At the same time, from a technological point of view, the rise of cloud-based solutions has raised the possibility of re-engineering telco operations to be run with virtualised and open sourced software on low cost, general purpose hardware.

Indeed, rather than pursuing the traditional technological model, i.e. licensing proprietary solutions from the mainstream telecoms vendors (e.g. Ericsson, Huawei, Amdocs, etc.), telcos can increasingly:

  1. Progressively outsource the entire technological infrastructure to a vendor;
  2. Acquire software with programmability and openness features: application programming interfaces(APIs) can make it easier to program telecommunications infrastructure.

The second option promises to enable telcos to achieve their long-standing goals of decreasing the time-to-market of new solutions, while further reducing their dependence on vendors.

Greater adoption of general IT-based tools and solutions also:

  • Allows flexibility in using the existing infrastructure
  • Optimises and reuses the existing resources
  • Enables integration between operations and the network
  • And offers the possibility to make greater use of the data that telcos have traditionally collected for the purpose of providing communications services.


In an increasingly squeezed commercial context, the licensing fees applied by traditional vendors for telecommunication solutions start to seem unrealistic, and the lack of flexibility poses serious issues for operators looking to push towards a more modern infrastructure. Moreover, the potential availability of competitive open source solutions provides an alternative that challenges the traditional model of making large investments in proprietary software, and dependence on a small number of vendors.

Established telecommunications vendors and/or new aggressive ones may also propose new business models (e.g., share of investments, partnership and the like), which could be attractive for some telcos.

In any case, operators should explore and evaluate the possibility of moving forward with a new approach based on the extensive usage of open source software.

This report builds on STL Partners’ 2015 report, The Open Source Telco: Taking Control of Destiny which looked at how widespread use of open source software is an important enabler of agility and innovation in many of the world’s leading internet and IT players. Yet while many telcos then said they crave agility, only a minority use open source to best effect.

In that 2015 report, we examined the barriers and drivers, and outlined six steps for telcos to safely embrace this key enabler of transformation and innovation:

  1. Increase usage of open source software: Overall, operators should look to increase their usage of open source software across their entire organisation due to its numerous strengths. It must, therefore, be consistently and fairly evaluated alongside proprietary alternatives. However, open source software also has disadvantages, dependencies, and hidden costs (such as internally-resourced maintenance and support), so it should not be considered an end in itself.
  2. Increase contributions to open source initiatives: Operators should also look to increase their level of contribution to open source initiatives so that they can both push key industry initiatives forward (e.g. OPNFV and NFV) and have more influence over the direction these take.
  3. Associate open source with wider transformation efforts: Successful open source adoption is both an enabler and symptom of operators’ broader transformation efforts, and should be recognised as such. It is more than simply a ‘technical fix’.
  4. Bring in new skills: To make effective use of open source software, operators need to acquire new software development skills and resources – likely from outside the telecoms industry.
  5. … but bring the whole organisation along too: Employees across numerous functional areas (not just IT) need to have experience with, or an understanding of, open source software – as well as senior management. This should ideally be managed by a dedicated team.
  6. New organisational processes: Specific changes also need to be made in certain functional areas, such as procurement, legal, marketing, compliance and risk management, so that their processes can effectively support increased open source software adoption.

This report goes beyond those recommendations to explore the changing models of IT delivery open to telcos and how they could go about adopting open source solutions. In particular, it outlines the different implementation phases required to build an open source telco, before considering two scenarios – the greenfield model and the brownfield model. The final section of the report draws conclusions and makes recommendations.

Why choose to build an open source telecom now?

Since STL Partners published its first report on open source software in telecoms in 2015, the case for embracing open source software has strengthened further. There are three broad trends that are creating a favourable market context for open source software.

Digitisation – the transition to providing products and services via digital channels and media. This may sometimes involve the delivery of the product, such as music, movies and books, in a digital form, rather than a physical form.

Virtualisation – executing software on virtualised platforms running on general-purpose hardware located in the cloud, rather than purpose-built hardware on premises. Virtualisation allows a better reuse of large servers by decoupling the relationship of one service to one server. Moreover, cloudification of these services means they can be made available to any connected device on a full-time basis.

Softwarisation – the redefinition of products and services though software. This is an extension of digitisation, i.e., the digitisation of music has allowed the creation of new services and propositions (e.g. Spotify). The same goes for the movie industry (e.g. Netflix) or the transformation of the book industry (e.g. ebooks) and newspapers. This paradigm is based on:

  • The ability to digitise the information (transformation of the analogue into a digital signal).
  • Availability of large software platforms offering relevant processing, storage and communications capabilities.
  • The definition of open and reusable application programming interfaces (APIs) which allow processes formerly ‘trapped’ within proprietary systems to be managed or enhanced with other information and by other systems.

These three features have started a revolution that is transforming other industries, e.g. travel agencies (e.g. Booking.com), large hotel chains (e.g. Airbnb), and taxis (e.g. Uber). Softwarisation is also now impacting other traditional industries, such as manufacturing (e.g., Industry 4.0) and, for sure, telecommunications.

Softwarisation in telecommunications amounts to the use of virtualisation, cloud computing, open APIs and programmable communication resources to transform the current network architecture. Software is playing a key role in enabling new services and functions, better customer experience, leaner and faster processes, faster introduction of innovation, and usually lower costs and prices. The softwarisation trend is very apparent in the widespread interest in two emerging technologies: network function virtualization (NFV) and software defined networking (SDN).

The likely impact of this technological transformation is huge: flexibility in service delivery, cost reduction, quicker time to market, higher personalisation of services and solutions, differentiation from competition and more. We have outlined some key telco NFV/SDN strategies in the report Telco NFV & SDN Deployment Strategies: Six Emerging Segments.

What is open source software?

A generally accepted open source definition is difficult to achieve because of different perspectives and some philosophical differences within the open source community.

One of the most high-profile definitions is that of the Open Source Initiative, which states the need to have access to the source code, the possibility to modify and redistribute it, and non-discriminatory clauses against persons, groups or ‘fields of endeavour’ (for instance, usage for commercial versus academic purposes) and others.

For the purpose of this report, STL defines open source software as follows:

▪ Open source software is a specific type of software for which the original source code is made freely available and may be redistributed and modified. This software is usually made available and maintained by specialised communities of developers that support new versions and ensure some form of backward compatibility.

Open source can help to enable softwarisation. As an example, it has greatly helped in moving from proprietary solutions in the web server sector to a common software platform (named LAMP) based on the Linux operating system, the Apache Http server, Mysql server, PhP programming language. All these components are made available as open source. This essentially means that people can freely acquire the source code, modify it and use it. Modifications and improvements are to be returned to the development community.

One of the earliest and most high profile examples of open source software was the Linux operating system, a Unix-like operating system developed under the model of free and open source software development and distribution.

Open source for telecoms: Benefits and barriers

The benefits of using open source for telecoms

As discussed in our earlier report, The Open Source Telco: Taking Control of Destiny, the adoption and usage of open source solutions are being driven by business and technological needs. Ideally, the adoption and exploitation of open source will be part of a broader transformation programme designed to deliver the specific operator’s strategic goals.

Operators implementing open source solutions today tend to do so in conjunction with the deployment of network function virtualization (NFV) and software defined networking (SDN), which will play an important role for the definition and consolidation of the future 5G architectures.

However, as Figure 1 shows, transformation programmes can face formidable obstacles, particularly where a cultural change and new skills are required.

Benefits of transformation and related obstacles

The following strategic forces are driving interest in open source approaches among telecoms operators:

Reduce infrastructure costs. Telcos naturally want to minimise investment in new technologies and reduce infrastructure maintenance costs. Open source solutions seem to provide a way to do this by reducing license fees paid to solution vendors under the traditional software procurement model. As open source software usually runs on general-purpose hardware, it could also cut the capital and maintenance costs of the telco’s computing infrastructure. In addition, the current trend towards virtualisation and SDN should enable a shift to more programmable and flexible communications platforms. Today, open source solutions are primarily addressing the core network (e.g., virtualisation of evolved packet core), which accounts for a fraction of the investment made in the access infrastructure (fibre deployment, antenna installation, and so forth). However, in time open source solutions could also play a major role in the access network (e.g., open base stations and others): an agile and well-formed software architecture should make it possible to progressively introduce new software-based solutions into access infrastructure.

Mitigate vendor lock-in. Major vendors have been the traditional enablers of new services and new network deployments. Moreover, to minimise risks, telco managers tend to prefer to adopt consolidated solutions from a single vendor. This approach has several consequences:

  • Telcos don’t tend to introduce innovative new solutions developed in-house.
  • As a result, the network is not fully leveraged as a differentiator, and can become the full care and responsibility of a vendor.
  • The internal innovation capabilities of a telco have effectively been displaced in favour of those of the vendor.

This has led to the “ossification” of much telecoms infrastructure and the inability to deliver differentiated offerings that can’t easily be replicated by competitors. Introducing open source solutions could be a means to lessen telcos’ dependence on specific vendors and increase internal innovation capabilities.

Enabling new services. The new services telcos introduce in their networks are essentially the same across many operators because the developers of these new services and features are a small set of consolidated vendors that offer the same portfolio to all the industry. However, a programmable platform could enable a telco to govern and orchestrate their network resources and become the “master of the service”, i.e., the operator could quickly create, customise and personalise new functions and services in an independent way and offer them to their customers. This capability could help telcos enter adjacent markets, such as entertainment and financial services, as well as defend their core communications and connectivity markets. In essence, employing an open source platform could give a telco a competitive advantage.

Faster innovation cycles. Depending on a vendor makes the telco dependent on its roadmap and schedule, and on the obsolescence and substitution of existing technologies. The use of out-dated technologies has a huge impact on a telco’s ability to offer new solutions in a timely fashion. An open source approach offers the possibility to upgrade and improve the existing platform (or to move to totally new technologies) without too many constraints posed by the “reference vendor”. This ability could be essential to acquiring and maintaining a technological advantage over competitors. Telcos need to clearly identify the benefits of this change, which represent the reasons, the “why”, for the softwarisation.

Complete contents of how to build an open source telecom report:

  • Executive Summary
  • Introduction: why open source?
  • Commercial pressures and technological opportunities
  • Open Source: Why Now?
  • What is open source software?
  • Open source: benefits and barriers
  • The benefits of using open source
  • Overcoming the barriers to using open source
  • Choosing the right path to open source
  • Selecting the right IT delivery model
  • Choosing the right model for the right scenario
  • Weighing the cost of open source
  • Which telcos are using open source today?
  • How can you build an open source telco?
  • Greenfield model
  • Brownfield model
  • Conclusions and recommendations
  • Controversial and challenging, yet often compelling
  • Recommendations for different kinds of telcos

Figures:

  • Figure 1: Illustrative open source costs versus a proprietary approach
  • Figure 2: Benefits of transformation and the related obstacles
  • Figure 3: The key barriers in the path of a shift to open source
  • Figure 4: Shaping an initial strategy for the adoption of open source solutions
  • Figure 5: A new open source component in an existing infrastructure
  • Figure 6: Different kinds of telcos need to select different delivery models
  • Figure 7: Illustrative estimate of Open Source costs versus a proprietary approach

How BT beat Apple and Google over 5 years

BT Group outperformed Apple and Google

Over the last five years, the share price of BT Group, the UK’s ex-incumbent telecoms operator, has outperformed those of Apple and Google, as well as a raft of other telecoms shares. The following chart shows BT’s share price in red and Apple’s in in blue for comparison.

Figure 1:  BT’s Share Price over 5 Years

Source: www.stockcharts.com

Now of course, over a longer period, Apple and Google have raced way ahead of BT in terms of market capitalisation, with Apple’s capital worth $654bn and Google $429bn USD compared to BT’s £35bn (c$53bn USD).

And, with any such analysis, where you start the comparison matters. Nonetheless, BT’s share price performance during this period has been pretty impressive – and it has delivered dividends too.

The total shareholder returns (capital growth plus all dividends) of shares in BT bought in September 2010 are over 200% despite its revenues going down in the period.

So what has happened at BT, then?

Sound basic financials despite falling revenues

Over this 5 year period, BT’s total revenues fell by 12%. However, in this period BT has also managed to grow EBITDA from £5.9bn to £6.3bn – an impressive margin expansion.   This clearly cannot go on for ever (a company cannot endlessly shrink its way to higher profits) but this has contributed to positive capital markets sentiment.

Figure 2: BT Group Revenue and EBITDA 2010/11 – 2014/15

[Figure 2]

Source: BT company accounts, STL Partners

BT pays off its debts

BT has also managed to reduce its debt significantly, from £8.8bn to £5.1bn over this period.

Figure 3: BT has reduced its debts by more than a third (£billions)


Source: BT company accounts, STL Partners

Margin expansion and debt reduction suggests good financial management but this does not explain the dramatic growth in firm value (market capitalisation plus net debt) from just over £20bn in March 2011 to circa £40bn today (based on a mid-September 2015 share price).

Figure 4: BT Group’s Firm Value has doubled in 5 Years

Source: BT company accounts, STL Partners

  • Introduction: BT’s Share Price Miracle
  • So what has happened at BT, then?
  • Sound basic financials despite falling revenues
  • Paying off its debts
  • BT Sport: a phenomenal halo effect?
  • Will BT Sport continue to shine?
  • Take-Outs from BT’s Success


  • Figure 1: BT’s Share Price over 5 Years
  • Figure 2: 5-Year Total Shareholder Returns Vs Revenue Growth for leading telecoms players
  • Figure 3: BT Group Revenue and EBITDA 2010/11-2014/15
  • Figure 4: BT has reduced its debts by more than a third (£billions)
  • Figure 5: BT Group’s Firm Value has doubled in 5 Years
  • Figure 6: BT Group has improved key market valuation ratios
  • Figure 7: BT ‘broadband and TV’ compared to BT Consumer Division
  • Figure 8: Comparing Firm Values / Revenue Ratios
  • Figure 9: BT Sport’s impact on broadband

Telstra: Battling Disruption and Growing Enterprise Cloud & ICT

Introduction

A Quick Background on the Australian Market

Australia’s incumbent telco is experiencing the same disruptive forces as others, just not necessarily in the same way. Political upheaval around the National Broadband Network (NBN) project is one example. Others are the special challenges of operating in the outback, in pursuit of their universal service obligation, and in the Asian enterprise market, at the same time. Telstra’s area of operations include both some of the sparsest and some of the densest territories on earth.

Australian customers are typically as digitally-literate as those in western Europe or North America, and as likely to use big-name global Web services, while they live at the opposite end of the longest submarine cable runs in the world from those services. For many years, Telstra had something of a head start, and the cloud and data centre ecosystem was relatively undeveloped in Australia, until Amazon Web Services, Microsoft Azure, and Rackspace deployed in the space of a few months presenting a first major challenge. Yet Telstra is coping.

Telstra: doing pretty well

Between H2 2009 and H2 2014 – half-yearly reporting for H1 2015 is yet to land – top-line revenue grew 1% annually, and pre-tax profits 3%. As that suggests, margins have held up, but they have only held up. – Net margin was 16% in 2014, while EBITDA margin was 43% in 2009 and 41% in 2014, having gone as low as 37% in H2 2010. This may sound lacklustre, but it is worth pointing that Verizon typically achieves EBITDA margins in this range from its wireless operation alone, excluding the commoditised and capital-intensive landline business. Company-wide EBITDA margins in the 40s are a sound performance for a heavily regulated incumbent. Figure 1 shows sales, EBITDA and net margins, and VZW’s last three halves for comparison.

Figure 1: Telstra continues to achieve group-wide EBITDA margins like VZW’s

Source: STL Partners, Telstra filings

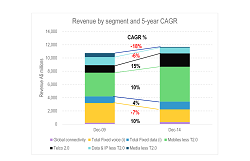
Looking at Telstra’s major operating segments, we see a familiar pattern. Fixed voice is sliding, while the mobile business has taken over as the core business. Fixed data is growing slowly, as is the global carrier operation, while enterprise fixed is declining slowly as the traditional voice element and older TDM services shrink. On the other hand, “Network Applications & Services” – Telstra’s strategic services group capturing new-wave enterprise products and the cloud – is growing strongly, and we believe that success in Unified Communications and Microsoft Office 365 underpins that growth in particular. A one-off decrease since 2009 is that CSL New World, a mobile network operator in Hong Kong, was sold at the end of 2014.

Figure 2: Mobile and cloud lead the way

Source: STL Partners, Telstra filings

Telstra is growing some new Telco 2.0 revenue streams

Another way of looking at this is to consider the segments in terms of their size, and growth. In Figure 2, we plot these together and also isolate the ‘Telco 2.0’ elements of Telstra from the rest. We include the enterprise IP access, Network Applications & Services, Pay-TV, IPTV, and M2M revenue lines in Telco 2.0 here, following the Telco 2.0 Transformation Index categorisations.

Figure 3: Telco 2.0 is a growing force within Telstra

Source: STL Partners, Telstra filings

The surge of mobile and the decline of fixed voice are evident. So is the decline of the non-Telco 2.0 media businesses – essentially directories. This stands out even more so in the context of the media business unit.

Figure 4: Telstra’s media businesses, though promising, aren’t enough to replace the directories line of business

Source: STL Partners, Telstra filings

“Content” here refers to “classified and advertising”, aka the directory and White Pages business. The Telco 2.0 businesses, by contrast, are both the strongest growth area and a very significant segment in terms of revenue – the second biggest after mobile, bigger even than fixed voice, as we can see in Figure 5.

Figure 5: Telco 2.0 businesses overtook fixed voice in H2 2014

Source: STL Partners, Telstra filings

To reiterate what is in the Telco 2.0 box, we identified 5 sources of Telco 2.0 revenue at Telstra – pay-TV, IPTV, M2M, business IP access, and the cloud-focused Network Applications & Services (NA&S) sub-segment. Their performance is shown in Figure 6. NA&S is both the biggest and by far the fastest growing.


  • Executive Summary
  • Introduction
  • A quick background on the Australian Market
  • Telstra: doing pretty well
  • Telstra is growing some new Telco 2.0 revenue streams
  • Cloud and Enterprise ICT are key parts of Telstra’s story
  • Mobile is getting more competitive
  • Understanding Australia’s Cloud Market
  • Australia is a relatively advanced market
  • Although it has some unique distinguishing features
  • The Australian Cloud Price Disruption Target
  • The Healthcare Investments: A Big Ask
  • Conclusions and Recommendations


  • Figure 1: Telstra continues to achieve group-wide EBITDA margins like VZW’s
  • Figure 2: Mobile and cloud lead the way
  • Figure 3: Telco 2.0 is a growing force within Telstra
  • Figure 4: Telstra’s media businesses, though promising, aren’t enough to replace the directories line of business
  • Figure 5: Telco 2.0 businesses overtook fixed voice in H2 2014
  • Figure 6: Cloud is the key element in Telstra’s Telco 2.0 strategy
  • Figure 7: NA&S is by far the strongest enterprise business at Telstra
  • Figure 8: Enterprise fixed is under real competitive pressure
  • Figure 9: Telstra Mobile subscriber KPIs
  • Figure 10: Telstra Mobile is strong all round, but M2M ARPU is a problem, just as it is for everyone
  • Figure 11: Australia is a high-penetration digital market
  • Figure 12: Australia is a long way from most places, and links to the Asia Pacific Cable Network (APCN) could still be better
  • Figure 13: The key Asia Pacific Cable Network (APCN) cables
  • Figure 14: Telstra expects rapid growth in intra-Asian trade in cloud services
  • Figure 15: How much?
  • Figure 16: A relationship, but a weak one – don’t count on data sovereignty

The European Telecoms market in 2020, Report 2: 4 scenarios and 7 predictions

Introduction

The second report in The European Telecoms market in 2020, this document uses the framework introduced in Report 1 to develop four discrete scenarios for the European telecoms market in 2020.  Although this report can be read on its own, STL Partners suggests that more value will be derived from reading Report 1 first.

The role of this report

Strategists (and investors) are finding it very difficult to understand the many and varied forces affecting the telecoms industry (Report 1), and predict the structure of, and returns from, the European telecoms market in 2020 (the focus of this Report 2).  This, in turn, makes it challenging to determine how operators should seek to compete in the future (the focus of a STL Partners report in July, Four strategic pathways to Telco 2.0).

In summary, The European Telecoms market in 2020 reports therefore seek to:

  • Identify the key forces of change in Europe and provide a useful means of classifying them within a simple and logical 2×2 framework (Report 1);
  • Help readers refine their thoughts on how Europe might develop by outlining four alternative ‘futures’ that are both sufficiently different from each other to be meaningful and internally consistent enough to be realistic (Report 2);
  • Provide a ‘prediction’ for the future European telecoms market based on our own insights plus two ‘wisdom of crowds’ votes conducted at a recent STL Partners event for senior managers from European telcos (Report 2).

Four European telecoms market scenarios for 2020

The second report in The European Telecoms market in 2020, this document uses the framework introduced in Report 1 to develop four discrete scenarios for the European telecoms market in 2020.  Although this report can be read on its own, STL Partners suggests that more value will be derived from reading Report 1 first.

Overview

STL Partners has identified the following scenarios for the European market in 2020:

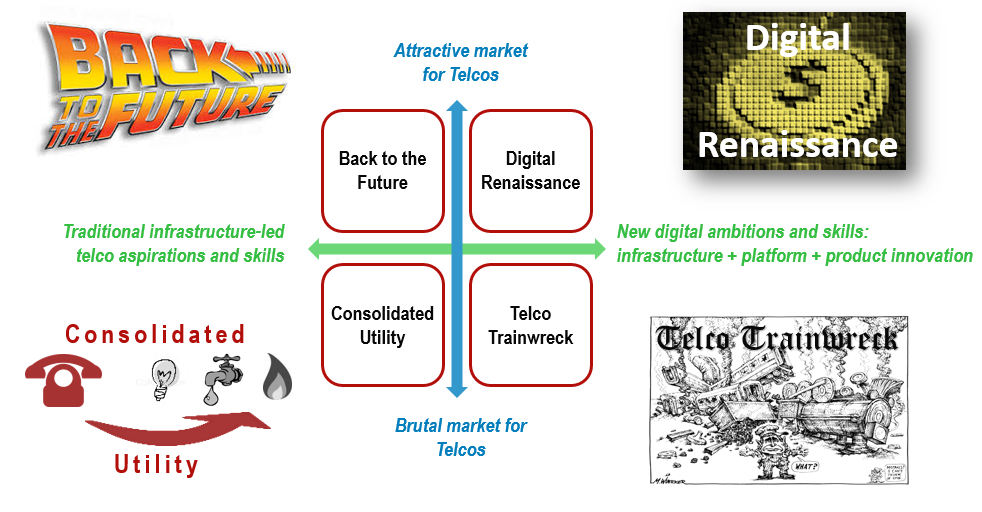
  1. Back to the Future. This scenario is likely to be the result of a structurally attractive telecoms market and one where operators focus on infrastructure-led ‘piping’ ambition and skills.
  2. Consolidated Utility. This might be the result of the same ‘piping’ ambition in a structurally unattractive market.
  3. Digital Renaissance. A utopian world resulting from new digital ambitions and skills developed by operators coupled with an attractive market.
  4. Telco Trainwreck. As the name suggests, a disaster stemming from lofty digital ambitions being pursued in the face of an unattractive telco market.

The four scenarios are shown on the framework in Figure 1 and are discussed in detail below.

Figure 1: Four European telecoms market scenarios for 2020

Source: STL Partners/Telco 2.0

How each scenario is described

In addition to a short overview, each scenario will be examined by exploring 8 key characteristics which seek to reflect the combined impact of the internal and external forces laid out in the previous section:

  1. Market Structure. The absolute and relative size and overall number of operators in national markets and across the wider EU region.
  2. Operator service pricing and profits. The price levels and profit performance of telecoms operators (and the overall industry) and the underlying direction (stable, moving up, moving down).
  3. The role of content in operators’ service portfolios. The importance of IPTV, games and applications within operators’ consumer offering and the importance of content, software and applications within operators’ enterprise portfolio.
  4. The degree to which operators can offer differentiated services. How able operators are to offer differentiated network services to end users and, most importantly, upstream service providers based on such things as network QoS, guaranteed maximum latency, speed, etc.
  5. The relationships between operators and NEP/IT players. Whether NEP and IT players continue to predominantly sell their services to and through operators (to other enterprises) or whether they become ‘Under the Floor’ competitors offering network services directly to enterprises.
  6. Where service innovation occurs – in the network/via the operator vs at the edge/via OTT players. The extent to which services continue to be created ‘at the edge’ – with little input from the network – or are ‘network-reliant’ or, even, integrated directly into the network. The former clearly suggests continued dominance by OTT players and the latter a swing towards operators and the telecoms industry.
  7. The attitude of the capital markets (and the availability of capital). The willingness of investors to have their capital reinvested for growth by telecoms operators as opposed to returned to them in the form of dividends. Prospects of sustained growth from operators will lead to the former whereas profit stasis or contraction will result in higher yields.
  8. Key industry statistics. Comparison between 2020 and 2015 for revenue and employees – tangible numbers that demonstrate how the industry has changed.

The European macro-economy – a key assumption

The health and structure of all industries in Europe is dependent, to a large degree, on the European macro-economy. Grexit or Brexit, for example, would have a material impact on growth throughout Europe over the next five years.  Our assumption in these scenarios is that Europe experiences a stable period of low-growth and that the economic positions of the stretched Southern European markets, particularly Italy and Spain, improves steadily.  If the European economic position deteriorates then opportunities for telecoms growth of any sort is likely to disappear.


  • Executive Summary
  • Introduction
  • The role of this report
  • Four European telecoms market scenarios for 2020
  • Overview
  • How each scenario is described
  • The European macro-economy – a key assumption
  • Back to the Future
  • Consolidated Utility
  • Digital Renaissance
  • Telco Trainwreck
  • Risk and returns in the scenarios
  • Making predictions
  • Wisdom of crowds: 2 approaches
  • Approach 1: Aggregating individual forces – ‘Sum-of-the-parts’
  • Approach 2: Picking a scenario
  • STL Partners’ prediction for the European telecoms market in 2020
  • STL Partners and Telco 2.0: Change the Game


  • Figure 1: Four European telecoms market scenarios for 2020
  • Figure 2: Back to the Future – key characteristics
  • Figure 3: Consolidated Utility – key characteristics
  • Figure 4: Digital Renaissance – key characteristics
  • Figure 5: Telco Trainwreck – key characteristics
  • Figure 6: Risk and returns in the four scenarios
  • Figure 7: Europe’s future based on aggregating individual forces – ‘Sum-of-the-parts’
  • Figure 8: Europe’s future – results of the two approaches compared

Winning Strategies: Differentiated Mobile Data Services

Introduction

Verizon’s performance in the US

Our work on the US cellular market – for example, in the Disruptive Strategy: “Uncarrier” T-Mobile vs VZW, AT&T, and Free.fr  and Free-T-Mobile: Disruptive Revolution or a Bridge Too Far?  Executive Briefings – has identified that US carrier strategies are diverging. The signature of a price-disruption event we identified with regard to France was that industry-wide ARPU was falling, subscriber growth was unexpectedly strong (amounting to a substantial increase in penetration), and there was a shakeout of minor operators and MVNOs.

Although there are strong signs of a price war – for example, falling ARPU industry-wide, resumed subscriber growth, minor operators exiting, and subscriber-acquisition initiatives such as those at T-Mobile USA, worth as much as $400-600 in handset subsidy and service credit – it seems that Verizon Wireless is succeeding while staying out of the mire, while T-Mobile, Sprint, and minor operators are plunged into it, and AT&T may be going that way too. Figure 1 shows monthly ARPU, converted to Euros for comparison purposes.

Figure 1: Strategic divergence in the US

Figure 1 Strategic Divergence in the US
Source: STL Partners, themobileworld.com

We can also look at this in terms of subscribers and in terms of profitability, bringing in the cost side. The following chart, Figure 2, plots margins against subscriber growth, with the bubbles set proportional to ARPU. The base year 2011 is set to 100 and the axes are set to the average values. We’ve named the four quadrants that result appropriately.

Figure 2: Four carriers, four fates

Figure 2 Four carriers four fate
Source: STL Partners

Clearly, you’d want to be in the top-right, top-performer quadrant, showing subscriber growth and growing profitability. Ideally, you’d also want to be growing ARPU. Verizon Wireless is achieving all three, moving steadily north-west and climbing the ARPU curve.

At the same time, AT&T is gradually being drawn into the price war, getting closer to the lower-right “volume first” quadrant. Deep within that one, we find T-Mobile, which slid from a defensive crouch in the upper-left into the hopeless lower-left zone and then escaped via its price-slashing strategy. (Note that the last lot of T-Mobile USA results were artificially improved by a one-off spectrum swap.) And Sprint is thrashing around, losing profitability and going nowhere fast.

The usual description for VZW’s success is “network differentiation”. They’re just better than the rest, and as a result they’re reaping the benefits. (ABI, for example, reckons that they’re the world’s second most profitable operator on a per-subscriber basis  and the world’s most profitable in absolute terms.) We can restate this in economic terms, saying that they are the most efficient producer of mobile service capacity. This productive capacity can be used either to cut prices and gain share, or to increase quality (for example, data rates, geographic coverage, and voice mean-opinion score) at higher prices. This leads us to an important conclusion: network differentiation is primarily a cost concept, not a price concept.

If there are technical or operational choices that make network differentiation possible, they can be deployed anywhere. It’s also possible, though, that VZW is benefiting from structural factors, perhaps its ex-incumbent status, or its strong position in the market for backbone and backhaul fibre, or perhaps just its scale (although in that case, why is AT&T doing so much worse?). And another possibility often mooted is that the US is somehow a better kind of mobile market. Less competitive (although this doesn’t necessarily show up in metrics like the Herfindahl index of concentration), supposedly less regulated, and undoubtedly more profitable, it’s often held up by European operators as an example. Give us the terms, they argue, and we will catch up to the US in LTE deployment.

As a result, it is often argued in lobbying circles that European markets are “too competitive” or in need of “market repair”, and therefore, the argument runs, the regulator ought to turn a blind eye to more consolidation or at least accept a hollowing out of national operating companies. More formally, the prices (i.e. ARPUs) prevailing do not provide a sufficient margin over operators’ fixed costs to fund discretionary investment. If this was true, we would expect to find little scope for successful differentiation in Europe.

Further, if the “incumbent advantage” story was true of VZW over and above the strategic moves that it has made, we might expect to find that ex-incumbent, converged operators were pulling into the lead across Europe, benefiting from their wealth of access and backhaul assets. In this note, we will try to test these statements, and then assess what the answer might be.

How do European Operators compare?

We selected a clutch of European mobile operators and applied the same screen to identify what might be happening. In doing so we chose to review the UK, German, French, Swedish, and Italian markets jointly with the US, in an effort to avoid a purely European crisis-driven comparison.

Figure 3: Applying the screen to European carriers

Figure 3 Applying the screen to European carriers

Source: STL Partners

Our first observation is that the difference between European and American carriers has been more about subscriber growth than about profitability. The axes are set to the same values as in Figure 2, and the data points are concentrated to their left (showing less subscriber growth in Europe) not below them (less profitability growth).

Our second observation is that yes, there certainly are operators who are delivering differentiated performance in the EU. But they’re not the ones you might expect. Although the big converged incumbents, like T-Mobile Germany, have strong margins, they’re not increasing them and on the whole their performance is average only. Nor is scale a panacea, which brings us to our next observation.

Our third observation is that something is visible at this level that isn’t in the US: major opcos that are shrinking. Vodafone, not a company that is short of scale, gets no fewer than three of its OpCos into the lower-left quadrant. We might say that Vodafone Italy was bound to suffer in the context of the Italian macro-economy, as was TIM, but Vodafone UK is in there, and Vodafone Germany is moving steadily further left and down.

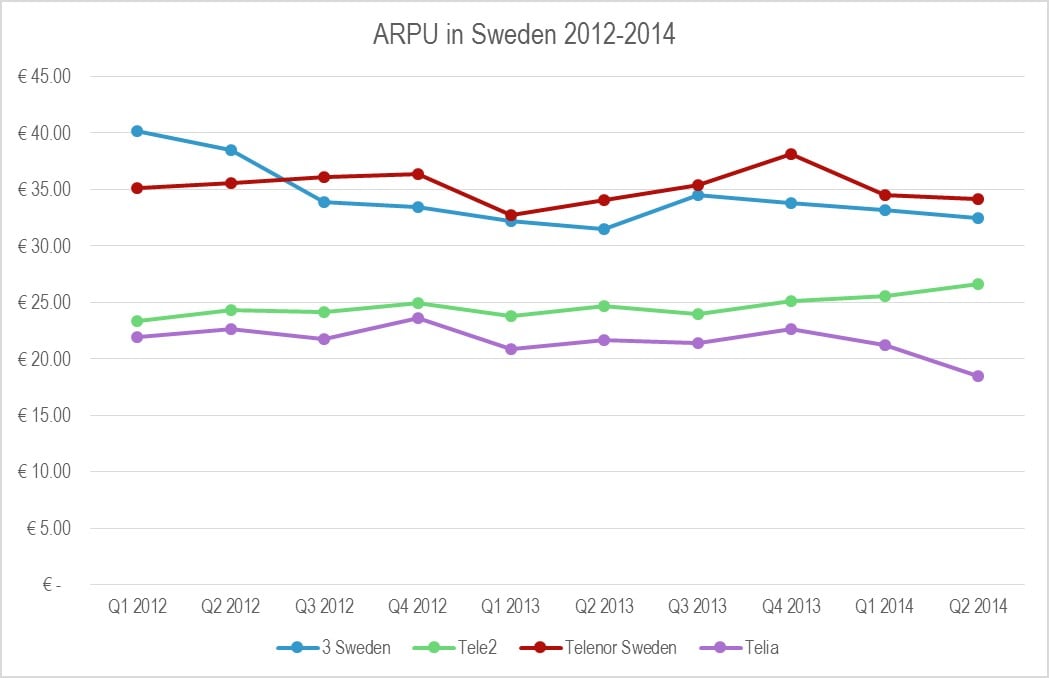
And our fourth observation is the opposite, significant growth. Hutchison OpCo 3UK shows strong performance growth, despite being a fourth operator with no fixed assets and starting with LTE after first-mover EE. Their sibling 3 Sweden is also doing well, while even 3 Italy was climbing up until the last quarter and it remains a valid price warrior. They are joined in the power quadrant with VZW by Telenor’s Swedish OpCo, Telia Mobile, and O2 UK (in the last two cases, only marginally). EE, for its part, has only marginally gained subscribers, but it has strongly increased its margins, and it may yet make it.

But if you want really dramatic success, or if you doubt that Hutchison could do it, what about Free? The answer is that they’re literally off the chart. In Figure 4, we add Free Mobile, but we can only plot the first few quarters. (Interestingly, since then, Free seems to be targeting a mobile EBITDA margin of exactly 9%.)

The distinction here is between the pure-play, T-Mobile-like price warriors in the lower right quadrant, who are sacrificing profitability for growth, and the group we’ve identified, who are improving their margins even as they gain subscribers. This is the signature of significant operational improvement, an operator that can move traffic more efficiently than its competitors. Because the data traffic keeps coming, ever growing at the typical 40% annual clip, it is necessary for any operator to keep improving in order to survive. Therefore, the pace of improvement marks operational excellence, not just improvement.

Figure 4: Free Mobile, a disruptive force that’s literally off the charts

Figure 4 Free Mobile a disruptive force thats literally off the charts

Source: STL Partners

We can also look at this at the level of the major multinational groups. Again, Free’s very success presents a problem to clarity in this analysis – even as part of a virtual group of independents, the ‘Indies’ in Figure 5, it’s difficult to visualise. T-Mobile USA’s savage price cutting, though, gets averaged out and the inclusion of EE boosts the result for Orange and DTAG. It also becomes apparent that the “market repair” story has a problem in that there isn’t a major group committed to hard discounting. But Hutchison, Telenor, and Free’s excellence, and Vodafone’s pain, stand out.

Figure 5: The differences are if anything more pronounced within Europe at the level of the major multinationals

Figure 5 The differences are if anything more pronounced within Europe at the level of the major multinationals

Source: STL Partners

In the rest of this report we analyse why and how these operators (3UK, Telenor Sweden and Free Mobile) are managing to achieve such differentiated performance, identify the common themes in their strategic approaches and the lessons from comparison to their peers, and the important wider consequences for the market.


  • Executive Summary
  • Introduction
  • Applying the Screen to European Mobile
  • Case study 1: Vodafone vs. 3UK
  • 3UK has substantially more spectrum per subscriber than Vodafone
  • 3UK has much more fibre-optic backhaul than Vodafone
  • How 3UK prices its service
  • Case study 2: Sweden – Telenor and its competitors
  • The network sharing issue
  • Telenor Sweden: heavy on the 1800MHz
  • Telenor Sweden was an early adopter of Gigabit Ethernet backhaul
  • How Telenor prices its service
  • Case study 3: Free Mobile
  • Free: a narrow sliver of spectrum, or is it?
  • Free Mobile: backhaul excellence through extreme fixed-mobile integration
  • Free: the ultimate in simple pricing
  • Discussion
  • IP networking metrics: not yet predictive of operator performance
  • Network sharing does not obviate differentiation
  • What is Vodafone’s strategy for fibre in the backhaul?
  • Conclusions


  • Figure 1: Strategic divergence in the US
  • Figure 2: Four carriers, four fates
  • Figure 3: Applying the screen to European carriers
  • Figure 4: Free Mobile, a disruptive force that’s literally off the charts
  • Figure 5: The differences are if anything more pronounced within Europe at the level of the major multinationals
  • Figure 6: Although Vodafone UK and O2 UK share a physical network, O2 is heading for VZW-like territory while VF UK is going nowhere fast
  • Figure 7: Strategic divergence in the UK
  • Figure 8: 3UK, also something of an ARPU star
  • Figure 9: 3UK is very different from Hutchison in Italy or even Sweden
  • Figure 10: 3UK has more spectrum on a per-subscriber basis than Vodafone
  • Figure 11: Vodafone’s backhaul upgrades are essentially microwave; 3UK’s are fibre
  • Figure 12: 3 Europe is more than coping with surging data traffic
  • Figure 13: 3UK service pricing
  • Figure 14: The Swedish market shows a clear winner…
  • Figure 15: Telenor.se is leading on all measures
  • Figure 16: How Swedish network sharing works
  • Figure 17: Network sharing does not equal identical performance in the UK
  • Figure 18: Although extensive network sharing complicates the picture, Telenor Sweden has a strong position, especially in the key 1800MHz band
  • Figure 19: If the customers want more data, why not sell them more data?
  • Figure 20: Free Mobile, network differentiator?
  • Figure 21: Free Mobile, the price leader as always
  • Figure 22: Free Mobile succeeds with remarkably little spectrum, until you look at the allocations that are actually relevant to its network
  • Figure 23: Free’s fixed-line network plans
  • Figure 24: Free leverages its FTTH for outstanding backhaul density
  • Figure 25: Free: value on 3G, bumper bundler on 4G
  • Figure 26: The carrier with the most IPv4 addresses per subscriber is…
  • Figure 27: AS_PATH length – not particularly predictive either
  • Figure 28: The buzzword count. “Fibre” beats “backhaul” as a concern
  • Figure 29: Are Project Spring’s targets slipping?


The value of “Smart Pipes” to mobile network operators

Preface

Rationale and hypothesis for this report

It is over fourteen years since David Isenberg wrote his seminal paper The Rise of the Stupid Network in which he outlined the view that telephony networks would increasingly become dumb pipes as intelligent endpoints came to control how and where data was transported. Many of his predictions have come to fruition. Cheaper computing technology has resulted in powerful ‘smartphones’ in the hands of millions of people and new powerful internet players are using data centres to distribute applications and services ‘over the top’ to users over fixed and mobile networks.

The hypothesis behind this piece of research is that endpoints cannot completely control the network. STL Partners believes that the network itself needs to retain intelligence so it can interpret the information it is transporting between the endpoints. Mobile network operators, quite rightly, will not be able to control how the network is used but must retain the ability within the network to facilitate a better experience for the endpoints. The hypothesis being tested in this research is that ‘smart pipes’ are needed to:

  1. Ensure that data is transported efficiently so that capital and operating costs are minimised and the internet and other networks remain cheap methods of distribution.
  2. Improve user experience by matching the performance of the network to the nature of the application or service being used. ‘Best effort’ is fine for asynchronous communication, such as email or text, but unacceptable for voice. A video call or streamed movie requires guaranteed bandwidth, and real-time gaming demands ultra-low latency;
  3. Charge appropriately for use of the network. It is becoming increasingly clear that the Telco 1.0 business model – that of charging the end-user per minute or per Megabyte – is under pressure as new business models for the distribution of content and transportation of data are being developed. Operators will need to be capable of charging different players – end-users, service providers, third-parties (such as advertisers) – on a real-time basis for provision of broadband and guaranteed quality of service (QoS);
  4. Facilitate interactions within the digital economy. Operators can compete and partner with other players, such as the internet companies, in helping businesses and consumers transact over the internet. Networks are no longer confined to communications but are used to identify and market to prospects, complete transactions, make and receive payments and remittances, and care for customers. The knowledge that operators have about their customers coupled with their skills and assets in identity and authentication, payments, device management, customer care etc. mean that ‘the networks’ can be ‘enablers’ in digital transactions between third-parties – helping them to happen more efficiently and effectively.

Overall, smarter networks will benefit network users – upstream service providers and end users – as well as the mobile network operators and their vendors and partners. Operators will also be competing to be smarter than their peers as, by differentiating here, they gain cost, revenue and performance advantages that will ultimately transform in to higher shareholder returns.

Sponsorship and editorial independence

This report has kindly been sponsored by Tellabs and is freely available. Tellabs developed the initial concepts, and provided STL Partners with the primary input and scope for the report. Research, analysis and the writing of the report itself was carried out independently by STL Partners. The views and conclusions contained herein are those of STL Partners.

About Tellabs

Tellabs logo

Tellabs innovations advance the mobile Internet and help our customers succeed. That’s why 43 of the top 50 global communications service providers choose our mobile, optical, business and services solutions. We help them get ahead by adding revenue, reducing expenses and optimizing networks.

Tellabs (Nasdaq: TLAB) is part of the NASDAQ Global Select Market, Ocean Tomo 300® Patent Index, the S&P 500 and several corporate responsibility indexes including the Maplecroft Climate Innovation Index, FTSE4Good and eight FTSE KLD indexes. http://www.tellabs.com

Executive Summary

Mobile operators no longer growth stocks

Mobile network operators are now valued as utility companies in US and Europe (less so APAC). Investors are not expecting future growth to be higher than GDP and so are demanding money to be returned in the form of high dividends.

Two ‘smart pipes’ strategies available to operators

In his seminal book, Michael Porter identified three generic strategies for companies – ‘Cost leadership’, ‘Differentiation’ and ‘Focus’. Two of these are viable in the mobile telecommunications industry – Cost leadership, or Happy Pipe in STL Partners parlance, and Differentiation, or Full-service Telco 2.0. No network operators have found a Focus strategy to work as limiting the customer base to a segment of the market has not yielded sufficient returns on the high capital investment of building a network. Even MVNOs that have pursued this strategy, such as Helio which targeted Korean nationals in the US, have struggled.

Underpinning the two business strategies are related ‘smart pipe’ approaches – smart network and smart services:

Normal
0

false
false
false

EN-GB
X-NONE
X-NONE


Porter

Strategy

Telco 2.0 strategy

Nature of smartness

Characteristics

Cost leadership

Happy Pipe

Smart network

Cost efficiency – minimal network, IT and commercial costs.  Simple utility offering.

Differentiation

Full-service Telco 2.0

Smart services

Technical and commercial flexibility: improve customer experience by integrating network capabilities with own and third-party services and charging either end user or service provider (or both).

Normal
0

false
false
false

EN-GB
X-NONE
X-NONE

Source: STL Partners

It is important to note that, currently at least, having a smart network is a precursor of smart services.  It would be impossible for an operator to implement a Full-service Telco 2.0 strategy without having significant network intelligence.  Full-service Telco 2.0 is, therefore, an addition to a Happy Pipe strategy.

Smart network strategy good, smart services strategy better

In a survey conducted for this report, it was clear that operators are pursuing ‘smart’ strategies, whether at the network level or extending beyond this into smart services, for three reasons:

  • Revenue growth: protecting existing revenue sources and finding new ones.  This is seen as the single most important driver of building more intelligence.
  • Cost savings: reducing capital and operating costs.
  • Performance improvement: providing customers with an improved customer experience.

Assuming that most mobile operators currently have limited smartness in either network or services, our analysis suggests significant upside in financial performance from successfully implementing either a Happy Pipe or Full-service Telco 2.0 strategy.  Most mobile operators generate Cash Returns on Invested Capital of between 5 and 7%.  For the purposes of our analysis, we have a assumed a baseline of 5.8%.  The lower capital and operator costs of a Happy Pipe strategy could increase this to 7.4% and the successful implementation of a Full-service Telco 2.0 strategy would increase this to a handsome 13.3%:

Normal
0

false
false
false

EN-GB
X-NONE
X-NONE

Telco 2.0 strategy

Nature of smartness

Cash Returns on Invested Capital

As-is – Telco 1.0

Low – relatively dumb

5.8%

Happy Pipe

Smart network

7.4%

Full-service Telco 2.0

Smart services

13.3%

Source: STL Partners

STL Partners has identified six opportunity areas for mobile operators to exploit with a Full-service Telco 2.0 strategy.  Summarised here, these are outlined in detail in the report:

Opportunity Type

Approach

Typical Services

Core Services

Improving revenues and customer loyalty by better design, analytics, and smart use of data in existing services.

Access, Voice and Messaging, Broadband, Standard Wholesale, Generic Enterprise ICT Services (inc. SaaS)

Vertical industry solutions (SI)

Delivery of ICT projects and support to vertical enterprise sectors.

Systems Integration (SI), Vertical CEBP solutions, Vertical ICT, Vertical M2M solutions, and Private Cloud.

Infrastructure services

Optimising cost and revenue structures by buying and selling core telco ICT asset capacity.

Bitstream ADSL, Unbundled Local Loop, MVNOs, Wholesale Wireless, Network Sharing, Cloud – IaaS.

Embedded communications

Enabling wider use of voice, messaging, and data by facilitating access to them and embedding them in new products.

Comes with data, Sender pays delivery, Horizontal M2M Platforms, Voice, Messaging and Data APIs for 3rd Parties.

Third-pary business enablers

Enabling new telco assets (e.g. Customer data) to be leveraged in support of 3rd party business processes.

Telco enabled Identity and Authorisation, Advertising and Marketing, Payments. APIs to non-core services and assets.

Own-brand OTT services

Building value through Telco-owned online properties and ‘Over-the-Top’ services.

Online Media, Enterprise Web Services, Own Brand VOIP services.


Source: STL Partners

Normal
0

false
false
false

EN-GB
X-NONE
X-NONE

Regional approaches to smartness vary

As operators globally experience a slow-down in revenue growth, they are pursuing ways of maintaining margins by reducing costs.  Unsurprisingly therefore, most operators in North America, Europe and Asia-Pacific appear to be pursuing a Happy Pipe/smart network strategy.  Squeezing capital and operating costs and improving network performance is being sought through such approaches as:

  • Physical network sharing – usually involving passive elements such as towers, air-conditioning equipment, generators, technical premises and pylons.
  • Peering data traffic rather than charging (and being charged) for transit.
  • Wi-Fi offload – moving data traffic from the mobile network on to cheaper fixed networks.
  • Distributing content more efficiently through the use of multicast and CDNs.
  • Efficient network configuration and provisioning.
  • Traffic shaping/management via deep-packet inspection (DPI) and policy controls.
  • Network protection – implementing security procedures for abuse/fraud/spam so that network performance is maximised.
  • Device management to ameliorate device impact on network and improve customer experience

Vodafone Asia-Pacific is a good example of an operator pursuing these activities aggressively and as an end in itself rather than as a basis for a Telco 2.0 strategy.  Yota in Russia and Lightsquared in the US are similarly content with being Happy Pipers.

In general, Asia-Pacific has the most disparate set of markets and operators.  Markets vary radically in terms of maturity, structure and regulation and operators seem to polarise into extreme Happy Pipers (Vodafone APAC, China Mobile, Bharti) and Full-Service Telco 2.0 players (NTT Docomo, SK Telecom, SingTel, Globe).

In Telefonica, Europe is the home of the operator with the most complete Telco 2.0 vision globally.  Telefonica has built and acquired a number of ‘smart services’ which appear to be gaining traction including O2 Priority Moments, Jajah, Tuenti and Terra.  Recent structural changes at the company, in which Telefonica Digital was created to focus on opportunities in the digital economy, further indicate the company’s focus on Telco 2.0 and smart services.  Europe too appears to be the most collaborative market.  Vodafone, Telefonica, Orange, Telecom Italia and T-Mobile are all working together on a number of Telco 2.0 projects and, in so doing, seek to generate enough scale to attract upstream developers and downstream end-users.

The sheer scale of the two leading mobile operators in the US, AT&T and Verizon, which have over 100 million subscribers each, means that they are taking a different approach to Telco 2.0.  They are collaborating on one or two opportunities, notably with ISIS, a near-field communications payments solution for mobile, which is a joint offer from AT&T, Verizon and T-Mobile.  However, in the main, there is a high degree of what one interviewee described as ‘Big Bell dogma’ – the view that their company is big enough and powerful enough to take on the OTT players and ‘control’ the experiences of end users in the digital economy.  The US market is more consolidated than Europe (giving the big players more power) but, even so, it seems unlikely that either AT&T or Verizon can keep customers using only their services – the lamented wall garden approach.

Implementing a Telco 2.0 strategy is important but challenging

STL Partners explored both how important and how difficult it is to implement the changes required to deliver a Happy Pipe strategy (outlined in the bullets above) and those needed for Full-service Telco 2.0 strategy, via industry interviews with operators and a quantitative survey.  The key findings of this analysis were:

  • Overall, respondents felt that many activities were important as part of a smart strategy.  In our survey, all except two activity areas – Femto/pico underlay and Enhanced switches (vs. routers) – were rated by more than 50% of respondents as either ‘Quite important’ or ‘Very important’ (see chart below).
  • Activities associated with a Full-service Telco 2.0 strategy were rated as particularly important:
  • Making operator assets available via APIs, Differentiated pricing and charging and Personalised and differentiated services were ranked 1, 2 and 3 out of the thirteen activities.
  • Few considered that any of the actions were dangerous and could destroy value, although Physical network sharing and Traffic shaping/DPI were most often cited here.
Smart Networks - important implementation factors to MNOs
Source: STL Partners/Telco 2.0 & Tellabs ‘Smart pipes’ survey, July 2011, n=107

NOTE: Overall ranking was based on a weighted scoring policy of Very important +4, Quite important +3, Not that important +2, Unimportant +1, Dangerous -4.

Overall, most respondents to the survey and people we spoke with felt that operators had more chance in delivering a Happy Pipe strategy and that only a few Tier 1 operators would be successful with a Full-Service Telco 2.0 strategy.  For both strategies, they were surprisingly sceptical about operators’ ability to implement the necessary changes.  Five reasons were cited as major barriers to success and were particularly big when considering a Full-Service Telco 2.0 strategy:

  1. Competition from internet players.  Google, Apple, Facebook et al preventing operators from expanding their role in the digital economy.
  2. Difficulty in building a viable ecosystem. Bringing together the required players for such things as near-field communications (NFC) mobile payments and sharing value among them.
  3. Lack of mobile operators skills.  The failure of operators to develop or exploit key skills required for facilitating transactions such as customer data management and privacy.
  4. Culture.  Being too wedded to existing products, services and business models to alter the direction of the super-tanker.
  5. Organisation structure. Putting in place the people and processes to manage the change.

Looking at the specific activities required to build smartness, it was clear that those required for a Full-service Telco 2.0/smart services strategy are considered the hardest to implement (see chart below):

  • Personalised and differentiated services via use of customer data – content, advertising, etc.
  • Making operator assets available to end users and other service providers – location, presence, ID, payments
  • Differentiated pricing and charging based on customer segment, service, QoS
Smart Networks - how challenging are the changes?
Source: STL Partners/Telco 2.0 & Tellabs ‘Smart pipes’ survey, July 2011, n=100

NOTE: Overall ranking was based on a weighted scoring policy of Very easy +5, Relatively straightforward +4, Manageable +3, Quite difficult +2, Very difficult -2.

Conclusions and recommendations

By comparing the relative importance of specific activities against how easy they are to implement, we were able to classify them into four categories:

Category

Importance for delivering smart strategy

Relative ease of implementation

Must get right

High

Easy

Strive for new role

High

Difficult

Housekeeping

Low

Easy

Forget

Low

Difficult

Rating of factors needed for Telco 2.0 'Smart Pipes' and 'Full Services' Strategies
Source: STL Partners/Telco 2.0 & Tellabs ‘Smart pipes’ survey, July 2011, n=100

Unfortunately, as the chart above shows, no activities fall clearly into the ‘Forget’ categories but there are some clear priorities:

  • A Full-service Telco 2.0 strategy is about striving for a new role in the digital economy and is probably most appropriate for Tier 1 MNOs, since it is going to require substantial scale and investment in new skills such as software and application development and customer data.  It will also require the development of new partnerships and ecosystems and complex commercial arrangements with players from other industries (e.g. banking). 
  • There is a cluster of smart network activities that are individually relatively straightforward to implement and will yield a big bang for the buck if investments are made – the ‘Must get right’ group:
  • More efficient network configuration and provisioning;
  • Strengthen network security to cope with abuse and fraud;
  • Improve device management (and cooperation with handset manufacturers and content players) to reduce the impact of smartphone burden on the network;

Although deemed more marginal in our survey, we would include as equally important:

  • Traffic shaping and DPI which, in many cases, underpins various smart services opportunities such as differentiated pricing based on QoS and Multicast and CDNs which are proven in the fixed world and likely to be equally beneficial in a video-dominated mobile one.

There is second cluster of smart network activities which appear to be equally easy (or difficult) to implement but are deemed by respondents to be lower value and therefore fall into a lower ‘Housekeeping’ category:

  • Wi-Fi offload – we were surprised by this given the emphasis placed on this by NTT Docomo, China Mobile, AT&T, O2 and others;
  • Peering (vs. transit) and Enhanced switches  – this is surely business-as-usual for all MNOs;
  • Femto/Pico underlay – generally felt to be of limited importance by respondents although a few cited its importance in pushing network intelligence to the edge which would enable MNOs to more easily deliver differentiated QoS and more innovative retail and wholesale revenue models;
  • Physical network sharing – again, a surprising result given the keenness of the capital markets on this strategy. 


Overall, it appears that mobile network operators need to continue to invest resources in developing smart networks but that a clear prioritisation of efforts is needed given the multitude of ‘moving parts’ required to develop a smart network that will deliver a successful Happy Pipe strategy.

A successful Full-Service Telco 2.0 strategy is likely to be extremely profitable for a mobile network operator and would result in a substantial increase in share price.  But delivering this remains a major challenge and investors are sceptical.  Collaboration, experimentation and investment are important facets of a Telco 2.0 implementation strategy as they drive scale, learning and innovation respectively.  Given the demands of investors for dividend yields, investment is only likely to be available if an operator becomes more efficient, so implementing a Happy Pipe strategy which reduces capital and operating costs is critical.


Report Contents


  • Executive Summary
  • Mobile network operator challenges
  • The future could still be bright
  • Defining a ‘smart’ network
  • Understanding operator strategies
  • Video: Case study in delivering differentiation and cost leadership
  • The benefits of Smart on CROIC
  • Implementing a ‘smart’ strategy
  • Conclusions and recommendations

Report Figures


  • Figure 1: Pressure from all sides for operators
  • Figure 2: Vodafone historical dividend yield – from growth to income
  • Figure 3: Unimpressed capital markets and falling employment levels
  • Figure 4: Porter and Telco 2.0 competitive strategies
  • Figure 5: Defining Differentiation/Telco 2.0
  • Figure 6 – The Six Opportunity Areas – Approach, Typical Services and Examples
  • Figure 7: Defining Cost Leadership/Happy Pipe
  • Figure 8: Defining ‘smartness’
  • Figure 9: Telco 2.0 survey – Defining smartness
  • Figure 10: NTT’s smart content delivery system – a prelude to mobile CDNs?
  • Figure 11: Vodafone India’s ARPU levels are now below $4/month, illustrating the need for a ‘smart network’ approach
  • Figure 12: China Mobile’s WLAN strategy for coverage, capacity and cost control
  • Figure 13: GCash – Globe’s text-based payments service
  • Figure 14: PowerOn – SingTel’s on-demand business services
  • Figure 15: Telefonica’s Full-service Telco 2.0 strategy
  • Figure 16: Vodafone – main messages are about being an efficient data pipe
  • Figure 17: Collaboration with other operators key to smart services strategy
  • Figure 18: Verizon Wireless and Skype offering
  • Figure 19: Content delivery with and without a CDN
  • Figure 20: CDN benefits to consumers are substantial
  • Figure 21: Cash Returns on Invest Capital of different Telco 2.0 opportunity areas
  • Figure 22: The benefits of smart to a MNO are tangible and significant
  • Figure 23: Telco 2.0 Survey – benefits of smart to MNOs
  • Figure 24: Telco 2.0 survey – MNO chances of success with smart strategies
  • Figure 25: Telco 2.0 survey – lots of moving parts required for ‘smartness’
  • Figure 26: Telco 2.0 survey – Differentiation via smart services is particularly challenging
  • Figure 27: Telco 2.0 survey – Implementing changes is challenging
  • Figure 28: Telco 2.0 survey – Prioritising smart implementation activities