How the Coordination Age changes the game

Introduction: Three ages of telecoms…

In this report, we elaborate on what we outlined in our recent report, The Coordination Age: A third age of telecoms, as a completely new paradigm for the telecoms industry. In the earlier report, we argue that this new age of telecoms – the Coordination Age – follows on from two previous, and still ongoing, paradigms for the telecoms industry: the Communications Age and the Information Age.

Chronologically, the three ages may be represented as follows:

The coordination age is beginning now

As the above diagram suggests, parts of the industry still exhibit characteristics of the earlier ages; and we are still working through the consequences of the paradigm shift from the Communications Age to the Information Age, even as we stand on the cusp of a further shift to the Coordination Age.

The report revisits our narrative of the three ages of telecoms to explore the different social, economic and cultural drivers and functions of telecoms in each period and the implications for telcos.

Enter your details below to request an extract of the report

var MostRecentReportExtractAccess = “Most_Recent_Report_Extract_Access”;
var AllReportExtractAccess = “All_Report_Extract_Access”;
var formUrl = “https://go.stlpartners.com/l/859343/2022-02-16/dg485”;
var title = encodeURI(document.title);
var pageURL = encodeURI(document.location.href);
document.write(‘‘);

Telecoms characteristics and functions have evolved over time

The fundamental service and business model characteristics of these three ages, as described in the previous report, are recapped in Figure 2 below:

Figure 2: Basic functions of telecoms in the three telco eras

telecoms functions across three ages

Source: STL Partners

The above table illustrates how the functions provided by telecoms services and networks across the three ages of the industry are radically different. In summary, we can say that:

  • In the Communications Age, telecoms networks and services were ‘physical’ in character: physical equipment and facilities delivering physical services; the core services being connectivity and communications centering on voice, which was transmitted by physical means (e.g. for voice, analogue electrical signals sent over wired or wireless networks).
  • In the Information Age, by contrast, while telecoms networks remained – initially, at least – physical in character and delivered increasingly advanced forms of connectivity, the services became digital. The ultimate expression of this is of course the Internet, which changed the role of the telco to that of providing the IP connectivity platform over which mainly third parties offered their web and digital services. Another way of putting this is that whereas telecoms network connectivity remained tied to physical hardware, the services were delivered via standardised software and compute devices: PCs and later smartphones and tablets. In the present era of NFV and SDN, the basis on which the connectivity itself is organised and controlled is now also migrating to (would-be) standardised software operating over COTS hardware.
  • The emerging Coordination Age of telecoms is not purely an extension of network and societal digitisation, but could be seen as a 180o reversal of its parameters, in this respect: instead of being a primarily physical connectivity system processing digital inputs to deliver digital services (as in the Information Age), the network becomes a compute- and software-centric system processing real-world inputs to deliver real-world outcomes. We will discuss further these aspects of the new paradigm later in this report. But examples of what we mean here include networked compute-driven applications around driverless cars, IoT, and automation of industrial and enterprise processes across many verticals.

The three telecoms ages correspond to different socio-economic and human functions

We set out how the general service and network characteristics of the Communications, Information and Coordination Ages relate to the different social, economic and human functions they serve.

Throughout this report, we describe what we see as some of the fundamental social, economic, cultural and technological drivers of the different telecoms networks and services across these three ages. The three ages represent distinct paradigms in which telecoms serves different needs and purposes.

We describe these socio-economic and cultural purposes through a simplified version of the psychoanalytical theories of Jacques Lacan. It seems legitimate to explore telecoms through this lens, as telecoms networks are human constructs, and telecoms services are social, economic and cultural in their purpose and value to modern society.

In brief, Jacques Lacan distinguishes between three interdependent orders of psychological experience: the ‘Real’, the ‘Imaginary’ and the ‘Symbolic’.

  • The ‘Real’ is the physical aspect of our existence: our bodies, the material universe, and the physiological determinants experience, including basic emotions
  • The ‘Imaginary’ refers to the sub-rational and sub-linguistic phenomena of mental experience, through which we form mental impressions of sensory experience (e.g. sights, sounds, etc.). Together with the emotional impact with which they are associated, these ‘imaginary’ elements form the foundation of our self-image and view of our place in the world
  • The third order is that of the ‘Symbolic’, which refers to language and other social, logical and cultural codes through which we give meaning to our lives, acquire knowledge, order our activities, and structure society and our relationships within it.

This is important because it provides a way to make sense of the paradigm shifts that have taken place throughout the industry’s history. And it also provides a narrative account of the human needs – including economic and social needs – that are invested in telecoms services. Understanding what customers want – and above all, what can offer real benefit to them – is the key to driving future value.

We argue this is relevant to the situation that telcos find themselves in today and to their strategic options for the future. In our view, telcos failed to adapt their business models to capitalise on the digital service opportunities of the Information Age. This was because the value drivers of the Information Age were so radically different from those that prevailed over the much longer time span of the Communications Age.

Learning the lessons from this previous paradigm shift will help telcos be more aware of how they need to adapt to another new paradigm – the Coordination Age – that is emerging. There may be only a very short window of opportunity for telcos to adjust their business models and organisations to become ‘coordinators’ of the network- and AI-based, automation-enabling and resource-optimising services of the near future.

Contents:

  • Executive Summary
  • Introduction: Three Ages of Telecoms
  • Differing characteristics and functions of telecoms across the three ages
  • The three telecoms ages correspond to different socio-economic and human functions
  • Speaking, showing and doing: The three ages of telecoms
  • The Communications Age: A telecoms of the Real, mediated by voice
  • The Information Age: A telecoms of the Imaginary, mediated by the screen
  • The Coordination Age: A telecoms of outcomes, driven by active intelligence
  • Coordination services rely on contextual and physical data, and the physical aspects of networking
  • Summary: Characteristics and purposes of telecoms across its three ages
  • Conclusions
  • Recommendations: A new telco age brings new opportunities but also renewed responsibilities

Figures:

  1. The three ages of telecoms.
  2. Basic functions of telecoms in the three telco eras
  3. ‘Real’, physical characteristics of the Communications Age telecoms network and service
  4. The core telecoms service – circuit-switched telephony – in the first telecoms age
  5. Comparison of the social, service and technology characteristics of Communications Age and Information Age telecoms
  6. Permanent, virtual presence to others replaces real-time voice communications
  7. Driverless car ecosystem in the Coordination Age
  8. Comparison between the three telecoms eras

Enter your details below to request an extract of the report

var MostRecentReportExtractAccess = “Most_Recent_Report_Extract_Access”;
var AllReportExtractAccess = “All_Report_Extract_Access”;
var formUrl = “https://go.stlpartners.com/l/859343/2022-02-16/dg485”;
var title = encodeURI(document.title);
var pageURL = encodeURI(document.location.href);
document.write(‘‘);

The Coordination Age: A third age of telecoms

The Coordination Age

The world is entering the Coordination Age, driven by growing needs for resource efficiency and enabled by new technologies such as AI, automation, IoT, 5G, etc. What does this mean, how is it different, how is it an opportunity, and what should telecoms industry players do?

Problems, problems, problems…

The telecoms industry’s big problem

The core telecoms industry is currently close to reaching maturity as the following chart illustrates.

Figure 1: Revenue growth is grinding to a halt

Source: Data from company filings, STL Partners analysis

This approaching maturity has taken many years to achieve and is built on decades of astonishing growth in the telecoms and ICT industries as shown by just a few data points in Figure 2.

Figure 2: 30 years of telecoms in context

Source: AT&T company reports, STL Partners analysis

We’ve used AT&T as a comparator as perhaps the world’s best-known telco, and because its 1988 revenues are readily accessible. The chart shows that AT&T has grown massively but also that recent growth has slowed.

It also shows how mobile and internet use has blossomed to mass-market adoption. No-one knew in 1988 that this is what would happen by 2018, or how it would happen. Most people would have thought you were talking about science fiction if you said there would be more mobiles than people in their lifetime, and that half the world would have access to most of the world’s information.

Yet it was clear that growth in telecoms lay ahead – it seemed like a kind of economic and social gravity that communications would grow a lot. The direction that the world would take was obvious and unavoidable. So many people were not yet connected, and so much was possible in terms of improving the world’s access to information using the technologies that were coming to fruition then.

Enter your details below to request an extract of the report

var MostRecentReportExtractAccess = “Most_Recent_Report_Extract_Access”;
var AllReportExtractAccess = “All_Report_Extract_Access”;
var formUrl = “https://go.stlpartners.com/l/859343/2022-02-16/dg485”;
var title = encodeURI(document.title);
var pageURL = encodeURI(document.location.href);
document.write(‘‘);

What are the big problems the world needs to solve now?

It’s not a mystery now, of course. And while there’s plenty of work to do to make the world’s connectivity better and bring the second half of the global population online somehow, it’s unlikely to bring in masses of new revenues for telcos. So why the Coordination Age?

To create major growth, you need to solve some big, valuable problems. So, what are the big problems the world needs to solve?

There are some obvious candidates, e.g.:

  • mitigating climate change and minimising its effects
  • reducing the amount of waste and harmful by-products polluting the environment
  • the distribution and availability of human resources and services such as healthcare, education, employment, and entertainment
  • the availability of, and conflicts over, physical resources such as: water, fuel, power, food, land, etc…
  • global migration and increasingly hostile nationalism
  • concerns over increasingly skewed wealth distribution between the haves and have nots, and extreme poverty
  • a desire for greater business efficiency and productivity
  • concerns over employment due to automation and global economic changes.

Moreover, time is also a resource for people and business. Both want to make best use of their time – whether it is getting things done more effectively or enjoyably.

Making the most of what we have

STL Partners believes that these are all to some extent the manifestation of the same problem: the need to make the most efficient possible use of your/the world’s resources. In Figure 3 we call this helping to “make our world run better” for short.

Figure 3: How macro forces are creating a common global need

Source: STL Partners

It’s a widespread need

The underlying need for greater resource efficiency is widespread. While sustainability arguments are prominent symptoms of the problem, there are pressing needs being expressed in all areas of the economy for better utilisation of resources.

For example, most businesses are somewhere in the process of their own transformation using connected digital technologies. Almost every aspect of business, including product design, customer experience, production, delivery and value chain orchestration is being revolutionised by ‘digital’ technologies and applications.

Examples cited at the Total Telecom Congress in October 2018, included:

  • Brendan Ives, VP Telia, Division X, said that the top priority of 70% of 500 enterprises surveyed in the Nordics was resource efficiency, with cost control a distant second at 20%.
  • Henri Korpi, Executive Vice President, New Business Development, Elisa, described a new ‘Smart Factory’ application that it offers to enhance productivity.
  • Durdana Achakzai, Chief Digital Officer, Telenor Pakistan, described its Khushall Zamindar feature phone application for 6 million small-scale farmers in rural Pakistan, that gives them access to local weather and market information and helps to improve yields.

All of these are examples of where telcos are already thinking about or addressing customers’ needs with respect to resource efficiency, in all of these cases via a B2B application, but the concerns apply to consumers too.

Ipsos’s global survey on consumer concerns from July 2018 (Figure 4) gives a flavour of what people across the world worry about today. The colouring applied to categorise the issues is STL Partners’, based on our view of their relevance to resource utilisation and distribution (and hence the Coordination Age).

Figure 4: Global population worries reflect underlying concerns about the availability and distribution of resources

Source: Ipsos global survey, July 2018, STL Partners analysis

Clearly, the weighting of needs varies in different countries, but most of the most pressing concerns relate to the distribution of economic resources within society (red bars). Concerns on social resources such as education and healthcare (orange bars) are second in prominence, while more classic ‘environmental’ worries (grey bars) are slightly further down the list.

People’s concerns also vary with their current circumstances. The closer you are to the bread-line, the more likely you are to prioritise where your next meal is coming from over the long-term future. Hence there is a natural tendency for near-term concerns to feature more highly on the list.

Many other day-to-day concerns relate to the efficient use of time (another resource): prompt service, availability of resources on-demand, business productivity, etc.

The fundamental enabler needed is coordination: the ability to enable many different players, devices, solutions, etc., to work together across the economy. These players and assets are a diverse mixture of both physical and digital entities. The drive to allow them to work together must be widespread and ultimately systematic – hence the Coordination Age.

The thorny issue of sustainability

We now live in a world of seven billion people that uses 1.7 times its sustainable resources (Figure 5). The argument goes that if we keep on at this rate we will face major environmental and societal pains and problems.

Figure 5: What does “the world need now”?

Source: Global Footprint Network

Climate change is arguably one consequence of the over-use of resources. Not everyone buys in to such concerns, and it is a matter for each person to make their own mind up.

However, even traditionally highly conservative bodies like the UN’s International Panel on Climate Change Panel (IPCC) are sounding alarm bells. In its recent report “Global Warming of 1.5 °C”, the IPCC says we may not even have thirty years to avoid the worst problems.

The editorial in The New Scientist put it like this:

“We still have time to pull off a rescue. It will arguably be the largest project that humanity has ever undertaken – comparable with the two world wars, the Apollo programme, the cold war, the abolition of slavery, the Manhattan project, the building of the railways and the roll-out of sanitation and electrification, all in one. In other words, it will require us to strain every muscle of human ingenuity in the hope of a better future, if not for ourselves then at least for our descendants.”[1]

The challenge is huge, and it reaches across all economies and sectors, not just telecoms.

Enlightened self-interest

STL Partners believes that telcos and the telecoms industry can play a significant role in addressing these issues, and moreover that the industry should move in this direction for both business and social reasons.

This should not be treated as a PR opportunity as it sometimes has in the past, as a kind of fop to regulators and governments in exchange for regulatory preferences.

It is a serious and significant problem to solve for humanity – and solving such problems is also how industries create new value in the economy.

Nonetheless, STL Partners believes that if telecoms industry players genuinely take on the challenges of addressing these issues, it may well have a significant impact on their sometimes-troubled relationships with governments and regulators. It’s one thing to be a big economic player in a market, which most telcos are, and quite another to be a big economic and social partner in an economy.

By truly aligning these goals and interests with governments telcos can start to foster a new dialogue “what do we need to do together for our economy?” This requires a very different level of heart-and-soul engagement than a well-intentioned but peripheral gesture under the Corporate Social Responsibility (CSR) banner.

Moving the needle…

Internally, the industry has long faced two self-defeating challenges.

First, the idea of ‘moving the needle’. So many new opportunities are dismissed because they simply don’t seem big enough for a telco to bother, and telcos continue to search for the next ‘killer app’ like mobile data or SMS.

Despite looking for many years, it still hasn’t been found. Yet somehow the telecoms industry has missed out on capitalising on social media, search, online commerce – pretty much all growth industries of the last twenty years.

Why? For many reasons, no doubt. But there has certainly been a kind of well-fed corporate complacency, a general aversion to commitment to new ideas, and a huge reduction in investment in R&D and innovation. Telcos’ R&D spends are minuscule compared to technology players. We will publish more on this soon, and why we think telcos need to change.

This has gone arm-in-arm with a failure to understand that new business models are not linear and predictable. A sound business case is all very well when you have a predictable business environment. This is typically the case when looking at incremental changes to existing businesses where the consequences are relatively predictable.

In new areas, especially where there are network effects and other unpredictable and non-linear relationships, it’s very hard to do. Even if you succeeded in making a numerical model, most would frown heavily at the assumptions and their consequences, and the decision-making process would stagnate on uncertainty.

Where companies have been successful in building new value, they have at some point made a serious management commitment against a need that they recognise will persist in their market, continued to invest in it, and be willing to admit and learn from mistakes. We would cite TELUS in Healthcare, and Vodafone’s M-PESA as examples where leadership has protected and nurtured the fragile flower of innovation through to growth.

… and moving the people

The second big internal challenge to change and growth has been much of the telecoms industry’s inability to excite its people to buy in to the uncertain and worrying process of change.

Change and its accompanying uncertainties are uncomfortable for most people, and they need support, guidance and ultimately leadership to see them through. Too often, companies only truly address change when they sense the ‘burning platform’ – a (usually threatening) reason that means they simply must abandon their current beliefs and behaviours.

And frankly, why should most employees care about, for example, their company ‘becoming digital’? They care about being paid, having a job with some status, and being reasonably comfortable with what they must do and who they do it with. They are working to support themselves and their families. To most, “becoming digital” sounds like another excuse for a round of job cuts – which in some cases it is.

Our argument is that there is now a powerful new job for telecoms companies to do in the Coordination Age, and that this means we all must change. If we don’t do that job and make those changes, the future will potentially be much worse for us and them as we age, and their kids as they grow.

We believe that the additional insight in the story as we now see it should make it compelling to customers, employees, governments and shareholders. But first, the management of the telecoms industry need to grasp it, improve it and lead the rest forward.

Contact us to get a full copy of the report.

Contents:

  • Executive summary
  • Problems, problems, problems…
  • The telecoms industry’s big problem
  • What are the big problems the world needs to solve now?
  • Enlightened self-interest
  • Moving the needle…
  • … and moving the people
  • The Three Ages of Telecoms
  • The first age: The Communications Age, 1850s onwards
  • The second age: The Information Age, 1990s onwards
  • The third age: The Coordination Age, 201Xs onwards
  • So, what is the Coordination Age opportunity for telcos?
  • The telecoms industry has some important assets
  • Two possible jobs for telecoms
  • Having a clear role is motivational
  • So, what should telcos and the industry do?
  • Finally, a need for the technologies we’re developing
  • Conclusions and next steps

Figures:

  • Figure 1: Revenue growth is grinding to a halt
  • Figure 2: 30 years of telecoms in context
  • Figure 3: How macro forces are creating a common global need
  • Figure 4: Global population worries reflect underlying concerns about the availability and distribution of resources
  • Figure 5: What does “the world need now”?
  • Figure 6: The three ages of telecoms
  • Figure 7: The Communication Age
  • Figure 8: An early manual telephone exchange
  • Figure 9: Electro-mechanical ‘Strowger’ exchanges automated analogue switching
  • Figure 10: The Information Age
  • Figure 11: The Coordination Age
  • Figure 12: What are the unique assets of the telecoms industry?
  • Figure 13: Broadly, there are two possible jobs for telcos
  • Figure 14: Battle of the business models – Technology vs Telco
  • Figure 15: A new corporate reality
  • Figure 16: How a unifying purpose (a “why?”) helps create value

[1] The New Scientist, Vol 240 No. 3199, page 1.

Enter your details below to request an extract of the report

var MostRecentReportExtractAccess = “Most_Recent_Report_Extract_Access”;
var AllReportExtractAccess = “All_Report_Extract_Access”;
var formUrl = “https://go.stlpartners.com/l/859343/2022-02-16/dg485”;
var title = encodeURI(document.title);
var pageURL = encodeURI(document.location.href);
document.write(‘‘);

Making big beautiful: Multinational operators need the telco cloud

Telcos’ (economies of) scale in perspective

As a result of their wide regional or global footprints, multi-country operators typically generate tens of billions of USD in revenues. By this measure, telcos’ scale (as defined by their revenues) is indeed comparable with the likes of Google and Facebook (see Figure 2). However, we can consider scale through a different lens as well: defined by the number of users, it becomes evident that telcos are dwarfed relative to the large internet companies. When considering the number of users, the telecoms industry is more fragmented than the internet sector – resulting in the unfavourable comparison, since no one telco can achieve a similar customer-base.

The fragmented nature of the global telecommunications industry means that telcos tend to struggle to create so-called demand-side economies of scale. These economies of scale rely on network effects stemming from the value generated by having a large number of users. In such a case, there is both inherent value in the use of the service and value derived from other people’s use of the service.

Enter your details below to request an extract of the report

var MostRecentReportExtractAccess = “Most_Recent_Report_Extract_Access”;
var AllReportExtractAccess = “All_Report_Extract_Access”;
var formUrl = “https://go.stlpartners.com/l/859343/2022-02-16/dg485”;
var title = encodeURI(document.title);
var pageURL = encodeURI(document.location.href);
document.write(‘‘);

The big success of the internet giants can, in part, be attributed to significant network effects. Telcos, on the other hand, are in a tougher position. Partly this is due to the nature of the services they traditionally provide. Unlike the internet giants who can reach anyone around the world with an internet connection, telcos are have largely been limited to serving users in the countries in which they operate networks.
Despite this, large operators should – in theory – be well-equipped to create so-called supply-side economies of scale due to the sheer size of their business. With telecoms being a high fixed-costs business, the cost of providing telco services per customer falls as the number of customers increases.

Figure 2: Some telcos are big – but they are unable to create the same network effects as the internet giants

So, have these large multinational telcos managed to create scale effects? Unfortunately, we find rather sobering evidence to the contrary. Figure 3 shows that multi-country operators tend to underperform the industry average. Large European multi-country operators – such as Orange, Telefonica, Vodafone and Deutsche Telekom – all underperform the telco global average operating margin of 17%. On the other hand, large single-market operators, namely AT&T and Verizon, achieve margins above the global average.

Figure 3: European giants struggle to create economies of scale

Contents:

  • Executive Summary
  • Multinational telcos have struggled to create economies of scale
  • A Telco Cloud strategy can deliver scale economies for multinational operators
  • Introduction – Economies of scale in telecoms
  • International expansion has delivered a global footprint for some telcos
  • Telcos’ (economies of) scale in perspective
  • Multinational telcos need to revisit their approach to creating economies of scale
  • The dilemma of multinational telcos – can Telco Cloud help overcome it?
  • Telco Cloud: a brave new world?
  • The cost problem: multinational telcos need to create synergies across markets
  • The revenue problem: multinationals need to calibrate the right innovation model across markets
  • The traditional Opco-driven innovation has inherent problems
  • Centralisation of innovation isn’t the answer either
  • What is the right model for telcos?
  • Conclusions

Enter your details below to request an extract of the report

var MostRecentReportExtractAccess = “Most_Recent_Report_Extract_Access”;
var AllReportExtractAccess = “All_Report_Extract_Access”;
var formUrl = “https://go.stlpartners.com/l/859343/2022-02-16/dg485”;
var title = encodeURI(document.title);
var pageURL = encodeURI(document.location.href);
document.write(‘‘);

Digital M&A and Investment Strategies – July 2017 update

Introduction

Digital M&A as a telco strategy

In June 2016 STL Partners published our inaugural Digital M&A and Investment Strategies report and accompanying database, focussing on key digital acquisitions and investments for 22 operators during the period 2012 – H1 2016. We have now updated this report to cover the following 12 months (H2 2016 – H1 2017), to examine new developments in telco digital M&A and a comparison with previous activities.

Communications service providers have long used M&A as a key growth strategy, with the most common approach being to acquire other operators to build scale organically. As growth in telecommunications slowed and user behaviour swung towards mobile, so M&A activity in the mobile sector has increased. However, acquisition opportunities in mature markets are becoming limited as consolidation reduces the number of telcos, whilst in Europe and North America the regulatory environment has made M&A consolidation strategies less viable.

As operators continue to build digital capabilities and strive to deliver digital services and content, M&A and investment beyond ‘traditional telecoms’ is increasing. Telcos need to move beyond a traditional, slow ‘infrastructure-only’ approach, to one focused on agility rather than stability, enablement rather than end-to-end ownership and delivery of solutions, and innovation as well as operational excellence. This report explores the drivers of digital M&A and the strategies of different operators including ‘deep-dive’ analysis of Verizon, AT&T and SoftBank. There is an accompanying database which tracks telco M&A activity for the period.

Drivers for operator M&A and majority investment

Figure 1: Drivers for operator M&A and majority investment – traditional and digital

digital M&A graphic

Source: STL Partners

Traditional/Telco 1.0 drivers: reach and scale

As illustrated in Figure 1, what we refer to as ‘traditional’ or ‘Telco 1.0’ drivers for M&A and investment are well-established:

  1. Extending geographic footprint is a common trend, as many operator groups look to:
    • Enter new markets that are adjacent geographically (e.g. DTAG’s numerous investments in CEE region operators, America Movil’s investments in LatAm),
    • Enter markets that are linked culturally or linguistically (e.g., Telefonica’s acquisitions and investments in Latin American operators),
    • Enter markets that simply offer good opportunities for expanded footprint and increased efficiencies of operation in emerging regions where demand for mobile services is still growing strongly (e.g., SingTel and Etisalat’s numerous investments in operators in Asia and Africa, respectively).
  2. Extending traditional communications offerings is currently the most significant trend, as mobile operators look to acquire fixed network assets and vice versa, to develop compelling multiplay and converged offers for their customers. The recent BT acquisition of EE in the UK is one example.
  3. Consolidation has slowed to some extent, as regulators and competitors fight against mergers or acquisitions that remove players from the market or concentrate too much market power in the hands of stronger service providers. This has been a particular issue in the European Union, where regulators have refused to approve several proposed telecoms M&A deals recently, including Telia and Telenor in Denmark in 2015, and the proposed Hutchison acquisition of Telefónica’s O2 to merge with its subsidiary 3 UK in 2016. Other deals, such as the proposed Orange-Bouygues Telecom merger in France which was abandoned in April 2016, have failed due to the parties involved failing to reach agreement. However, our research shows continued interest in operator M&A for consolidation, with recent examples including Orange’s acquisition of Sun Communications in Moldova in 2016, and Vodafone’s merger with Indian rival Idea in 2017.
  4. The acquisition of service partners – primarily channel partners, or partner companies providing systems integration and consultancy capabilities, typically for enterprise customers – has proved an important driver of M&A for many (mainly converged) operators.
  5. Finally, operator M&A is also being driven by the enthusiasm of sellers. Many operators are looking to sell off assets outside of their home markets, pulling back from markets that have proven too competitive, too small or simply too complicated, as part of a strategy to pay down debt and/or free up assets for investment in other higher-growth areas:
    • Telia’s pullback from its non-core markets has seen it sell off its majority stakes in Spanish operator Yoigo to Masmovil and in Kazakhstan’s Kcell to Turkcell in 2016
    • Telefonica’s attempt to sell its O2 UK mobile unit to CK Hutchison having failed, the Spanish operator is now looking to other ways of raising capital both to pay down its debt, including a planned IPO of O2 UK.

Contents:

  • Executive Summary
  • Evaluating operator digital investment strategies
  • Key findings
  • Recommendations
  • Introduction
  • Drivers for operator M&A and majority investment
  • Evaluating operator digital investment strategies
  • 22 players across 5 regions: US shows the most aggressive M&A activity
  • Comparison with previous period (H1 2012 – H1 2016)
  • European telcos remain largely focussed on Telco 1.0 M&A
  • Which sectors are attracting the most interest?
  • Telco M&A investment is falling behind other verticals
  • What are the cultural challenges to digital M&A in the boardroom?
  • Operator M&A Strategies in detail: Consolidation, content and technology
  • M&A as a telco growth strategy
  • Adapting telco culture to ensure digital M&A success
  • Recommendations

Figures:

  • Figure 1: Drivers for operator M&A and majority investment – traditional and digital
  • Figure 2: Number of operator digital acquisitions and majority investments, H2 2016-H1 2017
  • Figure 3: Largest 7 telco digital M&A and majority investments, H2 2016-H1 2017
  • Figure 4: Number of operator digital acquisitions and majority investments, H1 2012 – H1 2016
  • Figure 5: Operator digital acquisitions and majority investments, H1 2012-H1 2017
  • Figure 6: Largest 10 telco digital M&A and majority investments, H1 2012 – H1 2016
  • Figure 7: Mapping of operator digital M&A strategies
  • Figure 8: Number of digital M&A and majority investments by sector/category, H2 2016-H1 2017
  • Figure 9: Comparison of investment in digital M&A as a percentage of service revenues, 2012-H1 2017

B2B growth: How can telcos win in ICT?

Introduction

The telecom industry’s growth profile over the last few years is a sobering sight. As we have shown in our recent report Which operator growth strategies will remain viable in 2017 and beyond?, yearly revenue growth rates have been clearly slowing down globally since 2009 (see Figure 1). In three major regions (North America, Europe, Middle East) compound annual growth rates have even been behind GDP growth.


Figure 1: Telcos’ growth performance is flattening out (Sample of sixty-eight operators)

Source: Company accounts; STL Partners analysis

To break out of this decline telcos are constantly searching for new sources of revenue, for example, by expanding into adjacent, digital service areas which are largely placed within mass consumer markets (e.g. content, advertising, commerce).

However, in our ongoing conversations with telecoms operators, we increasingly come across the notion that a large part of future growth potential might actually lie in B2B (business-to-business) markets and that this customer segment will have an increasing impact of overall revenue growth.

This report investigates the rationale behind this thinking in detail and tries to answer the following key questions:

  1. What is the current state of telco’s B2B business?
  2. Where are the telco growth opportunities in the wider enterprise ICT arena?
  3. What makes an enterprise ICT growth strategy difficult for telcos to execute?
  4. What are the pillars of a successful strategy for future B2B growth?


  • Executive Summary
  • Introduction
  • Telcos may have different B2B strategies, but suffer similar problems
  • Finding growth opportunities within the wider enterprise ICT arena could help
  • Three complications for revenue growth in enterprise ICT
  • Complication 1: Despite their potential, telcos struggle to marshal their capabilities effectively
  • Complication 2: Telcos are not alone in targeting enterprise ICT for growth
  • Complication 3: Telcos’ core services are being disrupted by OTT players – this time in B2B
  • STL Partners’ recommendations: strategic pillars for future B2B growth
  • Conclusion


  • Figure 1: Telcos’ growth performance is flattening out (Sample of sixty-eight operators)
  • Figure 2: Telcos’ B2B businesses vary significantly by scale and performance (selected operators)
  • Figure 3: High-level structure of the telecom industry’s revenue pool (2015) – the consumer segment dominates
  • Figure 4: Orange aims to expand the share of “IT & integration services” in OBS’s revenue mix
  • Figure 5: Global enterprise ICT expenditures are projected to growth 7% p.a.
  • Figure 6: Telcos and Microsoft are moving in opposite directions
  • Figure 7: SD-WAN value chain
  • Figure 8: Within AT&T Business Solutions’ revenue mix, growth in fixed strategic services cannot yet offset the decline in legacy services

Changing Culture: The Great Barrier

Introduction

On Tuesday 6th December, STL Partners met with 17 executives from telecoms operators in SE Asia, including Singtel, Starhub, M1, Telekom Indonesia, Axiata, Bridge Alliance and Tata Communications. The group was a fairly even mix of C-Level, SVP/VP, and Strategy / ‘Heads of Digital’ roles.

The session was conducted under clear and explicit anti-trust guidelines, and had the objective to review and explore learnings in the strategic and operational transformation of telecoms business models.

Objectives of Transformation

One of STL Partners’ global observations is that all operators have different goals in the pursuit of transformation. This was also true with the group in Singapore, as shown by the following chart of a vote on the priorities assigned to different transformation objectives.

Figure 1 – Transformation priorities are different for every operator

Source: STL Partners

The subsequent discussion showed that behind these votes:

  • Improving customer engagement (and customer centricity) is a fundamental goal of almost all operators
  • Operators, like all businesses, want to manage costs, and this is generally a welcome benefit of change
  • Most operators wish to improve the fundamental agility of their businesses – to become faster to market
  • For some, creating new revenues from new services is the primary objective, while for others, it is seen as a welcome possibility once the core agility has been improved

What is the outlook for growth for telcos?

STL Partners shared findings from its recent research report Which operator growth strategies will remain viable in 2017 and beyond? that examined the growth performance of 68 operator groups globally over the last seven years.

Figure 2 – The growth performance of 68 global operator groups 2009-16

Source: STL Partners

The overall picture presented was that most telcos had enjoyed a period of good growth in this time, though latterly growth rates have slowed to an average of 2% globally. Many markets, especially in Europe, are now in decline. Voice and messaging revenues have been eroded by substitution from Internet based applications, and data competition has by and large brought strong growth in usage volumes, but not enough to make up for the declines in voice and messaging.

Can data growth ‘save the day’?

A question raised in Europe and discussed again in Asia when this analysis was presented, is whether broadband data sales can offset the declines in voice and messaging revenues. The arguments for and against this are summarised in Figure 3.

Figure 3 – The arguments for and against broadband producing long term growth

Source: STL Partners


  • Executive Summary
  • Introduction
  • Objectives of Transformation
  • What is the outlook for growth for telcos?
  • Can data growth ‘save the day’?
  • Why is transformation so difficult?
  • The challenge of achieving synergy with the core
  • So ‘going digital’ is becoming a necessity whatever your strategy
  • Opportunities for ‘Telco Cloud’ Centred Growth
  • Models for how to transform
  • The Publisher / Utility Model
  • 20 transformation metrics that matter
  • Digital Maturity Model
  • NFV/SDN Playbook
  • Case Studies of Transformation in Practice
  • Telkom Indonesia – Becoming the “King of Digital”
  • Celcom Axiata – Quick ‘HITx’ to Kick-start Transformation
  • Conclusion: how to change model and culture together?
  • 1. Establish transformational leadership and vision
  • 2. Empower and motivate people to unlock culture
  • 3. See success through a new lens (and new metrics)
  • 4. Re-engineer the guts of the business


  • Figure 1 – Transformation priorities are different for every operator
  • Figure 2 – The growth performance of 68 global operator groups 2009-16
  • Figure 3 – The arguments for and against broadband producing long term growth
  • Figure 4 – A clear majority in the group believed broadband will not sustain long-term growth
  • Figure 5 – Telco ‘digital’ plays have experienced varied success to date
  • Figure 6 – Telco Cloud services by type
  • Figure 7 – NTT Docomo is one leading benchmark for new revenue creation
  • Figure 8 – The ‘Utility’ and ‘Publisher’ Models
  • Figure 9 – A high level Digital Maturity Model
  • Figure 10 – The NFV/SDN ‘Playbook’ explained
  • Figure 11 – Telkom Indonesia’s ‘Digital Telco’ vision
  • Figure 12 – Telkom Indonesia’s Transformation Key Success Factors and Lessons
  • Figure 13 – How the HITx programme was delivered
  • Figure 14 – Which area of transformation has the greatest value, and what requires the greatest effort?
  • Figure 15 – A new business ‘stack’ for telcos?

How BT beat Apple and Google over 5 years

BT Group outperformed Apple and Google

Over the last five years, the share price of BT Group, the UK’s ex-incumbent telecoms operator, has outperformed those of Apple and Google, as well as a raft of other telecoms shares. The following chart shows BT’s share price in red and Apple’s in in blue for comparison.

Figure 1:  BT’s Share Price over 5 Years

Source: www.stockcharts.com

Now of course, over a longer period, Apple and Google have raced way ahead of BT in terms of market capitalisation, with Apple’s capital worth $654bn and Google $429bn USD compared to BT’s £35bn (c$53bn USD).

And, with any such analysis, where you start the comparison matters. Nonetheless, BT’s share price performance during this period has been pretty impressive – and it has delivered dividends too.

The total shareholder returns (capital growth plus all dividends) of shares in BT bought in September 2010 are over 200% despite its revenues going down in the period.

So what has happened at BT, then?

Sound basic financials despite falling revenues

Over this 5 year period, BT’s total revenues fell by 12%. However, in this period BT has also managed to grow EBITDA from £5.9bn to £6.3bn – an impressive margin expansion.   This clearly cannot go on for ever (a company cannot endlessly shrink its way to higher profits) but this has contributed to positive capital markets sentiment.

Figure 2: BT Group Revenue and EBITDA 2010/11 – 2014/15

[Figure 2]

Source: BT company accounts, STL Partners

BT pays off its debts

BT has also managed to reduce its debt significantly, from £8.8bn to £5.1bn over this period.

Figure 3: BT has reduced its debts by more than a third (£billions)


Source: BT company accounts, STL Partners

Margin expansion and debt reduction suggests good financial management but this does not explain the dramatic growth in firm value (market capitalisation plus net debt) from just over £20bn in March 2011 to circa £40bn today (based on a mid-September 2015 share price).

Figure 4: BT Group’s Firm Value has doubled in 5 Years

Source: BT company accounts, STL Partners

  • Introduction: BT’s Share Price Miracle
  • So what has happened at BT, then?
  • Sound basic financials despite falling revenues
  • Paying off its debts
  • BT Sport: a phenomenal halo effect?
  • Will BT Sport continue to shine?
  • Take-Outs from BT’s Success


  • Figure 1: BT’s Share Price over 5 Years
  • Figure 2: 5-Year Total Shareholder Returns Vs Revenue Growth for leading telecoms players
  • Figure 3: BT Group Revenue and EBITDA 2010/11-2014/15
  • Figure 4: BT has reduced its debts by more than a third (£billions)
  • Figure 5: BT Group’s Firm Value has doubled in 5 Years
  • Figure 6: BT Group has improved key market valuation ratios
  • Figure 7: BT ‘broadband and TV’ compared to BT Consumer Division
  • Figure 8: Comparing Firm Values / Revenue Ratios
  • Figure 9: BT Sport’s impact on broadband

Strategic Overview: Time for a New Telco 2.0 Vision

Introduction

Telecoms operators worldwide are pursuing strategies to achieve four general goals:

  • Core Competitiveness – to enhance and grow their success in established telecoms markets
  • Achieving Transformation – to lower costs and enable greater agility in their core business
  • Implementing Innovation – to employ key innovations in the core business and grow new types of revenues
  • Disruption – addressing disruptive threats and opportunities arising from and in adjacent markets and industries

The following is a summary of highlights of our recent analysis and an outline of further research planned against each of these themes. It is intended to provide readers with a summary, starting point and guide to our research as they address the themes, and includes a preamble for our latest vision of ‘Telco 2.0’ – the shape of future telcos.

Theme #1: Core Competitiveness – Telecoms Markets and Competitive Strategies

Background

STL Partners has covered the changing context of global telecoms markets for the last nine years. The broad story is that voice and messaging revenues are in decline, and that while data revenues are generally growing, they aren’t growing fast enough to replace the lost revenues.

Figure 1 – The pressure to defend existing telecoms revenues and build new ones

Source: STL Partners

Core Competitiveness: Research Highlights

In addition to slowing the decline in voice and messaging, operators need the best strategies to grow data, as well as new approaches to manage costs and deliver new value (covered in the subsequent sections of this paper). On this front:

Next Steps on Core Competitiveness

STL Partners is planning analysis including:

  • The impact of digital customer experience on customer behaviours and value creation
  • What strategies have demonstrably added value to telecoms operators?

Theme #2: Achieving Transformation – Re-organising the Core and Building Innovative Businesses

Background

Following on from our work on the Telco 2.0 Transformation Index, benchmarking the strategies of five major operators, in 2015 STL Partners has researched ‘Agility’, a key objective of change in the core business, and how to build innovative new businesses.

Figure 2 – The Telco 2.0 Agility Framework

Source: STL Partners, Agility Report

Transformation: Research Highlights

Next Steps on Telco 2.0 Transformation

STL Partners is planning analysis including:

  • What does ‘Telco 2.0’ mean today – what should a future telco look like?
  • How do recent developments in the application of new business models, technology, and organisational change unlock faster transition to new Telco 2.0 businesses?

Theme #3: Implementing Innovation in the Core – IoT, 5G and the Cloud, NFV and Future Networks

Background

IoT (the Internet of Things), 5G, and NFV (Network Functions Virtualisation) are three acronyms that at first glance seem unrelated. Yet underlying all three is that the boundaries between IT and network technologies in telecoms are starting to blur at an increasing rate. This is a highly significant trend in the industry.

Figure 3 – Improvements in the performance of generic hardware and software are starting to blur the IT/Network boundary

Source: Intel, STL Partners NFV Report

Core Innovation: Research Highlights

All in all, we see this underlying change as highly significant in terms of the structure and strategy of the telecoms industry. It will both more effectively enable new business models for telcos, enable new competition for them, and disrupt existing industry structures among telcos. It will also disrupt technology and software players partnering with telcos. It is therefore a critical strategic need to understand how this is likely to play out, and the strategies most likely to lead to success in this new world.

Next Steps on IoT, Cloud and the Future of the Network

STL Partners is planning analysis including:

  • The role of Cellular networks in the IoT
  • How the network revolution will unlock business model change
  • The impact of new software-based approaches on future of telecoms 

Theme #4: Disruption – Addressing Adjacent Threats and Opportunities

Background

Regular readers of our research are likely to be familiar with our original and market leading analysis of the internet players and major disruptors of the telecoms market, such as Dealing with the Disruptors: Google, Apple, Facebook, Amazon and Microsoft (2011) and our ongoing Dealing With Disruption in-depth research stream.

Research Highlights: Disruption

Although our article on the implications of Google’s MVNO attracted significant interest among our readers, disruption is no longer perceived as solely a threat to telcos, as evidenced by interest in analysis on:

Next Steps on Disruption

STL Partners is planning analysis including:

  • Further detailed case studies on leading telcos acting as disruptors, including new success stories in advertising and location services
  • China’s other disruptors (e.g.s Baidu, Xiaomi) and rising stars
  • Ongoing analysis of the strategies of Microsoft, Google, Apple, Amazon and Facebook

Conclusion: time for a new ‘Telco 2.0’ vision

STL Partners believes that three major practical outcomes resulting from progress across these themes are now combining to create a unique opportunity for telcos to evolve and take advantage of new markets.

New business models are starting to deliver

It is increasingly clear which new business models can be successful for telcos, and the pressure on the existing business model is no longer theoretical, it is a matter of substantial reality for most if not all telcos. The most advanced telcos have been trying out new models and some winning examples are emerging in the areas of content, enterprise ICT and B2B2C enablers.

A new virtualised technological platform will enable new ways of working

The emergence of SDN and NFV is creating a technological platform that is much more capable of delivering and supporting the agility required to deliver and sustain new businesses and new network propositions at speed than the traditional network/IT split. This will radically change both the operator and vendor industry landscape over the next few years.

In addition, and combined with the likely shape of 5G as a technology to further reduce mobile network latency, the future technological ‘shape’ of telcos looks like a highly distributed ICT infrastructure placing huge and computing resources very close to most customers. This will create many different business opportunities for telcos and not least in the delivery of content, enterprise ICT, and digital commerce.

It is becoming clearer how to organise and manage the change

The management and organisational techniques to create and sustain digital businesses are no longer a complete mystery, even though they are still evolving. And there is an increasing body, if not yet a ‘critical mass’, of people in the telecoms industry willing and able to embrace these approaches.

Time for a new ‘Telco 2.0’ vision

We believe that telcos (and their partners) that harness these insights will be best placed to maximise value creation in the future, and our research and consulting services are designed to help telecoms industry clients achieve success faster and more effectively in this future. To this end, we will shortly be setting out a new vision for ‘Telco 2.0’ – what a telecoms operator should be to create maximum value in the future, and how to get there.

Five Principles for Disruptive Strategy

Introduction

Disruption has become a popular theme, and there are some excellent studies and theories, notably the work of Clayton Christensen on disruptive innovation.

This briefing is intended to add some of our observations, ideas and analysis from looking at disruptive forces in play in the telecoms market and the adjacent areas of commerce and content that have had and will have significant consequences for telecoms.

Our analysis centres on the concept of a business model: a relatively simple structure that can be used to describe and analyse a business and its strategy holistically. The structure we typically use is shown below in Figure 1, and comprises 5 key domains: The Marketplace; Service Offering; Value Network; Finance; and Technology.

Figure 1 – A business model is the commercial architecture of a business: how it makes money

Telco 2.0: STL Partners standard business model analysis Framework

Source: STL Partners

This structure is well suited to analysis of disruption, because disruptive competition is generally a case of conflict between companies with different business models, rather than competition between similarly configured businesses.

A disruptive competitor, such as Facebook for telecoms operators, may be in a completely different core business (advertising and marketing services) seeking to further that business model by disrupting an existing telecoms service (voice and messaging communications). Or it may be a broadly similar player, such as Free in France whose primary business is recognisably telecoms, using a radically different operational model to gain share from direct competitors.

We will look at some of these examples in more depth in this report, and also call on analysis of Google, Apple, Facebook and Amazon to illustrate principles

Digital value is often transient

KPN: a brief case study in disruption

KPN, a mobile operator in the Netherlands, started to report a gradual reduction in SMS / user statistics in early 2011, after a long period of near continuous growth.

Figure 2 – KPN’s SMS stats per user started to change at the end of 2010

Telco 2.0 Figure 2 KPNs SMS stats per user stated to change at the end of 2010

Source: STL Partners, Mobile World Database

KPN linked this change to the rapid rise of the use of WhatsApp, a so-called over-the-top (OTT) messaging application it had noticed among ‘advanced users’ – a set of younger Android customers, as shown in Figure 3.

Figure 3 – WhatsApp took off in certain segments at the end of 2010

Telco 2.0 Figure 3 WhatsApp took off in certain segments at the end of 2010

Source: KPN Corporate Briefing, May 2011

There was some debate at the time about the causality of the link, but the longer term picture of use and app penetration certainly supports the connection between the rise of WhatsApp take-up among KPN’s broader base (as opposed to ‘advanced users’ in Figure 3) and the rapid decline of SMS volumes as Figure 4 shows.

Figure 4 – KPN’s SMS volumes have continued to decline since 2010

Telco 2.0 Figure 4 KPN’s SMS volumes have continued to decline since 2010

Source: STL Partners estimates, Mobile World, Telecomspaper, Statista, Comscore, KPN.

How did that happen then?

KPN’s position was particularly suited to a disruptive attack by WhatsApp (and other messaging apps) in the Netherlands because:

  • It had relatively high unit prices per SMS.
  • KPN had not ‘bundled’ many SMSs into its packages compared to other operators, and usage was very much ‘pay as you go’ – so using WhatsApp offered immediate savings to users.
  • Its market of c.17 million people is technologically savvy with high early smartphone penetration, and densely populated for such a wealthy country, so well suited to the rapid viral growth of such apps.

KPN responded by increasing the number of SMSs in bundles and attempting to ‘sell up’ users to packages with bigger bundles. It has also embarked on more recent programmes of cost reduction and simplification. But as far as SMS was concerned, the ‘horse had bolted the stable’ and the decline continues as consumers gravitate away from a service perceived as losing relevance and value.

We will look in more depth at disruptive pricing and product design strategies in the section on ‘Free is not enough, nor is it the real issue’ later in this report. This case study also presents another challenge for strategists: why did the company not act sooner and more effectively?

Denial is not a good defence

One might be forgiven for thinking that the impact of WhatsApp on KPN was all a big surprise. And perhaps to some it was. But there were plenty of people that expected significant erosion of core revenues from such disruption. In a survey we conducted in 2011, the average forecast among 300 senior global telecoms execs was that OTT services would lead to a 38% decline in SMS over the next 3-5 years, and earlier surveys had shown similar pessimism.

Having said that, it is also true that there was some shock in the market at the time over KPN’s results, and subsequent findings in other markets in Latin America and elsewhere. It is only recently that it has become more of an accepted ‘norm’ in the industry that its core revenues are subject to attack and decline.

Perhaps the best narrative explanation is one of ‘corporate denial’, akin to the human process of grief. Before we reach acceptance of a loss, individuals (and consequently teams and organisations by this theory) go through various stages of emotional response before reaching ‘acceptance’ – a series of stages sometimes characterised as ‘denial, anger, negotiation and acceptance’. This takes time, and is generally considered healthy for people’s emotional health, if not necessarily organisations’ commercial wellbeing.

So what can be done about this? It’s hard to change nature, but it is possible to recognise circumstances and prepare forward plans differently. In the digital era, leaders, strategists, marketers, and product managers need to recognise that profit pools are increasingly transient, and if you are skilful or lucky enough to have one in your portfolio, it is critical to anticipate that someone is probably working on how to disrupt it, and to gather and act quickly on intelligence on realistic threats. There are also steps that can be taken to improve defensive positions against disruption, and we look at some of these in this report. It isn’t always possible because sometimes the start point is not ideal – but then again, part of the art is to avoid that position.


  • Executive Summary: five principles
  • Introduction
  • Digital value is often transient
  • KPN: a brief case study in disruption
  • How did that happen then?
  • Denial is not a good defence
  • Timing a disruptive move is critical
  • Disruption visibly destroys value
  • So when should strategists choose disruption?
  • Free is not enough, nor is it the real issue
  • How market winners meet needs better
  • How to compete with ‘free’?
  • Build the platform, feed the flywheel
  • Nurture the ecosystem
  • …don’t price it to death


  • Figure 1 – A business model is the commercial architecture of a business: how it makes money
  • Figure 2 – KPN’s SMS stats per user started to change at the end of 2010
  • Figure 3 – WhatsApp took off in certain segments at the end of 2010
  • Figure 4 – KPN’s SMS volumes have continued to decline since 2010
  • Figure 5 – Free’s disruptive play is destroying value in the French Market, Q1 2012-Q3 2014
  • Figure 6 – Verizon is winning in the US – but most players are still growing too, Q1 2011-Q1 2014
  • Figure 7 – How ‘OTT’ apps meet certain needs better than core telco services
  • Figure 8 – US and Spain: different approaches to disruptive defence
  • Figure 9 – The Amazon platform ‘flywheel’ of success

Strategy 2.0: The Six Key Telco 2.0 Opportunities

A summary of the six Telco 2.0 opportunities to transform telco’s business models for success in an IP-based, post PSTN world: Core Services, Vertical Solutions, Infrastructure Services, Embedded Communications, 3rd Party Enablers, and Own Brand OTT Services. It includes an extract from the Roadmap to New Telco 2.0 Business Models, updates on latest developments, and feedback from over 500 senior TMT industry execs. (July 2011, Executive Briefing Service, Transformation Stream). Telco 2.0 Six Key Opportunity Types Chart July 2011
  Read in Full (Members only)    Buy This Report    To Subscribe

Below is an extract from this 50 page Telco 2.0 Report that can be downloaded in full in PDF format by members of the Telco 2.0 Executive Briefing service and the Telco 2.0 Transformation Stream here. Non-members can buy a Single User license for this report online here for £795 (+VAT) or subscribe here. For multiple user licenses, package deals to buy this report and the Roadmap report together, or to find out about interactive strategy workshops on this topic, please email contact@telco2.net or call +44 (0) 207 247 5003.

To share this article easily, please click:

//

Background – The Roadmap to New Telco 2.0 Business Models

The Telco 2.0 Strategy Report ’The Roadmap to New Telco 2.0 Business Models’ published in April 2011 examines ways in which operators can extend and solidify their roles in the future ecosystem, making themselves a cornerstone of a new structure. This Executive Briefing contains extracts from the full Strategy Report, and updates and validates it with feedback from recent Telco 2.0 and New Digital Economics Executive Brainstorms in EMEA and the Americas.

Updating the Telecoms Business Model

For the past four years, STL Partners has been using an iconic diagram (see Figure 1, below) to illustrate our views about the role of ‘two-sided’ business models in the telecoms industry. It highlights the critical role of a telecom operator in enabling interactions between its traditional end-user (“downstream”) customers and a variety of new “upstream” parties, such as application developers and media companies. In 2007, we also introduced the concept of “distribution” of Telcos’ core services through these upstream channels, with the addition of a range of value-added B2B services based around the inherent capabilities of the network and service platform.

This concept of two-sided business models originally introduced in the Telco 2.0 Strategy Report The $125Bn ‘Two-Sided’ Telecoms Market Opportunity has to a degree become synonymous with Telco 2.0, and has been widely embraced by the industry. We have now decided it is time to update our definition of “Telco 2.0” to reflect both business model evolution and fundamental changes in the telecoms industry structure itself. While these trends are indeed driving adoption of multi-sided business models, we have also observed that that are redefining the landscape for ‘traditional’ one-sided telecom model as well.

Figure 1: The high-level Telco 2.0 Business Model diagram

Telco 2.0 Roadmap Two-Sided Business Model Schematic Chart

Source: STL Partners / Telco 2.0

Pressure on All Sides

In particular, it is critical to understand the increasing pressure on Telcos’ traditional markets and value propositions, on all sides – not just by Internet/media companies (so-called “over-the-top” players), but also by third-party infrastructure operators and wholesalers, network and device vendors, governments, and even end-users themselves. In addition, there have been delays and organisational complexities in exploiting the true potential of some “upstream” opportunities.

Newcomers such as Apple have developed their own communications/content ecosystems, regulators have pushed for structural separation, Governments have funded wholesale networks and application developers have cherry-picked lucrative domains such as social networking. Network equipment vendors are helping operators convert capex to opex – but in the process are themselves capturing more industry value through outsourcing. End-users have developed work-arounds to reduce their expenditure on telco services (e.g. “missed calls”).

Figure 2 – Telcos squeezed from all sides

Telco 2.0 Roadmap Report Telecoms Industry Squeeze Competitve Forces Chart

Source: Telco 2.0, The Roadmap to New Telco 2.0 Business Models

Taken together, the impact of these trends has led Telco 2.0 to expand its framework to embrace and refine its target market domains for telcos, especially in terms of innovation around advanced new “retail” services. We feel that it is becoming even more difficult for operators to navigate through this minefield – and if they are to succeed, they will need to develop and sell more appropriate, integrated and well-designed offerings. While defensive moves have their place, there is also an urgent need to innovate – but with well-focused efforts and resources.

Originally, we spoke of three business model elements for telcos: Improved retail telecoms services; ‘Distribution’ of core telecom products and services through alternate upstream channels; and delivery to upstream customers of value-added enablers. (In the past, we did not explicitly address wholesale telco-telco services, as they were essentially “internal machinery” of the day-to-day retail business).

Figure 3 – The three opportunity areas in the original Telco 2.0 business model

Telco 2.0 3 Original Business Model Opportunities Chart

Source: Telco 2.0, The $125Bn ‘Two-Sided’ Telecoms Market Opportunity

Introducing the New Telco 2.0 Framework

A long-term, strategic framework for is needed for telcos, both in fixed and mobile sectors. While the industry has strong cash flows, it needs to redefine its own space, exploit its strengths, and seek out areas of revenue growth and strong differentiation. Telcos also need to look for sources of their own profit in areas such as managed services, rather than just exploiting the cost savings offered by vendors and outsourcers.

Figure 4 – The New Telco 2.0 Industry Framework

Telco 2.0 Roadmap Report Telecoms Industry New Industry Framework Chart

Source: Telco 2.0, The Roadmap to New Telco 2.0 Business Models

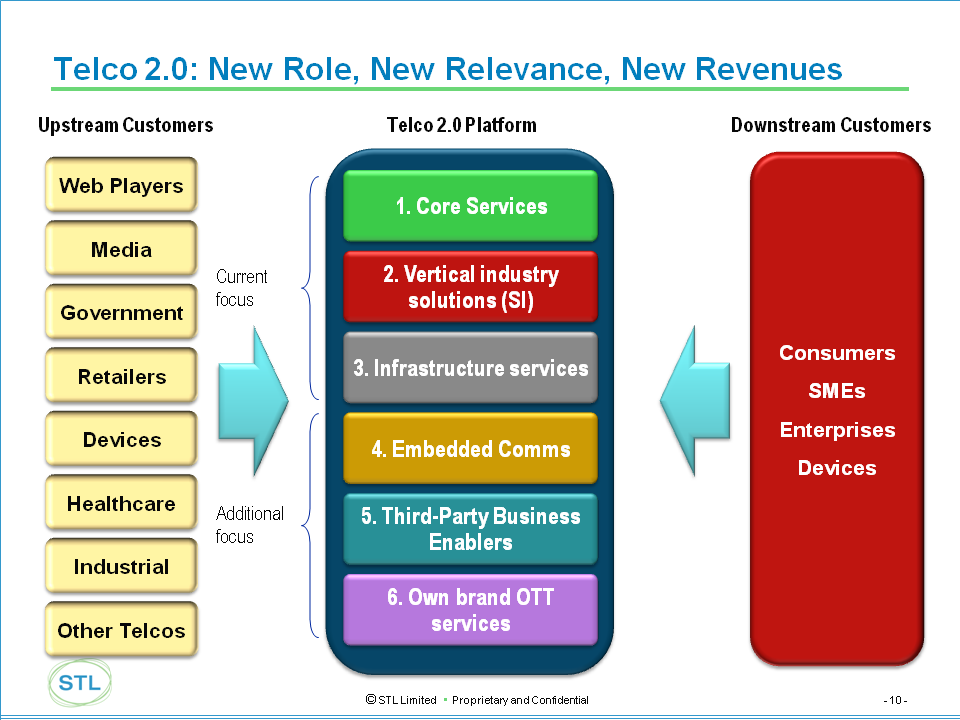
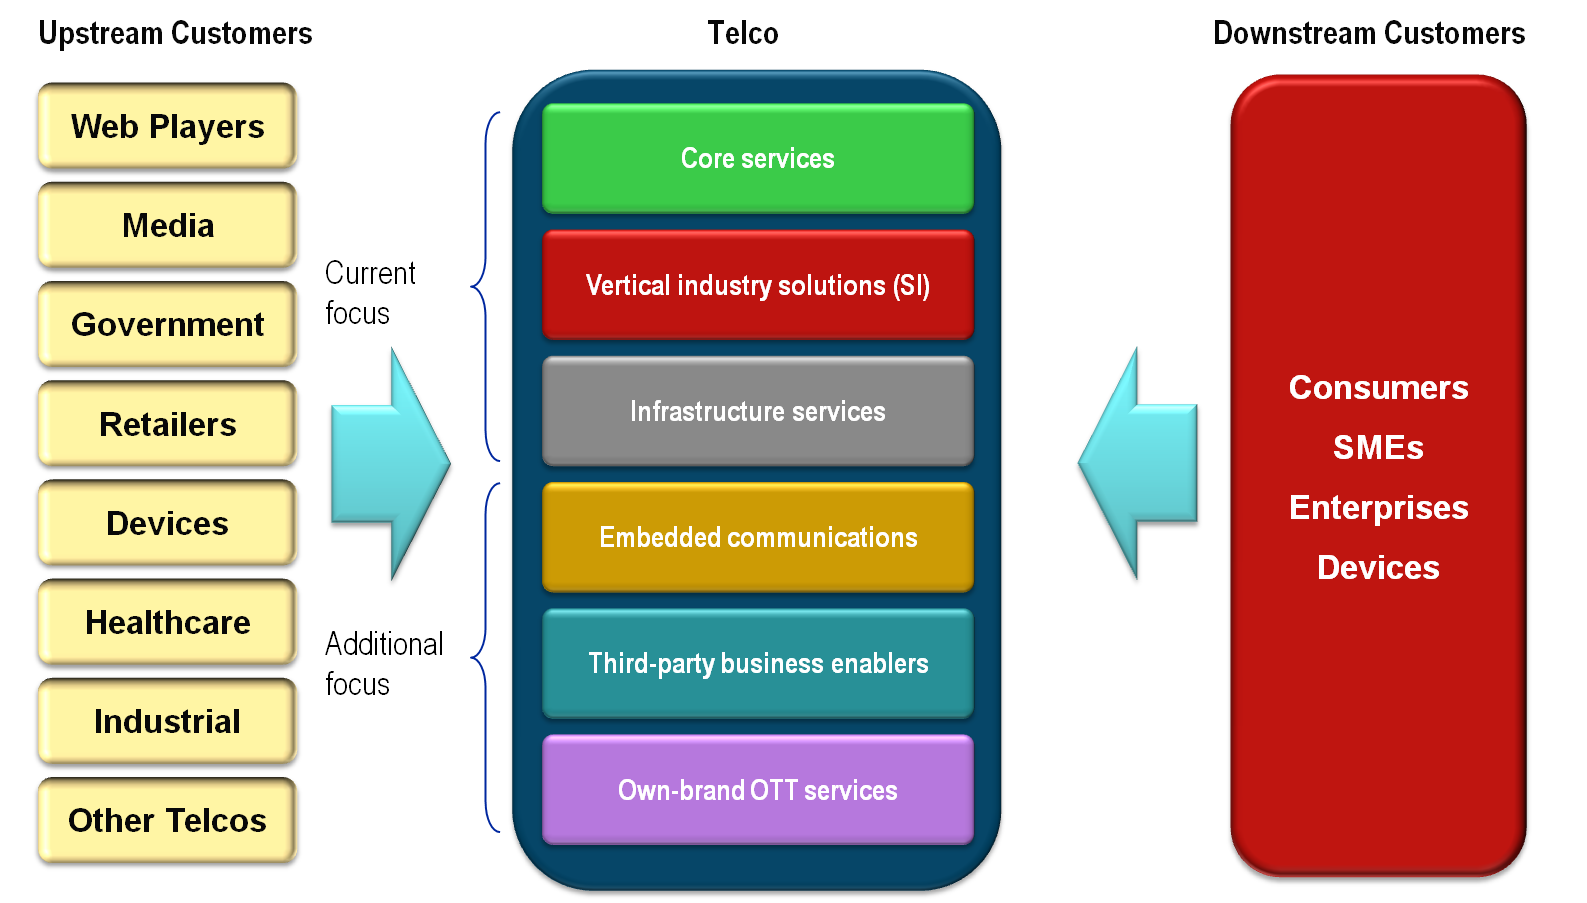
Our new framework is an evolution of the old, incorporating the two-sided model, and defining six opportunity types, comprising three existing types previously defined by Telco 2.0:

  • Core services (previously ‘Enhanced retail’), which encompasses structural and strategic improvements to existing wholesale and retail services;
  • Embedded Communications (previously ‘Distribution platform’);
  • Third-party business enablers (previously ‘B2B VAS platform’);

and extending it in three main directions:

  • A separated and richer tier of Infrastructure services;
  • Explicitly identifying the integration of telecoms, IT and networking being undertaken by operators in the corporate space – Vertical industry solutions (SI)
  • Own-brand OTT services.

The Six Telco 2.0 Opportunity Types

We have grouped the opportunities into six types shown in the following diagram and discussed further in the rest of this report.

Figure 5 – the Six Telco 2.0 Opportunity Types

Telco 2.0 Roadmap Report Telecoms Industry Six Opportunities Chart

Source: Telco 2.0, The Roadmap to New Telco 2.0 Business Models

1. Core services (previously Retail Services), which encompasses transformational structural and strategic improvements to existing mainstream “Telco 1.0” offerings such as subscriptions, telephony and broadband access. These will remain at the core of telco revenues irrespective of other shifts, enhanced by the smart and targeted delivery of improved offers, manifesting in benefits via revenue addition, up-sell, and customer satisfaction. Our research identifies a portfolio of approaches here, such as:

  • Incremental improvements to basic products’ quality or speed;
  • Exploitation of new device categories driving service adoption and usage;
  • Supply of added-value content and services;
  • Better segmentation and customisation;
  • More targeted, personalised and granular pricing;
  • Better channels to market;
  • Efforts to gain improved (and genuine) loyalty and value perception;
  • Innovative ways to drive incremental usage and spending, for example through incentives and promotions.

In parallel with the revenue drivers, operators are also focusing on cost savings, throughout network operations and other areas such as retail channel costs and commissions, device subsidies and so forth.

2. Vertical industry solutions have been developed by fixed operators over the last decade and now starting to be demanded by customers for mobile solutions too. They comprise telephony services (voice and data) being integrated with IT with the operator acting in a systems integrator role to provide a complete solution. These solutions are tailored and packaged for specific vertical industries – transport, logistics, banking, government, manufacturing, utilities, etc. Companies such as BT (with BT Global Services), Orange (with Business Services) and Deutsche Telekom (with T-Systems) are examples of companies that have moved aggressively into this area.

3. A separated and richer tier of Infrastructure services, which includes telecom capacity “bulk” wholesale, as well as more granular “distribution” two-sided business models and aspects of hosting/cloud services. Some of these offerings have been around for a long time – bitstream ADSL, unbundled local loop sales and so forth. Others (data MVNOs, wholesale wireless networks) are relatively new. At the same time, operators are cutting new deals with each other for network sharing, backhaul provision, national roaming and so forth. We are splitting the new services out in this category, as a reflection of their impact on the cost side of operators’ business models, and new regulatory regimes (such as open access) that are redefining industry structure in many markets.

4. Embedded communications (previously Distribution Platform) – essentially the delivery to consumers of basic telecom services, primarily voice telephony, SMS and broadband data access, through new routes such as application-embedded functions or devices which “come with data” pre-provisioned.

5. Third-party Enablers (previously B2B VAS Platform) – the provision of extra capabilities derived from the operator’s ’platform’ rather than just network transport. This includes functions such as billing-on-behalf, location, authentication and call-control, provided as basic building blocks to developers and businesses, or abstracted to more complex and full-featured enablers (for example, a location-enabled appointment reminder service). Another class of third-party enablers originates in the huge customer databases that Telcos maintain – in theory, it should be possible to monetise these through advertising or provision of aggregated data to 3rd parties – subject to privacy constraints.

6. Own-brand OTT services. Many operators are starting to exploit the scale of the wider Internet or smartphone universe, by offering content, communications and connectivity services outside the perimeter of their own access subscriber base. With a target market of 1-2bn people, it is (in theory) much easier to lower per-unit production costs for new offerings and gain “viral” adoption. It avoids the politics and bureaucracy of partnerships and industry-wide consortia – and potentially has the ‘pot-of-gold’ of creating huge value from minimal capital investment. On the downside, the execution risks are significant – as is the potential for self-cannibalisation of existing services.

Figure 6 – The Six Opportunity Areas – Strategy, Typical Services and Examples

Telco 2.0 Roadmap Six Opportunities Examples Table

Source: Telco 2.0, The Six Opportunity Types Executive Briefing

To read the report in full, including the following contents…

  • Introduction & Background
  • The Roadmap to New Telco 2.0 Business Models
  • Updating the Telecoms Business Model
  • Executive Summary
  • Introducing the New Telco 2.0 Framework
  • Summary: The Six Telco 2.0 Opportunity Types
  • New Developments and Feedback from Telco 2.0 and New Digital Economics Brainstorms
  • Relative Attractiveness of Opportunity Areas
  • Different Opportunities need Different Business Models
  • The Unwelcome Need to Increase Investment in Innovation
  • New Metrics to Unlock New Investment
  • A Common Theme: Time is Short
  • Next Steps – M-Commerce 2.0: how Personal Data will Revolutionise Customer Engagement
  • The Six Opportunity Types Described
  • Opportunity Type 1: Core services
  • Opportunity Type 2: Vertical industry solutions (SI)
  • Opportunity Type 3: Infrastructure services
  • Opportunity Type 4: Embedded communications
  • Opportunity Type 5: Third-party business enablers
  • Opportunity Type 6: Own-brand “OTT”
  • Index

…with the following figures, charts and tables…

  • Figure 1 – The high-level Telco 2.0 Business Model diagram
  • Figure 2 – Telcos squeezed from all sides
  • Figure 3 – The three opportunity areas in the original Telco 2.0 business model
  • Figure 4 – The New Telco 2.0 Industry Framework
  • Figure 5 – the Six Telco 2.0 Opportunity Types
  • Figure 6 – The Six Opportunity Areas – Strategy, Typical Services and Examples
  • Figure 7 – Americas 2011: What will be the impact of Telco 2.0 Growth Opportunities?
  • Figure 8 – EMEA Nov 2010: B2B Enabling Services and Distribution Platform Need Investment
  • Figure 9 – Each Opportunity Area will have Different Revenue Splits
  • Figure 10 – Operators must invest more in services
  • Figure 11 – Different Business Models Need Different Metrics
  • Figure 12 – Impact of New Business Models on CROIC
  • Figure 13 – Other than “being a pipe”, Telcos have the most time and Opportunity to address Identity & Authentication Control Points
  • Figure 14 – Customer Data and Mobile Money are CSP’s most under exploited Assets?
  • Figure 15 – 100% campaign gain from personalisation
  • Figure 16 – Closed-loop of customer relationships & loyalty
  • Figure 17 – Ericsson’s Mobile Broadband ‘Fuel Gauge’
  • Figure 18 – BT Global Services vertical industry approach
  • Figure 19 – Many regulators see wholesale as key to NGA success
  • Figure 20 – Three Different Types of Embedded Communications
  • Figure 21 – Broadband access market forecast 2005-2015
  • Figure 22 – ‘Comes with Connectivity’
  • Figure 23 – Distribution and Enablers Vs Ontology of Telco wholesale and VAS offerings
  • Figure 24 – What is the best revenue model for Telco API programmes?
  • Figure 25 – Skype is a good fit for many Microsoft products
  • Figure 26 – Telco strategy options for co-opetition with Skype
  • Figure 27 – The Seven ‘VAS Platform’ Applications / 3rd Party Business Enabler Areas
  • Figure 28 – 5 Strategic Options for Developing OTT Services

……Members of the Telco 2.0 Executive Briefing Subscription Service and the Telco 2.0 Transformation Stream can download the full 50 page report in PDF format here. Non-Members, please see here for how to subscribe, here to buy a single user license for £795 (+VAT), or for multi-user licenses and any other enquiries please email contact@telco2.net or call +44 (0) 207 247 5003.

Organisations and products referenced: 3UK, Alcatel-Lucent, Amazon, Amazon Kindle, Android, Apple, AT&T, BlackBerry, BT, BT Global Services, Carphone Warehouse, Cisco, Clearwire, Deutsche Telekom, Equant, Facebook, FCC, Gamesload, Google, Harbinger/SkyTerra network, iPad, iPhone, Jajah, KDDI, LightSquared, LinkedIn, Microsoft, Musicload, O2, Ofcom, Openzone, Optism, Orange, ProgrammableWeb, Qualcomm, Revoo, Scout24 family, Skype, smartphones, SMS, Softwareload, Telefonica, T-Mobile, UQ, Verizon, Videoparty, Vodafone, W3C, Xiam, YouTube.

Technologies and industry terms referenced: 3G, 4G, ADSL, API, appstore, authentication, B2B VAS platform, backhaul, billing-on-behalf, bitstream ADSL, broadband data access, Bulk wholesale, cable, cloud, Comes with data, Core services, CRM, data centres, Embedded Communications, femtocells, fibre, freemium, GSM, healthcare, Identity, Infrastructure services, location, LTE, M2M, managed services, messaging, MiFi, MVNO, MVNOs, Net Neutrality, NGA, NGN, own-brand OTT, Own-brand OTT, pipe, platforms, QoS, R&D, Retail, Sender pays, SIM, slice and dice, smart grids, Third-party business enablers, two-sided, unbundled local loop, Vertical industry solutions, voice telephony, VoIP, wholesale wireless networks, WiFi, WiMAX.

M2M 2.0: Market, Business Models, and Telcos’ Role(s)

Summary: Our latest report on M2M 2.0 covers: M2M market growth, structure and dynamics; business models; the best role(s) for telcos; and leading thinking from Deutsche Telekom, Vodafone, Telenor, KPN and Swisscom. It describes how ‘Service Enablers’ are key to the telco opportunity in M2M in addition to connectivity. (July 2011, Executive Briefing Service) M2M Pie Chart Service Enablers July 2011
  Read in Full (Members only)    Buy This Report    To Subscribe

Below is an extract from this 39 page Telco 2.0 Report that can be downloaded in full in PDF format by members of the Telco 2.0 Executive Briefing service here. Non-members can buy a Single User license for this report online here for £595 (+VAT) or subscribe here. For multiple user licenses or other enquiries please email contact@telco2.net or call +44 (0) 207 247 5003.

To share this article, please click:

//

Background

Our previous M2M 2.0 research includes: M2M 2.0: New Approaches Needed; Aligning M2M with Telco 2.0 Strategies; and M2M / Embedded Market Overview, Healthcare Focus, and Strategic Options. M2M is also a theme of the upccoming New Digital Economics Exeutive Brainstorms in H2 2011, and there is a thought-provoking video (registration required) by Ericsson on the ‘Social web of things‘ on our Best Practice Live! site.

It’s a Long Way to the Top

The grand vision of 50 Billion connected devices looks a long way distant when contemplating the ‘cottage industry’ that is M2M today.

While there are lots of possibilities for connecting devices usefully, there are numerous challenges to doing it well and growing the market to its full potential:

  • There are many different networks may be used for M2M – cellular, WiFi, WiMax, fixed, Bluetooth and other radio networks;
  • The needs of existing and potential M2M customers are very diverse;
  • There are many different types of potential M2M connectivity and services providers, from vertical specialists, through fixed and mobile telcos, other network owners, and device makers;
  • There are many diverse M2M devices, some with have 30 year life-spans, others lives measured in months;
  • And massive growth in intelligent devices that can increasingly choose different networks for different applications.

There are also industry barriers to the take-up of current offerings, such as

  • The lack of common, global, flexible solutions;
  • Performance and cost issues;
  • A low base of user and potential awareness and understanding.

Figure 3 (Extract) – The Key Challenge for M2M Growth is to Create a Broad, Open Market

M2M 2.0 rating of the industry barriers to M2M adoption

Source: Delegate Vote, 11th Telco 2.0 EMEA Brainstorm

More Money is in Service Enablers

It is our view (and that of the attendees at our last M2M brainstorm) that the pure connectivity revenues (to be paid for delivering the data from machine to machine) will become highly commoditised and low margin.

The “growth opportunity” will be in Software Enabling Services (SES), responsible for such activities as device provisioning, update/rollback of device software and firmware, data-warehousing, and some forms of data reduction pushed down into the network. These could be delivered traditionally or as Software-as-a-Service (SaaS).

How much Money, and for Whom?

The complex driving and structural factors lead to a high degree of uncertainty in the Industry’s view of the market opportunity. For example, on average, delegates thought that by 2015, service enabler revenues would comprise a value of 78% of connectivity revenues – although this average was formed by a large group that thought it would be in the range 20-40% and a small minority that thought it would be much higher (>200%)

What role(s) should Telcos play?

Operators can add value by making it easier to use their connectivity and providing more “M2M-friendly” interfaces – often described as managed connectivity. Beyond this, they can look to create and participate in the service enablers market for developers/application providers to easily identify, authenticate, provision, and maintain their device fleet; to update and rollback software on the devices and enable them to deploy processing logic into the “Internet of things” in order to render the system more robust, distributed, and autonomous.

Some operators already have the skills and resources to offer the application development, implementation and service hosting on top of this. Summarised in the report are examples of leading thinking and practice including Vodafone’s Global M2M Platform, Telenor Objects, Deutsche Telekom’s ‘Intelligent Network’, KPN’s and Swisscom’s platforms, plus we have previously reported on Verizon’s Open Development Initiative (ODI) in the US.

Figure 7 (Extract) – Why The Classical Approach to M2M May Fail

M2M 2.0 Why the classical approach may fail July 2011

Source: Telenor Presentation

The industry as a whole has made rapid progress but could do much more to stimulate the embedded mobility market and drive growth through standards, interoperability and portability. The industry’s historical reluctance to do more to open itself up has left it vulnerable to being marginalized. The GSMA’s recent acceptance of over-the-air (OTA) SIM update, opens up the promise of more practical ways for an M2M customer to switch operator. It now rests on the industry (or failing that, the regulatory authorities) to deliver this promise.

Telco 2.0 Take-Out & Next Steps

M2M is growing up as an industry, and becoming more coherent and adopting increasingly similar concepts and vocabulary. However, as the wide variation in voting testifies, there is still considerable divergence in understanding and vision.

The M2M Opportunity is potentially significant but does not necessarily belonging to cellular networks, particularly if the industry does not work out how to create more common models that allow customers to use M2M in the way they actually need to use it – flexibly, seamlessly and cheaply.

While there is much energy in the debate on Machine-to-Machine in the operator community, there is widespread recognition that it is still something of a ‘cottage industry’ for operators at present, and a welcome sense of realism in that operators seem to understand that they don’t have all the answers. The core strategic challenge is to find a model that will scale beyond bespoke vertical industry applications.

While there is not yet a straightforward consensus on the relative value of service enablers compared to connectivity, our view remains that telcos need to develop the service enabler model as the connectivity market will be highly commoditised. We will continue to work to support this community, develop the service enabler model, and promote collective industry progress on M2M.

To read the full 39 page report, including analysis of the presentations, voting and delegate analysis from the M2M 2.0 Executive Brainstorms in April 2011, and London in November 2010, and the following charts…

  • Figure 1- T-Mobile’s Forecast of European M2M Markets
  • Figure 2 – Vodafone’s Global M2M Platform
  • Figure 3 – The Key Challenge for M2M Growth is to Create a Broad, Open Market
  • Figure 4 – What is the best service enabler opportunity for telcos?
  • Figure 5 – Will connectivity and generic horizontal service enabler platforms emerge and define the market?
  • Figure 6 – What are the priorities for the industry in developing M2M opportunities?
  • Figure 7 – Why ‘classical’ approaches to M2M may fail
  • Figure 8 – Horizontally layered approach needed
  • Figure 9 – KPN Development Platform
  • Figure 10 – Forecast share of service enabler revenue by type of player
  • Figure 11 – 2015 Global Service Enabler vs. Connectivity Revenues
  • Figure 12 – Issues for the ‘Internet of Things’
  • Figure 13 – Operator opportunities in the ‘Internet of Things’
  • Figure 14 – How would you characterise Ericsson’s vision of the Social Web of Things?
  • Figure 15 – What percentage of connections will be made by cellular mobile networks in 2020?

……Members of the Telco 2.0 Executive Briefing Subscription Service can download the full 39 page report in PDF format here. Non-Members, please see here for how to subscribe, here to buy a single user license for £595, or for multi-user licenses and any other enquiries please email contact@telco2.net or call +44 (0) 207 247 5003.

Organisations, products and industry terms referenced: API, ARPU, Beecham Research, Bluetooth, Bosch, BT / Arqiva, Cincius, connected car, Deutsche Telekom, Embedded Mobile, energy, Enfora, Ericsson, Facebook, GSM, GSMA, healthcare, HLR, HTTP, IMSI, Indesit, intelligent networks, Internet of things, iPhones, Kindle, KPN, Logica, M2M, messaging, m-health, MNC, MVNE, MVNO, Novatel, Objects, Open Development Initiative, Orange, OTA, OTT, platforms, roaming, SaaS, Service Enabler, SIM, smart grid, SMS, Social Web of Things, Software-as-a-Service, spectrum policy, standardization, strategy, Swisscom, Telenor, Telenor Objects, T-Mobile, transport, USIM, Verizon, Vertical, Vertical M2M, Vodafone, WiMAX, Zigbee.


RIM: R.I.P. or ‘Reports of my death are greatly exaggerated’?

Summary: RIM’s shares have plummeted in value over the last four months, prompting an eruption of finger-pointing in the media and speculation of its demise or acquisition. In this analysis we examine whether the doom-mongers are right and what RIM’s recovery strategy might be. (July 2011, Executive Briefing Service) Apple iCloud logo in analysis of impact of iCloud/iOS on digital ecosystem
  Read in Full (Members only)    Buy This Report    To Subscribe

Below is an extract from this 12 page Telco 2.0 Report that can be downloaded in full in PDF format by members of the Telco 2.0 Executive Briefing service here. Non-members can buy a Single User license for this report online here for £295 (+VAT) or subscribe here. For multiple user licenses or other enquiries please email contact@telco2.net or call +44 (0) 207 247 5003.

To share this article, please click:

//

Background – RIM’s share price disaster

RIM’s shares have plummeted in value over the last four months, prompting an eruption of finger-pointing in the media and speculation of its demise or acquisition. In this analysis we examine whether the doom-mongers are right and what RIM’s recovery strategy might be.

‘Reports of my death are greatly exaggerated’ – US writer Mark Twain, 1907, when he failed to return to New York City as scheduled and The New York Times speculated that he might have been “lost at sea.”

Figure 1 – RIM has obviously underperformed Apple, but incredibly it has also underperformed Nokia.

RIM, Apple, Nokia Share Prices July 2011 Telco 2.0

With its iconic Blackberry devices, RIM led the way in the mobile messaging era – first in corporate and then in consumer markets. But the transition to the mobile web has seen it surpassed by Apple and Google in consumer developed markets. In this respect RIM faces the same challenge as Nokia. And yet, despite facing the same challenge, RIM and Nokia have taken completely different strategic options for their future. When Nokia announced its partnership with Microsoft it pointedly talked about the creation of the third platform for the mobile web alongside Apple and Google – Nokia effectively discounted RIM from the game.

Previous Telco 2.0 analysis on RIM includes: RIM: how does the BlackBerry fit with Telco 2.0 strategies?; Mobile Software Platforms: Rapid Consolidation Forecast; and Nokia’s Strange Services Strategy – Lessons from Apple iPhone and RIM.

Current Position – on the surface, OK, but…

At first glance, RIM looks in a healthy position and its recent results show that both handset shipments (13.2m vs 11.2m) and revenues (US$4.9bn vs US$4.2bn) were up on the previous year. RIM is making reasonable profits (US$695m) and has a healthy cash position (US$2.9bn). But under the hood, life is not looking as rosy.

Profits: Under Pressure

RIM’s accounts show that its absolute profits are declining as growth in R&D and S&M costs are exceeding the slowing growth in revenues.

Figure 2 – RIM’s Profits are down against growth in R&D and S&M costs

RIM Profits, R&D Costs, Sales and Marketing Costs, July 2011 Telco 2.0

Of course, rising R&D and S&M costs may ultimately result in new revenues, although at present the effects of this spending are not yet evident in overall performance.

Revenues: Squeezed out of Key Markets

RIM’s revenues are dropping in key markets, particularly the USA, and its growth in revenues is coming from emerging markets.

Figure 3 – RIM’s Changing Market Revenues

Table of RIM Worldwide Sources of Revenue and changes, July 2011, Telco 2.0

Market Share: Declining

RIM’s share of the overall smartphone market is declining.

Figure 4 – RIM’s Declining Worldwide Market Share

Table of RIM, Apple, Nokia, Android Smartphone Market Share May 2011, Telco 2.0 (Gartner)

Core Product Advantages: Eroded

Core product advantages (e.g. Blackberry Messenger) are being eroded and surpassed as the competition (e.g. Apple iMessage) improves.

New Products: Late

New devices such as the updated Bold 9900 have missed planned release dates.

To read the rest of this report, including…

  • Outlook – a time of transition?
  • QNX & TAT – RIM’s saviours?
  • Playbook – A disappointing start
  • Coming: the Android / Emerging Market Crunch
  • Corporate Strength
  • Telco 2.0 Conclusions & Recommendations – Is there a recovery strategy?


Members of the Telco 2.0 Executive Briefing Subscription Service can download the full 14 page report in PDF format here. Non-Members, please see here for how to subscribe, here to buy a single user license for £295, or for multi-user licenses and any other enquiries please email contact@telco2.net or call +44 (0) 207 247 5003.

Companies, technologies and products referenced: 7digital, Adobe Flash, Amazon, Android, Apple, Blackberry, BlackberryOS 8, Bold 9900, Carphone Warehouse, Google, Huawei, iMessage, iPad, iPhone, Microsoft, Nokia, Phones4U, Playbook, QNX Software Systems, RIM, The Astonishing Tribe (TAT).


Strategy 2.0: What Skype + Microsoft means for telcos

Summary: in theory, Microsoft and Skype have the resources, the brands, the customer base and the know-how to shape the future of telecoms and become a strategic counterweight to Apple and Google. Can they do it – and what should telcos’ strategy be? (June 2011, Executive Briefing Service, Dealing with Disruption Stream).

Microsoft Skype Logo Image Medium


This page contains an excerpt from the report, plus detailed contents, figures and tables, and a summary of the companies, products, technologies and issues covered.


Read in Full (Members only)    Buy This Report    To Subscribe

(The 35 page PDF format report is available in full to Members of the Telco 2.0 Executive Briefing Service and the Telco 2.0 Dealing with Disruption Stream here. Non-members can buy a Single User license for this report online here for £995 (+VAT) or subscribe here. For multiple user licenses or other enquiries please email contact@telco2.net or call +44 (0) 207 247 5003.)

To share this article easily, please click:

//

Introduction: Skype, the Original ‘Voice 2.0’

Everyone knows Skype as the original Voice 2.0 company – providing free phone calls, free video, status updates, all delivered using an innovative peer-to-peer architecture, and with the unique selling point of VoIP that just worked. This report describes its business model, technology strategy, its acquisition by Microsoft, and the consequences for the telecoms industry.

A little history

Founded in 2003 by Janus Friis and Niklas Zennström, Skype was acquired by eBay in 2005 for $2.6bn. eBay ownership was a period of stagnation – although eBay also owns PayPal, it only made half-hearted efforts to integrate the two. In November 2009, eBay sold 65% of Skype to an investor group led by Silver Lake for approximately $1.9bn in cash, valuing Skype at $2.75bn.

With Skype preparing for an IPO, Microsoft announced in May 2011 that it had agreed to buy the company for $8.5bn, giving the investor group a massive return and ensuring future potentially-disruptive start-ups will also attract plenty of funding. Many commentators have suggested that Microsoft is paying too much for the VOIP company, although the price-earnings ratio is actually no higher than that of Cisco’s acquisition of WebEx. So, what exactly is Microsoft getting for its billions? Let’s take a closer look.

A Dive into Skype’s Accounts

Microsoft has acquired what is essentially a global telephony company with 663 million registered users and very significant gross profitability. Skype contributed more net new minutes of international voice than the rest of the industry put together in 2010, according to Telegeography. Skype has never struggled to achieve growth, but its profitability has often been criticised, as has its ability to generate growth in ARPU. The following chart (figure 1) summarises Skype’s operational key performance indicators (KPIs) since 2006.

Figure 1: Skype’s KPIs: users, usage, and ARPU

Telco 2.0 Skype KPIs Users and ARPU June 2011 Graph Chart v1

Source: Skype’s S-1, May 2011

Questions have been raised about Skype’s performance in converting registered or even active users into paying users. This is critical, as ARPU is relatively flat. However, a monthly ARPU for paying users of $8 would be considered very reasonable for an emerging-market GSM operator and such an operator would tie up far more capital than Skype does. As all Skype users contribute to the system’s peer-to-peer (P2P) infrastructure, the marginal cost of serving non-paying users is essentially nothing.

Another way of looking at the KPIs is to consider their growth rates, as we have done in the following chart (figure 2). Although the growth of paying users is nowhere near as fast as that of free minutes of use, 40% growth per annum in revenue-generating subscribers is still very impressive.

Figure 2: Growth rates of Skype KPIs.

Telco 2.0 Skype KPIs Growth June 2011 Graph Chart

Source: Skype’s S-1, May 2011

In fact, there is very little wrong with Skype at the operating level. The following chart (figure 3) shows that, if we consider the primary challenge for Skype to be converting free users into paying users, it is actually doing rather well. Revenue and EBITDA are advancing and margins are holding up well.

Figure 3: Revenue and EBITDA growth is strong

Telco 2.0 Skype KPIs 5 Years Revenue and EBITDA June 2011 Graph Chart

Source: Skype S-1, May 2011

With 509 million active users available for conversion, ARPU may not be that relevant – just converting users of the free service into paying users has so far provided strong growth in gross profits and could do for the foreseeable future.

Figure 4: Conversion of free users at steady ARPU drives gross profit.

Telco 2.0 Skype Gross Profits June 2011 Graph Chart

Source: Skype S-1, May 2011

Skype doesn’t make money on free calls (not even from advertising or customer analytics/insights, yet), and has to pay interconnection fees and operate some infrastructure in order to provide SkypeOut (calls to conventional telephone numbers, rather than other Skype clients), and SkypeIn (calls from the PSTN to Skype users).

Skype sceptics have argued that eventually termination charges will catch up with the company and destroy its profitability. It is true that most of Skype’s revenues are generated (over 80%) by SkypeOut call charges and that Skype’s cost of net revenue is dominated (over 60%) by the cost of terminating these calls. However, termination as a percentage of Skype’s cost of net revenue is falling and Skype’s gross margin is rising, as its enormous volume growth enables it to extract better bulk pricing from interconnect operators (see Figure 5).

To see Figure 5, the conclusion of our analysis of Skype’s finances, and…

  • Is Skype Accumulating “Technical Debt”?
  • Future Plans: The Core Business, The Enterprise & Facebook
  • Telcos and Skype
  • Enter Microsoft
  • Windows Phone 7: Relevant again?
  • Microsoft’s other mobile allies: Nokia, RIM
  • How Microsoft will deploy Skype
  • Developers, developers, developers
  • Key Risks and Questions: execution, regulatory, partners, advertisers & payments
  • Answers: How Telcos should deal with Skype…and Microsoft

…plus these additional figures & fables…

  • Figure 5: How Skype’s spending is changing
  • Figure 6: Why Skype is making a loss
  • Figure 7: Commoditisation is for everybody!
  • Figure 8: 3UK benefits from its deal with Skype
  • Figure 9: Skype’s Deals with Carriers
  • Figure 10: Skype is a good fit for many Microsoft products
  • Figure 11: A unifying Skype API is critical for integration into the Microsoft empire
  • Figure 12: Telco strategy options matrix


Members of the Telco 2.0 Executive Briefing Subscription Service and the Telco 2.0 Dealing with Disruption Stream can download the full 35 page report in PDF format here. Non-Members, please see here for how to subscribe, here to buy a single user license for for £995, or for multi-user licenses and any other enquiries please email contact@telco2.net or call +44 (0) 207 247 5003.

Organisations, products and people referenced in the report: 3UK, AdSense, Android, Apple, AT&T, Au, Avaya, Ben Horowitz, BlackBerry Messenger, Cisco, Dynamics CRM, EasyBits, eBay, Exchange Server, Facebook, Facetime, Google, Google Talk, Google Voice, GSMA, Happy Pipe, Hutchison, iOS, iPhone, Jajah, Janus Friis, KDDI Mobile, Kinect, KPN, Lync, Mango, Marchex, Microsoft, Microsoft-Nokia deal, MXit, MySpace, Niklas Zennström, Nokia, Ofcom, Office Live, Outlook, PayPal, PowerPoint, Qik, RIM, Silver Lake, Skype, SkypeConnect, SkypeIn, SkypeKit, SkypeOut, SkypePhone, Steve Ballmer, Telefonica, Teredo, Tony Jacobs, Tropo, Twitter, Verizon Wireless, Virgin, Visual Studio, WebEx, WhatsApp, Windows Mobile, Windows Phone 7, WP7, Xbox, X-Series.

Technologies referenced: GSM, HD voice, HTTP/S, IM, IMS MMTel, IP networks, IPv4, IPv6, LTE, Mobile, NAT, P2P, PSTN, RCS, SILK V3, SIP, SMS, SS7, super node, URI, video telephony, Voice 2.0, VoIP, XMPP.

Cloud 2.0: Telcos to grow Revenues 900% by 2014

Summary: Telcos should grow Cloud Services revenues nine-fold and triple their overall market share in the next three years according to delegates at the May 2011 EMEA Executive Brainstorm. But which are the best opportunities and strategies? (June 2011, Executive Briefing Service, Cloud & Enterprise ICT Stream)

NB Members can download a PDF of this Analyst Note in full here. Cloud Services will also feature at the Best Practice Live! Free global virtual event on 28-29 June 2011.

To share this article easily, please click:

//

Introduction

STL Partners’ New Digital Economics Executive Brainstorm & Developer Forum EMEA took place from 11-13 May in London. The event brought together 250 execs from across the telecoms, media and technology sectors to take part in 6 co-located interactive events: the Telco 2.0, Digital Entertainment 2.0, Mobile Apps 2.0, M2M 2.0 and Personal Data 2.0 Executive Brainstorms, and an evening AppCircus developer forum.

Building on output from the last Telco 2.0 events and new analysis from the Telco 2.0 Initiative – including the new strategy report ‘The Roadmap to New Telco 2.0 Business Models’ – the Telco 2.0 Executive Brainstorm explored latest thinking and practice in growing the value of telecoms in the evolving digital economy.

This document gives an overview of the output from the Cloud session of the Telco 2.0 stream.

Companies referenced: Aepona, Amazon Web Services, Apple, AT&T, Bain, BT, Centurylink, Cisco, Dropbox, Embarq, Equinix, Flexible 4 Business, Force.com, Google Apps, HP, IBM, Intuit, Microsoft, Neustar, Orange, Qwest, Salesforce.com, SAP, Savvis, Swisscom, Terremark, T-Systems, Verizon, Webex, WMWare.

Business Models and Technologies covered: cloud services, Enterprise Private Cloud (EPC), Virtual Private Cloud (VPC), Infrastucture as a service (IaaS), Platform as a Service (PaaS), Software as a Service (SaaS).

Cloud Market Overview: 25% CAGR to 2013

Today, Telcos have around a 5% share of nearly $20Bn p.a. cloud services revenue, with 25% compound annual growth rate (CAGR) forecast to 2013. Most market forecasts are that the total cloud services market will reach c.$45-50Bn revenue by 2013 / 2014, including the Bain forecast previewed at the Americas Telco 2.0 Brainstorm in April 2011.

At the EMEA brainstorm, delegates were presented with an overview of the component cloud markets and examples of different cloud services approaches, and were then asked for their views on what share telcos could take of cloud revenues in each. In total, delegates’ views amounted to telcos taking in the region of 18% by revenue of cloud services at the end of the next three years.

Applying these views to an extrapolated ‘mid-point’ forecast view of the Cloud Market in 2014, implies that Telcos will take just under $9Bn revenue from Cloud by 2014, thus increasing today’s c$1Bn share nine-fold. [NB More detailed methodology and sources are in the full paper available to members here.]

Figure 1 – Cloud Services Market Forecast & Players

Cloud 2.0 Forecast 2014 - Telco 2.0

Source: Telco 2.0 Presentation

Although already a multi-$Bn market already, there is still a reasonable degree of uncertainty and variance in Cloud forecasts as might be expected in a still maturing market, so this market could be a lot higher – or perhaps lower, especially if the consequences of the recent Amazon AWS breakdown significantly reduce CIO’s appetites for Cloud.

The potential for c.30% IT cost savings and speed to market benefits that can be achieved by telcos implementing Cloud internally previously shown by Cisco’s case study were highlighted but not explored in depth at this session.

Which cloud markets should telcos target?

Figure 2 – Cloud Services – Telco Positioning

Cloud 2.0 Market Positioning - Telco 2.0

Source: Cisco/Orange Presentation, 13th Telco 2.0 Executive Brainstorm, London, May 2011

An interesting feature of the debate was which areas telcos would be most successful in, and the timing of market entry strategies. Orange and Cisco argued that the area of ‘Virtual Private Cloud’, although neither the largest nor predicted to be the fastest growing area, should be the first market for some telcos to address, appealing to some telcos strong ‘trust’ credentials with CIOs and building on ‘managed services’ enterprise IT sales and delivery capabilities.

Orange described its value proposition ‘Flexible 4 Business’ in partnership with Cisco, VMWare virtualisation, and EMC2 storage, and although could not at this early stage give any performance metrics described strong demand and claimed satisfaction with progress to date.

Aepona described a Platform-as-a-Service (PaaS) concept that they are launching shortly with Neustar that aggregates telco APIs to enable the rapid creation and marketing of new enterprise services.

Figure 3 – Aepona / Neustar ‘Intelligent Cloud’ PaaS Concept

C;oud 2.0 - Intelligent Cloud PaaS Concept - Telco 2.0

In this instance, the cloud component makes the service more flexible, cheaper and easier to deliver than a traditional IT structure. This type of concept is sometimes described as a ‘mobile cloud’ because many of the interesting uses relate to mobile applications, and are not reliant on continuous high-grade mobile connectivity required for e.g. IaaS: rather they can make use of bursts of connectivity to validate identities etc. via APIs ‘in the cloud’.

To read the rest of this Analyst Note, containing…

  • Forecasts of telco share of cloud by VPC, IaaS, PaaS and SaaS
  • Telco 2.0 take-outs and next steps
  • And detailed Brainstorm delegate feedback

Members of the Telco 2.0TM Executive Briefing Subscription Service and the Cloud and Enterprise ICT Stream can access and download a PDF of the full report here. Non-Members, please see here for how to subscribe. Alternatively, please email contact@telco2.net or call +44 (0) 207 247 5003 for further details.

The Roadmap to New Telco 2.0 Business Models

$375Bn per annum Growth or Brutal Retrenchment? Which route will Telcos take?

Over the last three years, the Telco 2.0 Initiative has identified new business model growth opportunities for telcos of $375Bn p.a. in mature markets alone (see the ‘$125Bn Telco 2.0 ‘Two-Sided’ Market Opportunity’ and ‘New Mobile, Fixed and Wholesale Broadband Business Models’ Strategy Reports). In that time, most of the major operators have started to integrate elements of Telco 2.0 thinking into their strategic plans and some have begun to communicate these to investors.

But, as they struggle with the harsh realities of the seismic shift from being predominantly voice-centric to data-centric businesses, telcos now find themselves:

  • Facing rapidly changing consumer behaviours and powerful new types of competitors;
  • Investing heavily in infrastructure, without a clear payback;
  • Operating under less benign regulatory environments, which constrain their actions;
  • Being milked for dividends by shareholders, unable to invest in innovation.

As a result, far from yet realising the innovative growth potential we identified, many telcos around the world seem challenged to make the bold moves needed to make their business models sustainable, leaving them facing retrenchment and potentially ultimately utility status, while other players in the digital economy prosper.

In our new 284 page strategy report – ‘The Roadmap to Telco 2.0 Business Models’ – we describe the transformational path the telecoms industry needs to take to carve out a more valuable role in the evolving ‘digital economy’. Based on the output from 5 intensive senior executive ‘brainstorms’ attended by over 1000 industry leaders, detailed analysis of the needs of ‘upstream’ industries and ‘downstream’ end users markets, and with the input from members and partners of the Telco 2.0 Initiative from across the world, the report specifically describes:

  • A new ‘Telco 2.0 Opportunity Framework’ for planning revenue growth;
  • The critical changes needed to telco innovation processes;
  • The strategic priorities and options for different types of telcos in different markets;
  • Best practice case studies of business model innovation.

The ‘Roadmap’ Report Builds on Telco 2.0’s Original ‘Two-Sided’ Telecoms Business Model

Updated Telco 2.0 Industry Framework

Source: The Roadmap to New Telco 2.0 Business Models


Who should read this report

The report is for strategy decision makers and influences across the TMT (Telecoms, Media and Technology) sector. In particular, CxOs, Strategists, Technologists, Marketers, Product Managers, and Legal and Regulatory leaders in telecoms operators, vendors, consultants, and analyst companies. It will also be valuable to those managing or considering medium to long-term investment in the telecoms and adjacent industries, and to regulators and legislators.

It provides fresh, creative ideas to:

Grow revenues beyond current projections by:

  • Protecting revenues from existing customers;
  • Extending services to new customers;
  • Generating new service offering and revenues.

Stay relevant with customers through:

  • A broader range of services and offers;
  • More personalised services;
  • Greater interaction with customers.

Evolve business models by:

  • Moving from a one-sided to a two-sided business model;
  • Generating cross-platform network effects – between service providers and customers;
  • Exploiting existing latent assets, skills and relationships.


The Six Telco 2.0 Opportunity Areas

Six Telco 2.0 Opportunity Types

Source: The Roadmap to New Telco 2.0 Business Models

What are the Key Questions the Report Answers?

For Telcos:

  • Where should your company be investing for growth?
  • What is ‘best practice’ in telecoms Telco 2.0 business model innovation and how does your company compare to it?
  • Which additional strategies should you consider, and which should you avoid?
  • What are the key emerging trends to monitor?
  • What actions are required in the areas of value proposition, technology, value / partner network, and finances?

For Vendors and Partners:

  • How to segment telecoms operators?
  • How well does your offering support Telco 2.0 strategies and transformation needs in your key customers?
  • What are the most attractive new areas in which you could support telcos in business model innovation?

For Investors and Regulators:

  • What are and will be the main new categories of telcos/CSPs?
  • What are the principle opportunity areas for operators?
  • What are and will be operator’s main strategic considerations with respect to new business models?
  • What are the major regulatory considerations of new business models?
  • What are the main advantages and disadvantages that telcos have in each opportunity area?

Contents

  • Executive Summary & Introduction
  • Pressures on Operators
  • The new Telco 2.0 Framework
  • Principles of Innovation and Services Delivery
  • – Strategic Positioning
  • – Design
  • – Development and delivery
  • Categorising telcos
  • Category 1: Leading international operators
  • Category 2: Regional leaders
  • Category 3: Wholesale and business-focused telcos
  • Category 4: Challengers & disruptors
  • Category 5: Smaller national leaders
  • Conclusions and Recommendations


Public Wifi: Destroying LTE/Mobile Value?

Summary: By building or acquiring Public WiFi networks for tens of $Ms, highly innovative fixed players in the UK are stealthily removing $Bns of value from 3G and 4G mobile spectrum as smartphone and other data devices become increasingly carrier agnostic. What are the lessons globally?

Below is an extract from this 15 page Telco 2.0 Analyst Note that can be downloaded in full in PDF format by members of the Telco 2.0 Executive Briefing service and Future Networks Stream using the links below.

Read in Full (Members only)        To Subscribe

The mobile broadband landscape is a key session theme at our upcoming ‘New Digital Economics’ Brainstorm (London, 11-13 May). Please use the links or email contact@telco2.net or call +44 (0) 207 247 5003 to find out more.

To share this article easily, please click:

//

Two recent announcements have reignited interest in the UK Public WiFi space: Sky buying The Cloud for a reputed figure just short of £50m and Virgin Media announcing their intention to invest in building a metro WiFi network based around their significant outdoor real estate in the major conurbations.

These can be seen narrowly as competitive reactions to the success of the BT Openzone public WiFi product, which is a clear differentiator for the BT home broadband offer in the eyes of the consumer. The recent resurgence of BT market share in the home broadband market hints that public WiFi is an ingredient valued by consumers, especially when the price is bundled into the home access charges and therefore perceived as “free” by the consumer.

This trend is being accelerated by the new generation of Smartphones sensing whether private and public WiFi access or mobile operator network access offer the best connection for the end-user and then making the authentication process much easier. Furthermore, the case of the mobile operators is not helped by laptops and more importantly tablets and other connected devices such as e-readers offering WiFi as a default means of access with mobile operator 3G requiring extra investment in both equipment and access with a clumsy means of authentication.

In a wider context, the phenomena should be extremely concerning for the UK mobile operators. There has been a two decade trend of voice traffic inside the home moving from fixed to mobile networks with a clear revenue gain for the mobile operators. In the data world, it appears that the bulk of the heavy lifting appears to being served within the home by private WiFi and outside of the home in nomadic spots served by public WiFi.

With most of the public WiFi hotspots in the UK being offered by fixed operators, there is a potential value shift from mobile to fixed networks reversing that two decade trend. As the hotspots grow and critically, once they become interconnected, there is an increasing risk to mobile operators in terms of the value of investment in expensive ‘4G’ / LTE spectrum.

Beyond this, a major problem for mobile operators is that the current trend for multi-mode networking (i.e. combination of WiFi and 3G access) limits the ability of operators to provide VAS services and/or capture 2-sided business model revenues, since so much activity is off-network and outside of the operator’s control plane.

The history of WiFi presents reality lessons for Mobile Operators, namely:

  • With Innovation, it not always the innovators who gain the most;
  • Similarly, with Standards setting, it not always the people who set the standards who gain the most; and
  • WiFi is a classic case of Apple driving mass adoption and reaping the benefits – to this day, Apple still seems to prefer WiFi over 3G.

This analyst note explains the flurry of recent announcements in the context of:

  • The unique UK market structure;
  • Technology Adoption Cycles;
  • How intelligence at the edge of the network will drive both private and public WiFi use;
  • How public WiFi in the UK might evolve;
  • The longer term value threat to the mobile operators;
  • How O2 and Vodafone are taking different strategies to fight back; and
  • Lessons for other markets.

Unique Nature of the UK Market Structure

In May 2002, BT Cellnet, the mobile arm of BT, soon to be renamed O2, demerged from BT leaving the UK market as one of few markets in the world where the incumbent PTT did not have a mobile arm. Ever since BT has tried to get into the mobility game with varying degrees of success:

  • In the summer of 2002, it launched its public WiFi service called OpenZone;
  • In September 2003 it announced plans for WiFi in all public phone boxes ;
  • In May 2004, it launched an MVNO with Vodafone with plans for the doomed BT Fusion UMA (Bluetooth then WiFi ) phone;
  • In May 2006, with Metro WiFi plans in partnership with local authorities in 12 cities; and
  • In Oct 2007, in partnership with FON to put public WiFi in each and every BT home routers.

After trying out different angles in the mobility business for five years, BT finally discovered a workable business model with public WiFi around the FON partnership. BT now effectively bundle free public WiFi to its broadband users in return for establishing a public hotspot within their own home.

Huge Growth in UK Public Wifi Usage

Approximately 2.6m or 47% customers of a total of 5.5m BT broadband connections have taken this option. This creates the image of huge public WiFi coverage and clearly currently differentiates BT from other home broadband providers. And, the public WiFi network is being used much more: 881 million minutes in the current quarter compared to 335 million minutes in the previous year.

The other significant element of the BT public WiFi network is the public hotspots they have built with hotels, restaurants, airports. The hotspots number around 5k, of which 1.2k are wholesale arrangements with other public WiFi hotspot providers. While not significant in number, these provide the real incremental value to the BT home broadband user who can connect for “free” in these high traffic locations.

BT was not alone in trying to build a public WiFi business. The Cloud was launched in the UK in 2003 and tried to build a more traditional public WiFi business building upon a combination of direct end user revenues and wholesale and interconnect arrangements. That Sky are paying “south of £50m” for The Cloud compared to the “€50m invested” over the years by the VC backers implies the traditional public WiFi business model just doesn’t work. A different strategy will be taken by Sky going forward.

Sky is the largest pay-tv provider in the UK currently serving approximately 10m homes by satellite DTH. In 2005, Sky decided upon a change of strategy and decided that in addition to offering its customers video services, they needed to offer broadband and phone services. Sky has subsequently invested approximately £1bn in buying an altnet, Easynet, for £211m, in building a LLU network on top of BT infrastructure and acquiring 3m broadband customers. If the past is anything to go by, Sky will be planning on investing considerable further sums in The Cloud to make it at a minimum a comparable service to BT Openzone for its customers.

Virgin Media is the only cable operator of any significance in the UK with a footprint of around 50% of the UK mainly in the dense conurbations. Virgin Media is the child of many years of cable consolidation and historically suffered from disparate metro cable networks of varying quality and an overleveraged balance sheet. The present management has a done a good job of tidying up the mess and upgrading the networks to DOCSIS 3.0 technology. In the last year, Virgin Media has started to expand its footprint again and investing in new products with plans for building a metro WiFi network based around its large footprint of cabinets in the street.

Virgin Media has a large base of 4.3m home broadband users to protect and an even larger base of potential homes to sell services into. In addition, Virgin Media is the largest MVNO in the UK with around 3m mobile subscribers. In recent years, Virgin Media have focused upon selling mobile services into their current cable customers. Although, Virgin Media’s public WiFi strategy is not in the public domain, it is clear that they plan on investing in 2011.

TalkTalk is the only other significant UK Home Broadband player with 4.2m home broadband users and currently has no declared public WiFi strategies.

The mobile operators which have invested in broadband, namely O2 and Orange, have failed to gain traction in the marketplace.

The key trend here is that the fixed broadband network providers are moving outside of the home and providing more value to their customers on the move.

Technology Adoption Cycles

Figure 1: Geoffrey Moore’s Technology Adoption Cycle

Geoffrey Moore documented technology adoption cycles, originally in the “Crossing the Chasm” book and subsequently in the “Living in the Fault Line” book. These books described the pain in products crossing over from early adopters to the mass market. Since publication, they have established themselves as the bible for a generation of Technology marketers. Moore distinguishes six zones, which are adopted to describe the situation of public WiFi in the UK.

  1. The early market: a time of great excitement when visionaries are looking to get on board. In the public WiFi market this period was clearly established in mid-2005 era when public WiFi networks where promoted as real alternatives to private MNOs.
  2. The chasm: a time of great despair as initial interest wanes and the mainstream is not comfortable with adoption. The UK WiFi market has been stagnating for the previous few years as investment in public WiFi has declined and customer adoption has not accelerated beyond the techno-savvy.
  3. The bowling alley: a period of niche adoption ahead of the general marketplace. The UK market is currently in this period. The two key skittles to fall were the BT FON deal changing the public WiFi business model, and the launch of the iPhone with auto-sensing and easy authentication of public WiFi.
  4. The tornado: a period of mass-market adoption. The UK market is about to enter in this phase as public WiFi investment is reinvigorated deploying providing “bundled” access to most home broadband users.
  5. Main street: Base infrastructure has been deployed and the goal is to flesh out the potential. We are probably a few years away from this and this phase will focus on ease-of-use, interconnect of public WiFi networks, consolidation of smaller players and alternate revenue sources such as advertising.
  6. Total Assimilation: Everyone is using the technology and the market is ripe for another wave of disruption. For UK WiFi, this is probably at least a decade away, but who know what the future holds?

Flashback: How Private WiFi crossed the Chasm

It is worthwhile at this point to revisit the history of WiFi as it provides some perspective and pointers for the future, especially who the winners and losers will be in the public WiFi space.

Back in 1985 when deregulation was still in fashion, the USA FCC opened up some spectrum to provide an innovation spurt to US industry under a license exempt and “free-to-use” regime. This was remarkable in itself given that previously spectrum, whether for radio and television broadcasting or public and private communications, had been exclusively licensed. Any applications in the so-called ISM (Industrial, Scientific and Medical) bands would have to deal with contention from other applications using the spectrum and therefore the primary use was seen as indoor and corporate applications.

Retail department stores, one of the main clients of NCR (National Cash Registers), tended to reconfigure their floor space on a regular basis and the cost of continual rewiring of point-of-sales equipment was a significant expense. NCR saw an opportunity to use the ISM bands to solve this problem and started a R&D project in the Netherlands to create wireless local area networks which required no cabling.

At this time, the IEEE were leading the standardization effort for local area networks and the 802.3 Ethernet specification initially approved in 1987 still forms the basis of the most wired LAN implementations today. NCR decided that the standards road was the route to take and played a leading role in the eventual creation of 802.11 wireless LAN standards in 1997. Wireless LAN was considered too much of a mouthful and was reinvented as WiFi in 1999 with the help of a branding agency.

Ahead of the standards approval, NCR launched products under the WaveLAN brand in 1990 but the cost of the plug-in cards at US$1,400 were very expensive compared to the wired ethernet cards which were priced at around US$400. Product take-up was slow outside of early adopters.

In 1991 an early form of Telco-IT convergence emerged as AT&T bought NCR. An early competitor for the ISM bandwidth emerged with AT&T developing a new generation of digital cordless phones using the 2.4GHz band. To this day, in the majority of UK and worldwide households, DECT handsets in the home compete with WiFi for spectrum. Product development of the cards continued and was made consumer friendly easier with the adoption on the PCMIA card slots in PCs.

By 1997, WiFi technology was firmly stuck in the chasm. The major card vendors (Proxim, Aironet, Xircom and AT&T) all had non-standardized products and the vendors were at best marginally profitable struggling to grow the market.
AT&T had broken up and the WiFi business became part of Lucent Technologies. The eyes and brains of the big communications companies (Alcatel, Ericsson, Lucent, Motorola, Nokia, Nortel and Siemens) were focused on network solutions with 3G holding the promise for the future.

All that was about to change in early 1998 with a meeting between Steve Jobs of Apple and Richard McGinn, CEO of Lucent:

  • Steve Jobs declared “Wireless LANs are the greatest thing on earth, Apple wants a radio card for US$50, which Apple will retail at US$99”;
  • Rich McGinn declared 1999 to be the year of DSL and asked if Apple would be ready; and
  • Steve Jobs retort was revealing to this day “Probably not next, maybe the year after; depends upon whether there is one standard worldwide”.

Figure 2: The Apple Airport

In early 1998 the cost of the cards was still above US$100 and needed a new generation of chips to bring the cost down to the Apple price point. Further, Apple wanted to use the 11Mbit/s standard which had just been developed rather than the current 2Mbit/s. However, despite the challenges the product was launched in July 1999 as the Apple Airport with the PCMCIA card at US$99 and the access point at US$299. Apple was the first skittle to fall as private WiFi crossed the chasm. The Windows based OEMs rushed to follow.

By 2001, Lucent had spun out its chip making arm as Agere Systems which had a market share of 50% of a US$1bn WiFi market, which would have been nothing but a pin prick on either the AT&T or Lucent profit and loss had Agere remained as part of them.

The final piece in the WiFi jigsaw fell into place when Intel acquired Xircom in 1999 and developed the Xircom technology and used their WiFi patents as protection against competitors. In 2003, Intel launched its Centrino chipset with built in WiFi functionality for laptops supported by a US$300m worldwide marketing campaign. Effectively for the consumer WiFi had become part the laptop bundle.

Agere Systems and all its WiFi heritage was finished and they discontinued its WiFi activities in 2004.

There are three clear pointers for the future:

  • The players who take a leading role in the early market will not necessary be the ones to succeed in Main Street;
  • Apple took a leading role in the adoption of WiFi and still seems massively committed to WiFi technology to this day;
  • Technology adoption cycles tend to be longer than expected.

Intelligence at the edge of the Network

As early as 2003, Broadcom and Phillips were launching specialized WiFi chips aimed at mobile phones. Several cellular handsets were launched with WiFi combined with 2G/3G connectivity, but the connectivity software was clunky for the user.

The launch of the iPhone in 2007 began a new era where the device automatically attempts to connect to any WiFi network if the signal strength is better than the 2G/3G network. The era of the home or work WiFi network being the preferred route for data traffic was ushered in.

Apple is trying to make authentication as simple as possible: enter the key for any WiFi network once and it will be remembered for the handset’s lifetime and connect automatically when a user returns in range. However, in dense urban networks with multiple WiFi access points, it is quite annoying to be prompted for key after key. The strength of the federated authentication system in cellular networks is therefore still a critical advantage.

The iPhone also senses that some applications can only be used when WiFi connections are available. The classic example is Apple’s own Facetime (video calling) application. Mobile Operators seem happy in the short run that bandwidth intensive applications are kept off their networks. But, there is a longer term value statement with the users being continually being reminded that WiFi networks are superior to mobile operators’ networks.

Other mobile operating systems, such as Android and Windows Phone 7, have copied the Apple approach and today there is no going back: multi-modal mobile phones are here to stay and the devices themselves decide which network to use unless the user over-rides this choice.

One of underlying rules of the internet is that intelligence moves to the edge of the network. The edges are probably in the eyes of Apple and Google the handsets and their server farms. It is not beyond the realms of possibility that future Smartphones will be supplied with automatic authentication for both WiFi and Cellular networks with least-cost routing software determining the best price for the user. As intelligence moves to the edge so does value.

Public WiFi Hotspots – the Business Model challenges

The JiWire directory estimates that there are c. 414k public WiFi locations across the globe at the end of 2010, and there are WiFi hotspots currently located 26.5k in the UK. Across the globe, there is a shift from a paid-for model to a free-model with the USA being top of the free chart with 54% of public WiFi locations being free.

For a café chain offering free access to WiFi is a good model to follow. The theory is that people will make extra visits to buy a coffee just to check their email or some other light internet visit. Starbucks started the trend by offering free WiFi access, all the rest felt compelled to follow. Nowadays, all the major chains whether Costa Coffee, Café Nero and even McDonalds offer free WiFi access provided by either BT Openzone or Sky’s The Cloud. A partnership with a public WiFi provider is perfect as the café chain doesn’t have to provide complicated networking support or regulatory compliance. The costs for the public WiFi provider are relativity small especially if they are amortized across a large base of broadband users.

For hotels and resorts, the business case is more difficult as most hotels are quite large and multiple access points are required to provide decent coverage to all rooms. Furthermore, hotels traditionally have made additional revenues from most services and therefore complexity is added with billing systems. For most hotels and resorts a revenue share agreement is negotiated with the WiFi service provider.

For public places, such as airports and train stations, the business case is also complicated by the owners knowing these sites are high in footfall and therefore demand a premium for any activity whether retail or service based. It is a similar problem that mobile operators face when trying to provide coverage in major locations: access to prime locations is expensive. In the UK, the entry of Sky into the public WiFi and its long association with Sports brings an intriguing possible partnership with the UK’s major venues.

These three types of locations currently account for 75% of current public WiFi usage according to JiWire.

To read the rest of the article, including:

  • How will UK Public WiFi Evolve?
  • Challenge to Mobile Operators
  • O2 Tries an Alternative
  • Vodafone Goes with Femtos
  • Lessons for Other Markets

Members of the Telco 2.0TM Executive Briefing Subscription Service and Future Networks Stream can access and download a PDF of the full report here. Non-Members, please see here for how to subscribe. Alternatively, please email contact@telco2.net or call +44 (0) 207 247 5003 for further details. ‘Growing the Mobile Internet’ and ‘Lessons from Apple: Fostering vibrant content ecosystems’ are also featured at our AMERICAS and EMEA Executive Brainstorms and Best Practice Live! virtual events.