M2M 2.0: Market, Business Models, and Telcos’ Role(s)
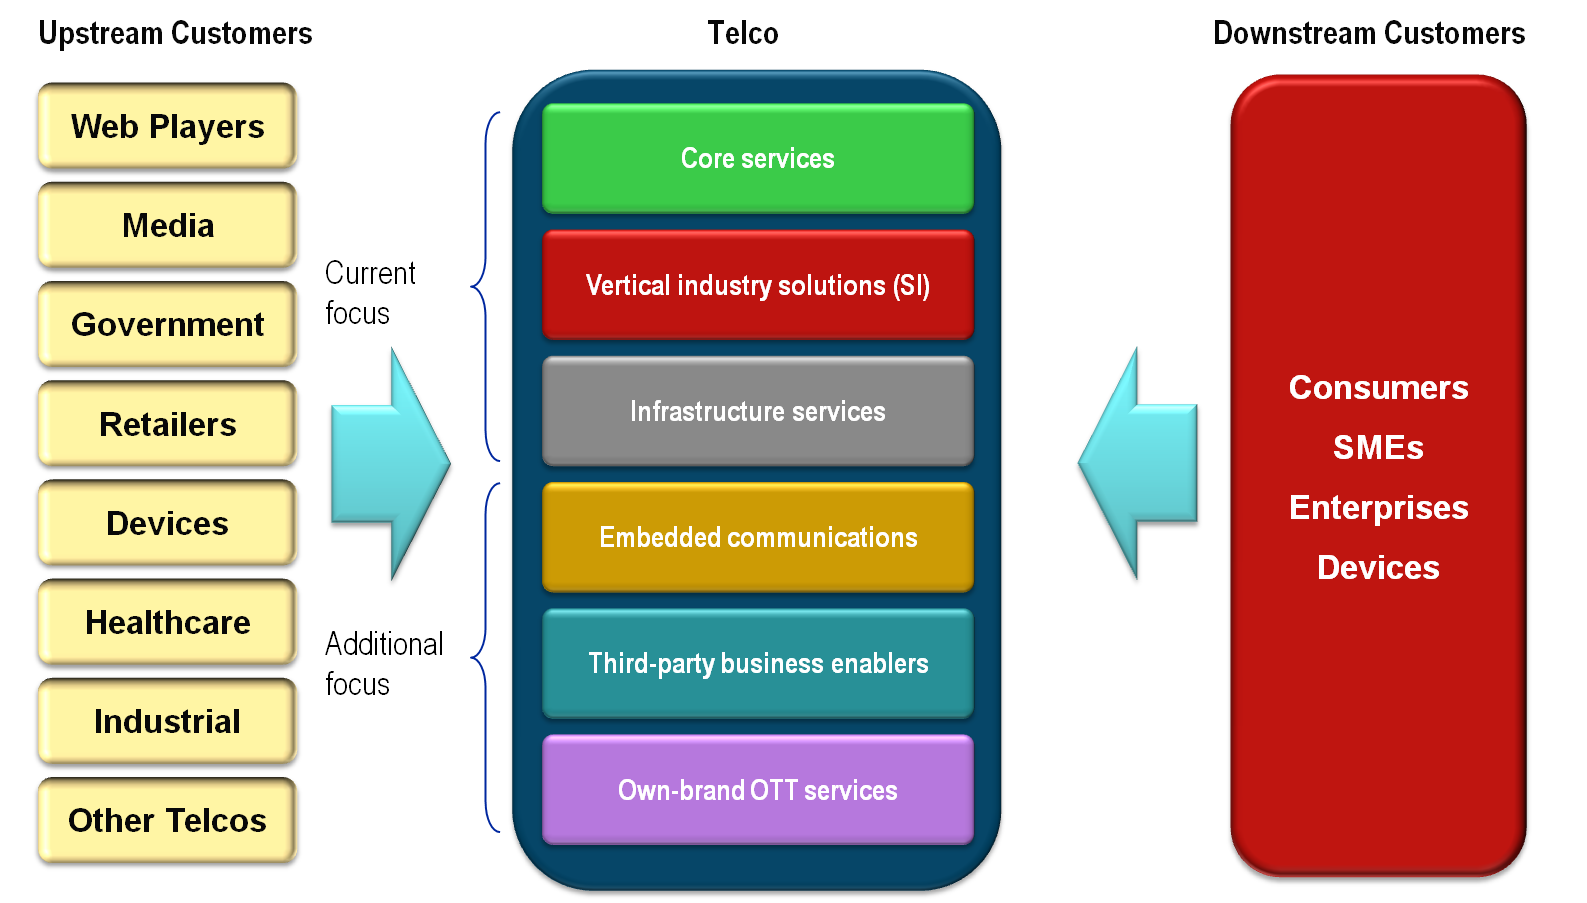
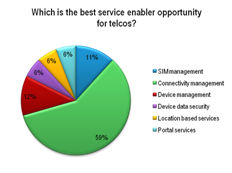
Our latest report on M2M 2.0 covers: M2M market growth, structure and dynamics; business models; the best role(s) for telcos; and leading thinking from Deutsche Telekom, Vodafone, Telenor, KPN and Swisscom. It describes how ‘Service Enablers’ are key to the telco opportunity in M2M in addition to connectivity. (July 2011, Executive Briefing Service)
M2M Pie Chart Service Enablers July 2011