Telco plays in live entertainment

Enhancing live entertainment

Live entertainment spans everything from a handful of people enjoying stand-up comedy in a pub to a football match attended by 100,000 fans. Although there are many different forms and formats of live entertainment, they share three inter-related characteristics – immediacy, interactivity and immersion. The performers make things happen and people tend to react, by clapping, shouting, singing or gesticulating at the performers or by interacting with each other. A compelling event will also be immersive in the sense that the spectators will focus entirely on the action.

For telcos, live events present specific challenges and opportunities. Simultaneously providing millions of people with high quality images and audio from live events can soak up large amounts of bandwidth on networks, forcing telcos to invest in additional capacity. Yet, it should be feasible to make a return on that investment: live events are an enormously popular form of entertainment on which people around the world are prepared to spend vast sums of money. This is a market where demand often outstrips supply: tickets for top tier sports events or music concerts can cost US$150 or more.

With the advent of 5G and Wi-Fi 6E, telcos have an opportunity to improve spectators’ enjoyment of live events both within a venue and in remote locations. Indeed, telcos could play a key role in enabling many more people to both participate in and appreciate live entertainment, thereby helping them to enjoy more fulfilling and enriching lives.

Enter your details below to request an extract of the report

The opportunities to use new technologies to enhance live events

Live entertainment

Source: STL Partners

More broadly, telecoms networks and related services have become fundamental to the smooth running of our increasingly digital economy. Our landmark report The Coordination Age: A third age of telecoms explained how reliable and ubiquitous connectivity can enable companies and consumers to use digital technologies to efficiently allocate and source assets and resources. In the case of live entertainment, telcos can help people to make better use of their leisure time – a precious and very finite resource for most individuals.

This report begins by providing an overview of the live entertainment opportunity for telcos, outlining the services they could provide to support both professional and amateur events. It then considers the growing demand for high-definition, 360-degree coverage of live events, before discussing why it is increasingly important to deliver footage in real-time, rather than near real-time. Subsequent sections explore the expanding role of edge computing in facilitating live broadcasts and how augmented reality and virtual reality could be used to create more immersive and interactive experiences.

This report draws on the experiences and actions of AT&T, BT, NTT and Verizon, which are all very active in the coverage of live sports. It also builds on previous STL Partners research including:

Contents

  • Executive Summary
  • Introduction
  • Opportunities to enhance live entertainment
    • Amateur entertainment – a B2C play
  • Delivering high-definition/360-degree video
    • New broadcast technologies
    • Real-time encoding and compression
    • Traffic management and net neutrality
  • Real real-time coverage and stats
    • More data and more stats
    • Personalised advertising and offers
  • Edge computing and the in-event experience
    • Refereeing automation/support
    • In-venue security and safety
    • Wi-Fi versus 5G
  • Augmented reality – blurring the lines
  • Conclusions
    • Tech can enrich people’s experience of live events
    • The role of telcos
  • Index

Enter your details below to request an extract of the report

Consumer strategy: What should telcos do?

Globally, telcos are pursuing a wide variety of strategies in the consumer market, ranging from broad competition with the major Internet platforms to a narrow focus on delivering connectivity.

Some telcos, such as Orange France, Telefónica Spain, Reliance Jio and Rakuten Mobile, are combining connectivity with an array of services, such as messaging, entertainment, smart home, financial services and digital health propositions. Others, such as Three UK, focus almost entirely on delivering connectivity, while many sit somewhere in between, targeting a single vertical market, in addition to connectivity. AT&T is entertainment-orientated, while Safaricom is financial services-focused.

This report analyses the consumer strategies of the leading telcos in the UK and the Brazil – two very different markets. Whereas the UK is a densely populated, English-speaking country, Brazil has a highly-dispersed population that speaks Portuguese, making the barriers to entry higher for multinational telecoms and content companies.

By examining these two telecoms markets in detail, this report will consider which of these strategies is working, looking, in particular, at whether a halfway-house approach can be successful, given the economies of scope available to companies, such as Amazon and Google, that offer consumers a broad range of digital services. It also considers whether telcos need to be vertically-integrated in the consumer market to be successful. Or can they rely heavily on partnerships with third-parties? Do they need their own distinctive service layer developed in-house?

In light of the behavourial changes brought about by the pandemic, the report also considers whether telcos should be revamping their consumer propositions so that they are more focused on the provision of ultra-reliable connectivity, so people can be sure to work from home productively. Is residential connectivity really a commodity or can telcos now charge a premium for services that ensure a home office is reliably and securely connected throughout the day?

A future STL Partners report will explore telcos’ new working from home propositions in further detail.

Enter your details below to request an extract of the report

The UK market: Convergence is king

The UK is one of the most developed and competitive telecoms markets in the world. It has a high population density, with 84% of its 66 million people living in urban areas, according to the CIA Factbook. There are almost 272 people for every square kilometre, compared with an average of 103 across Europe. For every 100 people, there are 48 fixed lines and 41 broadband connections, while the vast majority of adults have a mobile phone. GDP per capita (on a purchasing power parity basis) is US$ 48,710, compared with US$ 65,118 in the US (according to the World Bank).

The strength of the state-funded public service broadcaster, the BBC, has made it harder for private sector players to make money in the content market. The BBC delivers a large amount of high-quality advertising-free content to anyone in the UK who pays the annual license fee, which is compulsory to watch television.

In the UK, the leading telcos have mostly eschewed expansion into the broader digital services market. That reflects the strong position of the leading global Internet platforms in the UK, as well as the quality of free-to-air television, and the highly competitive nature of the UK telecoms market – UK operators have relatively low margins, giving them little leeway to invest in the development of other digital services.

Figure 1 summarises where the five main network operators (and broadband/TV provider Sky) are positioned on a matrix mapping degree of vertical integration against the breadth of the proposition.

Most UK telcos have focused on the provision of connectivity

UK telco B2C strategies

Source: STL Partners

Brazil: Land of new opportunities

Almost as large as the US, Brazil has a population density is just 25 people per square kilometre – one tenth of the total UK average population density. Although 87% of Brazil’s 212 million people live in urban areas, according to the CIA Fact book, that means almost 28 million people are spread across the country’s rural communities.

By European standards, Brazil’s fixed-line infrastructure is relatively sparse. For every 100 people, Brazil has 16 fixed lines, 15 fixed broadband connections and 99 mobile connections. Its GDP per capita (on a purchasing power parity basis) is US$ 15,259 – about one third of that in the UK. About 70% of adults had a bank account in 2017, according to the latest World Bank data. However, only 58% of the adult population were actively using the account.

A vast middle-income country, Brazil has a very different telecoms market to that of the UK. In particular, network coverage and quality continue to be important purchasing criteria for consumers in many parts of the country. As a result, Oi, one of the four main network operators, became uncompetitive and entered a bankruptcy restructuring process in 2016. It is now hoping to to sell its sub-scale mobile unit for at least 15 billion reais (US$ 2.8 billion) to refocus the company on its fibre network. The other three major telcos, Vivo (part of Telefónica), Claro (part of América Móvil) and TIM Brazil, have made a joint bid to buy its mobile assets.

For this trio, opportunities may be opening up. They could, for example, play a key role in making financial services available across Brazil’s sprawling landmass, much of which is still served by inadequate road and rail infrastructure. If they can help Brazil’s increasingly cash-strapped consumers to save time and money, they will likely prosper. Even before COVID-19 struck, Brazil was struggling with the fall-out from an early economic crisis.

At the same time, Brazil’s home entertainment market is in a major state of flux. Demand for pay television, in particular, is falling away, as consumers seek out cheaper Internet-based streaming options.

All of Brazil’s major telcos are building a broad consumer play

Brazil telco consumer market strategy overview

Source: STL Partners

Table of contents

  • Executive Summary
  • Introduction
    • The UK market: Convergence is king
    • BT: Trying to be broad and deep
    • Virgin Media: An aggregation play
    • O2 UK: Changing course again
    • Vodafone: A belated convergence play
    • Three UK: Small and focused
    • Takeaways from the UK market: Triple play gridlock
  • Brazil: Land of new opportunities
    • The Brazilian mobile market
    • The Brazilian fixed-line market
    • The Brazilian pay TV market
    • The travails of Oi
    • Vivo: Playing catch-up in fibre
    • Telefónica’s financial performance
    • América Móvil goes broad in Brazil
    • TIM: Small, but perfectly formed?
    • Takeaways from the Brazilian market: A potentially treacherous transition
  • Index

Enter your details below to request an extract of the report

How BT beat Apple and Google over 5 years

BT Group outperformed Apple and Google

Over the last five years, the share price of BT Group, the UK’s ex-incumbent telecoms operator, has outperformed those of Apple and Google, as well as a raft of other telecoms shares. The following chart shows BT’s share price in red and Apple’s in in blue for comparison.

Figure 1:  BT’s Share Price over 5 Years

Source: www.stockcharts.com

Now of course, over a longer period, Apple and Google have raced way ahead of BT in terms of market capitalisation, with Apple’s capital worth $654bn and Google $429bn USD compared to BT’s £35bn (c$53bn USD).

And, with any such analysis, where you start the comparison matters. Nonetheless, BT’s share price performance during this period has been pretty impressive – and it has delivered dividends too.

The total shareholder returns (capital growth plus all dividends) of shares in BT bought in September 2010 are over 200% despite its revenues going down in the period.

So what has happened at BT, then?

Sound basic financials despite falling revenues

Over this 5 year period, BT’s total revenues fell by 12%. However, in this period BT has also managed to grow EBITDA from £5.9bn to £6.3bn – an impressive margin expansion.   This clearly cannot go on for ever (a company cannot endlessly shrink its way to higher profits) but this has contributed to positive capital markets sentiment.

Figure 2: BT Group Revenue and EBITDA 2010/11 – 2014/15

[Figure 2]

Source: BT company accounts, STL Partners

BT pays off its debts

BT has also managed to reduce its debt significantly, from £8.8bn to £5.1bn over this period.

Figure 3: BT has reduced its debts by more than a third (£billions)


Source: BT company accounts, STL Partners

Margin expansion and debt reduction suggests good financial management but this does not explain the dramatic growth in firm value (market capitalisation plus net debt) from just over £20bn in March 2011 to circa £40bn today (based on a mid-September 2015 share price).

Figure 4: BT Group’s Firm Value has doubled in 5 Years

Source: BT company accounts, STL Partners

  • Introduction: BT’s Share Price Miracle
  • So what has happened at BT, then?
  • Sound basic financials despite falling revenues
  • Paying off its debts
  • BT Sport: a phenomenal halo effect?
  • Will BT Sport continue to shine?
  • Take-Outs from BT’s Success


  • Figure 1: BT’s Share Price over 5 Years
  • Figure 2: 5-Year Total Shareholder Returns Vs Revenue Growth for leading telecoms players
  • Figure 3: BT Group Revenue and EBITDA 2010/11-2014/15
  • Figure 4: BT has reduced its debts by more than a third (£billions)
  • Figure 5: BT Group’s Firm Value has doubled in 5 Years
  • Figure 6: BT Group has improved key market valuation ratios
  • Figure 7: BT ‘broadband and TV’ compared to BT Consumer Division
  • Figure 8: Comparing Firm Values / Revenue Ratios
  • Figure 9: BT Sport’s impact on broadband

Connected TV: Forecasts and Winners/Losers (UK Case Study)

Summary: our in-depth look at the UK’s highly competitive digital TV market which reflects many global trends, such as competition between different types of content distributor (LoveFilm, YouTube, Virgin Media, BBC, BSkyB, BT, etc.), channel proliferation, new devices used for viewing,  and the increasing prevalence of connected TVs. What are the key trends and who will be the winners and losers? (August 2011, Executive Briefing Service) Chart from Connected TV Figure 2 telco 2.0
 

  Read in Full (Members only)    Buy This Report    To Subscribe

Below is an extract from this 23 page Telco 2.0 Report that can be downloaded in full in PDF format by members of the Telco 2.0 Executive Briefing service here. Non-members can buy a Single User license for this report online here for £595 (+VAT) or subscribe here. For multiple user licenses, or to book a place at our Digital Entertainment 2.0 workshop on New Business Models for the Home Video Entertainment market in Europe – Lessons from America at our London Executive Brainstorm on 8th November, please email contact@telco2.net or call +44 (0) 207 247 5003.

To share this article easily, please click:

Introduction and Background

With every wave of innovation, there are always winners and losers. In this note we examine who are likely to be the winners and losers in the UK as increasingly, TVs become connected to the internet.

While it is difficult to generalise with TV markets across the globe as the markets are fundamentally different in structure, especially with key variables such as PayTV penetration, state broadcaster involvement and fast broadband penetration varying widely, the comprehensive range of players and highly competitive nature of the UK market makes it a useful benchmark for many key global trends.

The UK TV Market

According to OFCOM’s latest research, there are 26.6m TV households in the UK with 60m TV sets or an average of 2.25 TV sets per household.

TV Viewing

Figure 1 – Average UK TV Viewing Per Day

Chart of average UK TV viewing to 2010 Fig 1 Connected TV Article Telco 2.0

Source: BARB.

TV viewing over the last few years has been remarkably resilient despite the internet and other platforms competing hard for attention. Where the TV market differs is that average consumption is very strongly proportional to age. In typical technology adoption cycles, adoption is indirectly proportional to age. This presents a real challenge to the connected TV market: the main TV consumers are more than likely to be adverse to technological change.

TV Device Manufacturers

Figure 2 – Annual UK TV Set Sales by Type 2002-2010

Chart of annual UK TV Set Sales to 2010 Fig 2 Connected TV Telco 2.0

The long term volume trend for TV manufacturers has been healthy. This has mainly been due to the innovation in device form and screen quality, with flat screen and HD features becoming the norm. TV manufacturers are now hoping that internet connected TV’s will generate another spurt in growth. Samsung and Sony are the UK market leaders.

But the challenge is the replacement cycles. With a 60m installed base of TV’s in the UK, and assuming that all the 9.5m TV’s sold in 2010 are replacements and not simply increasing the number of sets per household, the implication is that the replacement cycle is currently roughly every six years at a minimum. This is relatively slow when compared to two years for mobile phones and three years for laptops, and this in turn suggests that the adoption rate for standalone connected TVs will be much slower than the technology cycles for these devices.

While we expect internet connectivity to become a pretty standard feature with TV over the next couple of years we are sceptical about their active use for viewing video. The content offering is currently too limited. We would be surprised if within a couple of years, there are more than 1m homes regularly using TVs to watch video over the internet.

Set Top Boxes

The Set Top Box market in the UK falls into two categories: a subsidised segment which the consumer generally gets either for free or heavily discounted by their PayTV provider; and a retail segment where the consumer generally pays a full price and gives the consumer access to a limited set of free to air (FTA) channels and quite often DVR features.

In the subsidised segment, the market leader is Sky which currently manufacturers its own boxes. All the current models contain internet connectivity but require a subscription to Sky Broadband service to access Sky’s closed pull VOD service, Sky Anytime+. Sky has seeded the market for quite a few years with its Sky+ HD boxes which are currently in a minimum of 3,822k UK homes. We say a minimum because the figure is for homes with a HD subscription and Sky also installs a HD box for homes who do not subscribe to HD. This market seeding strategy accounts for the high initial take-up of the Sky Anytime+ service of 800k in the first quarter of launch. Since the service is effectively free, or rather bundled into the Sky TV and Broadband prices, we expect a rapid take up and within a couple of years Sky will have over 4m homes with their main TV connected to the internet.

Virgin Media has chosen TiVo as its exclusive connected set top box provider. The TiVo box is more open than the Sky box with the future promise of allowing independent Flash developers to deploy applications. TiVo is off to a steady start with around 50k homes in the first quarter of 2011. We expect TiVo adoption to be slower than Sky because the need for a new box which is priced at £50 with an ongoing service fee of £3/month. We expect these prices to reduce over time, but still can envisage an uptake of over 2m homes within two to three years assuming effective promotion by Virgin Media.

Another interesting opportunity is the launch of YouView. YouView is expected to come in two flavours, subsidised by CSPs and retail. BT and TalkTalk are shareholders, and are committed to launching YouView boxes by Pace and Huawei respectively in time for the London Olympics in 2012. Humax is committed to launching retail boxes. It is too early to properly forecast demand for YouView as neither the pricing or applications have yet been revealed. However, we struggle to see an installed base of over 1m homes even with the large base of broadband connections that BT and TalkTalk can market the product to.
All the original BT Vision set top boxes were manufactured by Pace (through their purchase of Philips) and need to be connected to BT broadband and therefore the whole of 575k subscribers count as connected TVs. We expect over time for BT to replace these BT Vision boxes with YouView boxes.

The major problem for YouView is that it is a proprietary UK standard whereas other European countries are committing to the hbbTV standard. This places other set top box makers in something of a quandary – will the UK market be large enough to support product development costs? Sony, Technicolour and Cisco have already publically stated that they have no current plans to develop a YouView box.

Other commentators express confidence in the Bluray players to provide the TV connectivity. We are bears of Bluray players and think the market will be niche at best.

Games Consoles

Figure 3 – Gaming Console Household Penetration

Chart of Gaming Consoles per UK Household Fig 3 Telco 2.0

Source: Ofcom residential tracker, w1 2011. Base: All adults 16+ (3,474)

Around half of UK homes contain a games console. The market is dominated by Microsoft, Sony and Nintendo and a growing number of consoles are connected to the internet. Primarily, for online gaming, but also for watching video content either via the internet or through playback of physical media such as DVD or Bluray.

Figure 4 – What UK Consumers use games consoles for

Chart of uses of gaming consoles 2010 Fig 4 Telco 2.0

Source: Ofcom residential tracker, w1 2011. Base: all adults 16+ with access to a games console at home (1,793).

We expect Gaming Consoles to become the most important method for secondary TV sets to connect to the internet, especially in children’s bedrooms. As more and more gaming moves online, we can easily see 75% of gaming consoles regularly connecting to the internet (c. 10m). However, the proportion using the console for regularly viewing video will remain small, perhaps as low as 20%. This will mean that although important Gaming Consoles will be secondary to STB’s for watching video over the internet.

To read the note in full, including additional analysis on…

  • Communications Service Providers (CSPs)
  • BT
  • Sky
  • Virgin Media
  • TalkTalk
  • Others
  • ‘Mainstream’ TV Channels
  • The BBC
  • New Entrants and Online Players
  • LoveFilm
  • Google – YouTube
  • Apple
  • Conclusions

…and the following charts…

  • Figure 1 – Average UK TV Viewing Per Day
  • Figure 2 – Annual UK TV Set Sales by Type 2002-2010
  • Figure 3 – Gaming Console Household Penetration
  • Figure 4 – What UK Consumers use games consoles for
  • Figure 5 – Main UK CSPs – Broadband and TV reach
  • Figure 6 – Take-up of multichannel TV on main sets
  • Figure 7 – Video on demand use in Virgin Media Homes
  • Figure 8 – Total UK TV Revenue by Sector
  • Figure 9 – UK TV Channel shares in all homes 1983-2010
  • Figure 10 – UK Online TV revenues by type of service
  • Figure 11 – Unique audiences to selected online film and TV sites
  • Figure 12 – Unique audiences to selected video-sharing sites
  • Figure 13 – Forecast of Connected TV market by device in 2013
  • Figure 14 – Table summarising strategy and winners/losers by type 19

Members of the Telco 2.0 Executive Briefing Subscription Service can download the full 23 page report in PDF format here. Non-Members, please see here for how to subscribe, here to buy a single user license for £595 (+VAT), or for multi-user licenses and any other enquiries please email contact@telco2.net or call +44 (0) 207 247 5003.

Organisations and products referenced: Amazon, Apple, AppleTV, BBC, BSkyB, BT, BT Vision, Cisco, Flash, Google, Huawei, Humax, ITV, LoveFilm, Microsoft, Motorola, Nintendo, O2, OFCOM, Orange, Pace, Philips, Samsung, Sky, Sky Anytime+, Sky Go, Sony, TalkTalk, Technicolour, TiVo, TV manufacturers, Virgin Media, YouTube, YouView .

Technologies and industry terms referenced: Bluray, catch-up TV, Connected TV, Digital Terrestrial, DVD, DVR, flat screen, free to air, Games Consoles, hbbTV, HD, IPTV, online, PayTV, regulatory relief, replacement cycles, Set Top Box, Tablets, Video, Video on demand (VOD).

Public Wifi: Destroying LTE/Mobile Value?

Summary: By building or acquiring Public WiFi networks for tens of $Ms, highly innovative fixed players in the UK are stealthily removing $Bns of value from 3G and 4G mobile spectrum as smartphone and other data devices become increasingly carrier agnostic. What are the lessons globally?

Below is an extract from this 15 page Telco 2.0 Analyst Note that can be downloaded in full in PDF format by members of the Telco 2.0 Executive Briefing service and Future Networks Stream using the links below.

Read in Full (Members only)        To Subscribe

The mobile broadband landscape is a key session theme at our upcoming ‘New Digital Economics’ Brainstorm (London, 11-13 May). Please use the links or email contact@telco2.net or call +44 (0) 207 247 5003 to find out more.

To share this article easily, please click:

//

Two recent announcements have reignited interest in the UK Public WiFi space: Sky buying The Cloud for a reputed figure just short of £50m and Virgin Media announcing their intention to invest in building a metro WiFi network based around their significant outdoor real estate in the major conurbations.

These can be seen narrowly as competitive reactions to the success of the BT Openzone public WiFi product, which is a clear differentiator for the BT home broadband offer in the eyes of the consumer. The recent resurgence of BT market share in the home broadband market hints that public WiFi is an ingredient valued by consumers, especially when the price is bundled into the home access charges and therefore perceived as “free” by the consumer.

This trend is being accelerated by the new generation of Smartphones sensing whether private and public WiFi access or mobile operator network access offer the best connection for the end-user and then making the authentication process much easier. Furthermore, the case of the mobile operators is not helped by laptops and more importantly tablets and other connected devices such as e-readers offering WiFi as a default means of access with mobile operator 3G requiring extra investment in both equipment and access with a clumsy means of authentication.

In a wider context, the phenomena should be extremely concerning for the UK mobile operators. There has been a two decade trend of voice traffic inside the home moving from fixed to mobile networks with a clear revenue gain for the mobile operators. In the data world, it appears that the bulk of the heavy lifting appears to being served within the home by private WiFi and outside of the home in nomadic spots served by public WiFi.

With most of the public WiFi hotspots in the UK being offered by fixed operators, there is a potential value shift from mobile to fixed networks reversing that two decade trend. As the hotspots grow and critically, once they become interconnected, there is an increasing risk to mobile operators in terms of the value of investment in expensive ‘4G’ / LTE spectrum.

Beyond this, a major problem for mobile operators is that the current trend for multi-mode networking (i.e. combination of WiFi and 3G access) limits the ability of operators to provide VAS services and/or capture 2-sided business model revenues, since so much activity is off-network and outside of the operator’s control plane.

The history of WiFi presents reality lessons for Mobile Operators, namely:

  • With Innovation, it not always the innovators who gain the most;
  • Similarly, with Standards setting, it not always the people who set the standards who gain the most; and
  • WiFi is a classic case of Apple driving mass adoption and reaping the benefits – to this day, Apple still seems to prefer WiFi over 3G.

This analyst note explains the flurry of recent announcements in the context of:

  • The unique UK market structure;
  • Technology Adoption Cycles;
  • How intelligence at the edge of the network will drive both private and public WiFi use;
  • How public WiFi in the UK might evolve;
  • The longer term value threat to the mobile operators;
  • How O2 and Vodafone are taking different strategies to fight back; and
  • Lessons for other markets.

Unique Nature of the UK Market Structure

In May 2002, BT Cellnet, the mobile arm of BT, soon to be renamed O2, demerged from BT leaving the UK market as one of few markets in the world where the incumbent PTT did not have a mobile arm. Ever since BT has tried to get into the mobility game with varying degrees of success:

  • In the summer of 2002, it launched its public WiFi service called OpenZone;
  • In September 2003 it announced plans for WiFi in all public phone boxes ;
  • In May 2004, it launched an MVNO with Vodafone with plans for the doomed BT Fusion UMA (Bluetooth then WiFi ) phone;
  • In May 2006, with Metro WiFi plans in partnership with local authorities in 12 cities; and
  • In Oct 2007, in partnership with FON to put public WiFi in each and every BT home routers.

After trying out different angles in the mobility business for five years, BT finally discovered a workable business model with public WiFi around the FON partnership. BT now effectively bundle free public WiFi to its broadband users in return for establishing a public hotspot within their own home.

Huge Growth in UK Public Wifi Usage

Approximately 2.6m or 47% customers of a total of 5.5m BT broadband connections have taken this option. This creates the image of huge public WiFi coverage and clearly currently differentiates BT from other home broadband providers. And, the public WiFi network is being used much more: 881 million minutes in the current quarter compared to 335 million minutes in the previous year.

The other significant element of the BT public WiFi network is the public hotspots they have built with hotels, restaurants, airports. The hotspots number around 5k, of which 1.2k are wholesale arrangements with other public WiFi hotspot providers. While not significant in number, these provide the real incremental value to the BT home broadband user who can connect for “free” in these high traffic locations.

BT was not alone in trying to build a public WiFi business. The Cloud was launched in the UK in 2003 and tried to build a more traditional public WiFi business building upon a combination of direct end user revenues and wholesale and interconnect arrangements. That Sky are paying “south of £50m” for The Cloud compared to the “€50m invested” over the years by the VC backers implies the traditional public WiFi business model just doesn’t work. A different strategy will be taken by Sky going forward.

Sky is the largest pay-tv provider in the UK currently serving approximately 10m homes by satellite DTH. In 2005, Sky decided upon a change of strategy and decided that in addition to offering its customers video services, they needed to offer broadband and phone services. Sky has subsequently invested approximately £1bn in buying an altnet, Easynet, for £211m, in building a LLU network on top of BT infrastructure and acquiring 3m broadband customers. If the past is anything to go by, Sky will be planning on investing considerable further sums in The Cloud to make it at a minimum a comparable service to BT Openzone for its customers.

Virgin Media is the only cable operator of any significance in the UK with a footprint of around 50% of the UK mainly in the dense conurbations. Virgin Media is the child of many years of cable consolidation and historically suffered from disparate metro cable networks of varying quality and an overleveraged balance sheet. The present management has a done a good job of tidying up the mess and upgrading the networks to DOCSIS 3.0 technology. In the last year, Virgin Media has started to expand its footprint again and investing in new products with plans for building a metro WiFi network based around its large footprint of cabinets in the street.

Virgin Media has a large base of 4.3m home broadband users to protect and an even larger base of potential homes to sell services into. In addition, Virgin Media is the largest MVNO in the UK with around 3m mobile subscribers. In recent years, Virgin Media have focused upon selling mobile services into their current cable customers. Although, Virgin Media’s public WiFi strategy is not in the public domain, it is clear that they plan on investing in 2011.

TalkTalk is the only other significant UK Home Broadband player with 4.2m home broadband users and currently has no declared public WiFi strategies.

The mobile operators which have invested in broadband, namely O2 and Orange, have failed to gain traction in the marketplace.

The key trend here is that the fixed broadband network providers are moving outside of the home and providing more value to their customers on the move.

Technology Adoption Cycles

Figure 1: Geoffrey Moore’s Technology Adoption Cycle

Geoffrey Moore documented technology adoption cycles, originally in the “Crossing the Chasm” book and subsequently in the “Living in the Fault Line” book. These books described the pain in products crossing over from early adopters to the mass market. Since publication, they have established themselves as the bible for a generation of Technology marketers. Moore distinguishes six zones, which are adopted to describe the situation of public WiFi in the UK.

  1. The early market: a time of great excitement when visionaries are looking to get on board. In the public WiFi market this period was clearly established in mid-2005 era when public WiFi networks where promoted as real alternatives to private MNOs.
  2. The chasm: a time of great despair as initial interest wanes and the mainstream is not comfortable with adoption. The UK WiFi market has been stagnating for the previous few years as investment in public WiFi has declined and customer adoption has not accelerated beyond the techno-savvy.
  3. The bowling alley: a period of niche adoption ahead of the general marketplace. The UK market is currently in this period. The two key skittles to fall were the BT FON deal changing the public WiFi business model, and the launch of the iPhone with auto-sensing and easy authentication of public WiFi.
  4. The tornado: a period of mass-market adoption. The UK market is about to enter in this phase as public WiFi investment is reinvigorated deploying providing “bundled” access to most home broadband users.
  5. Main street: Base infrastructure has been deployed and the goal is to flesh out the potential. We are probably a few years away from this and this phase will focus on ease-of-use, interconnect of public WiFi networks, consolidation of smaller players and alternate revenue sources such as advertising.
  6. Total Assimilation: Everyone is using the technology and the market is ripe for another wave of disruption. For UK WiFi, this is probably at least a decade away, but who know what the future holds?

Flashback: How Private WiFi crossed the Chasm

It is worthwhile at this point to revisit the history of WiFi as it provides some perspective and pointers for the future, especially who the winners and losers will be in the public WiFi space.

Back in 1985 when deregulation was still in fashion, the USA FCC opened up some spectrum to provide an innovation spurt to US industry under a license exempt and “free-to-use” regime. This was remarkable in itself given that previously spectrum, whether for radio and television broadcasting or public and private communications, had been exclusively licensed. Any applications in the so-called ISM (Industrial, Scientific and Medical) bands would have to deal with contention from other applications using the spectrum and therefore the primary use was seen as indoor and corporate applications.

Retail department stores, one of the main clients of NCR (National Cash Registers), tended to reconfigure their floor space on a regular basis and the cost of continual rewiring of point-of-sales equipment was a significant expense. NCR saw an opportunity to use the ISM bands to solve this problem and started a R&D project in the Netherlands to create wireless local area networks which required no cabling.

At this time, the IEEE were leading the standardization effort for local area networks and the 802.3 Ethernet specification initially approved in 1987 still forms the basis of the most wired LAN implementations today. NCR decided that the standards road was the route to take and played a leading role in the eventual creation of 802.11 wireless LAN standards in 1997. Wireless LAN was considered too much of a mouthful and was reinvented as WiFi in 1999 with the help of a branding agency.

Ahead of the standards approval, NCR launched products under the WaveLAN brand in 1990 but the cost of the plug-in cards at US$1,400 were very expensive compared to the wired ethernet cards which were priced at around US$400. Product take-up was slow outside of early adopters.

In 1991 an early form of Telco-IT convergence emerged as AT&T bought NCR. An early competitor for the ISM bandwidth emerged with AT&T developing a new generation of digital cordless phones using the 2.4GHz band. To this day, in the majority of UK and worldwide households, DECT handsets in the home compete with WiFi for spectrum. Product development of the cards continued and was made consumer friendly easier with the adoption on the PCMIA card slots in PCs.

By 1997, WiFi technology was firmly stuck in the chasm. The major card vendors (Proxim, Aironet, Xircom and AT&T) all had non-standardized products and the vendors were at best marginally profitable struggling to grow the market.
AT&T had broken up and the WiFi business became part of Lucent Technologies. The eyes and brains of the big communications companies (Alcatel, Ericsson, Lucent, Motorola, Nokia, Nortel and Siemens) were focused on network solutions with 3G holding the promise for the future.

All that was about to change in early 1998 with a meeting between Steve Jobs of Apple and Richard McGinn, CEO of Lucent:

  • Steve Jobs declared “Wireless LANs are the greatest thing on earth, Apple wants a radio card for US$50, which Apple will retail at US$99”;
  • Rich McGinn declared 1999 to be the year of DSL and asked if Apple would be ready; and
  • Steve Jobs retort was revealing to this day “Probably not next, maybe the year after; depends upon whether there is one standard worldwide”.

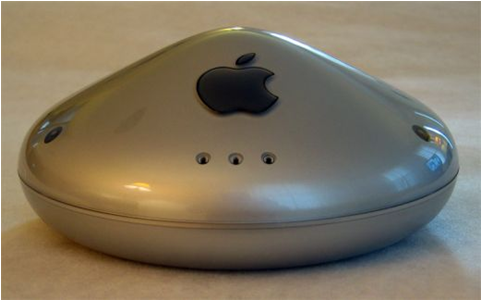
Figure 2: The Apple Airport

In early 1998 the cost of the cards was still above US$100 and needed a new generation of chips to bring the cost down to the Apple price point. Further, Apple wanted to use the 11Mbit/s standard which had just been developed rather than the current 2Mbit/s. However, despite the challenges the product was launched in July 1999 as the Apple Airport with the PCMCIA card at US$99 and the access point at US$299. Apple was the first skittle to fall as private WiFi crossed the chasm. The Windows based OEMs rushed to follow.

By 2001, Lucent had spun out its chip making arm as Agere Systems which had a market share of 50% of a US$1bn WiFi market, which would have been nothing but a pin prick on either the AT&T or Lucent profit and loss had Agere remained as part of them.

The final piece in the WiFi jigsaw fell into place when Intel acquired Xircom in 1999 and developed the Xircom technology and used their WiFi patents as protection against competitors. In 2003, Intel launched its Centrino chipset with built in WiFi functionality for laptops supported by a US$300m worldwide marketing campaign. Effectively for the consumer WiFi had become part the laptop bundle.

Agere Systems and all its WiFi heritage was finished and they discontinued its WiFi activities in 2004.

There are three clear pointers for the future:

  • The players who take a leading role in the early market will not necessary be the ones to succeed in Main Street;
  • Apple took a leading role in the adoption of WiFi and still seems massively committed to WiFi technology to this day;
  • Technology adoption cycles tend to be longer than expected.

Intelligence at the edge of the Network

As early as 2003, Broadcom and Phillips were launching specialized WiFi chips aimed at mobile phones. Several cellular handsets were launched with WiFi combined with 2G/3G connectivity, but the connectivity software was clunky for the user.

The launch of the iPhone in 2007 began a new era where the device automatically attempts to connect to any WiFi network if the signal strength is better than the 2G/3G network. The era of the home or work WiFi network being the preferred route for data traffic was ushered in.

Apple is trying to make authentication as simple as possible: enter the key for any WiFi network once and it will be remembered for the handset’s lifetime and connect automatically when a user returns in range. However, in dense urban networks with multiple WiFi access points, it is quite annoying to be prompted for key after key. The strength of the federated authentication system in cellular networks is therefore still a critical advantage.

The iPhone also senses that some applications can only be used when WiFi connections are available. The classic example is Apple’s own Facetime (video calling) application. Mobile Operators seem happy in the short run that bandwidth intensive applications are kept off their networks. But, there is a longer term value statement with the users being continually being reminded that WiFi networks are superior to mobile operators’ networks.

Other mobile operating systems, such as Android and Windows Phone 7, have copied the Apple approach and today there is no going back: multi-modal mobile phones are here to stay and the devices themselves decide which network to use unless the user over-rides this choice.

One of underlying rules of the internet is that intelligence moves to the edge of the network. The edges are probably in the eyes of Apple and Google the handsets and their server farms. It is not beyond the realms of possibility that future Smartphones will be supplied with automatic authentication for both WiFi and Cellular networks with least-cost routing software determining the best price for the user. As intelligence moves to the edge so does value.

Public WiFi Hotspots – the Business Model challenges

The JiWire directory estimates that there are c. 414k public WiFi locations across the globe at the end of 2010, and there are WiFi hotspots currently located 26.5k in the UK. Across the globe, there is a shift from a paid-for model to a free-model with the USA being top of the free chart with 54% of public WiFi locations being free.

For a café chain offering free access to WiFi is a good model to follow. The theory is that people will make extra visits to buy a coffee just to check their email or some other light internet visit. Starbucks started the trend by offering free WiFi access, all the rest felt compelled to follow. Nowadays, all the major chains whether Costa Coffee, Café Nero and even McDonalds offer free WiFi access provided by either BT Openzone or Sky’s The Cloud. A partnership with a public WiFi provider is perfect as the café chain doesn’t have to provide complicated networking support or regulatory compliance. The costs for the public WiFi provider are relativity small especially if they are amortized across a large base of broadband users.

For hotels and resorts, the business case is more difficult as most hotels are quite large and multiple access points are required to provide decent coverage to all rooms. Furthermore, hotels traditionally have made additional revenues from most services and therefore complexity is added with billing systems. For most hotels and resorts a revenue share agreement is negotiated with the WiFi service provider.

For public places, such as airports and train stations, the business case is also complicated by the owners knowing these sites are high in footfall and therefore demand a premium for any activity whether retail or service based. It is a similar problem that mobile operators face when trying to provide coverage in major locations: access to prime locations is expensive. In the UK, the entry of Sky into the public WiFi and its long association with Sports brings an intriguing possible partnership with the UK’s major venues.

These three types of locations currently account for 75% of current public WiFi usage according to JiWire.

To read the rest of the article, including:

  • How will UK Public WiFi Evolve?
  • Challenge to Mobile Operators
  • O2 Tries an Alternative
  • Vodafone Goes with Femtos
  • Lessons for Other Markets

Members of the Telco 2.0TM Executive Briefing Subscription Service and Future Networks Stream can access and download a PDF of the full report here. Non-Members, please see here for how to subscribe. Alternatively, please email contact@telco2.net or call +44 (0) 207 247 5003 for further details. ‘Growing the Mobile Internet’ and ‘Lessons from Apple: Fostering vibrant content ecosystems’ are also featured at our AMERICAS and EMEA Executive Brainstorms and Best Practice Live! virtual events.