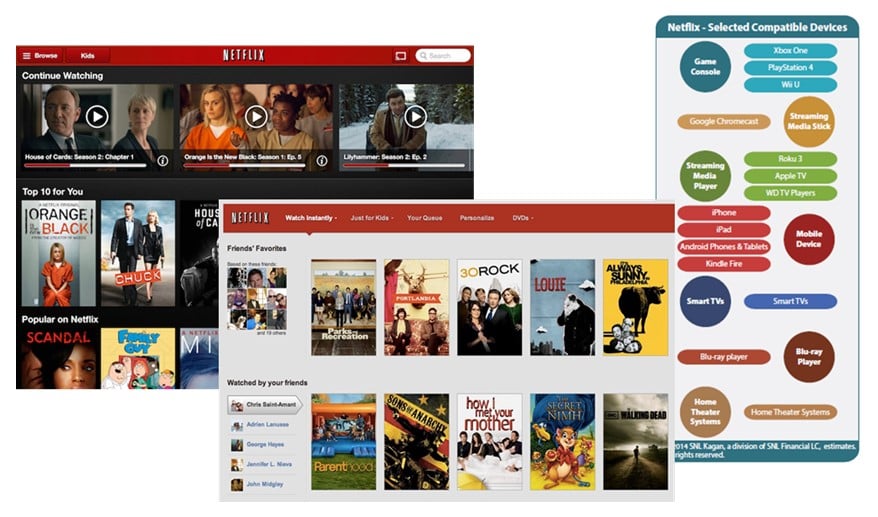
Consumer strategy: What should telcos do?

Globally, telcos are pursuing a wide variety of strategies in the consumer market, ranging from broad competition with the major Internet platforms to a narrow focus on delivering connectivity.

Some telcos, such as Orange France, Telefónica Spain, Reliance Jio and Rakuten Mobile, are combining connectivity with an array of services, such as messaging, entertainment, smart home, financial services and digital health propositions. Others, such as Three UK, focus almost entirely on delivering connectivity, while many sit somewhere in between, targeting a single vertical market, in addition to connectivity. AT&T is entertainment-orientated, while Safaricom is financial services-focused.

This report analyses the consumer strategies of the leading telcos in the UK and the Brazil – two very different markets. Whereas the UK is a densely populated, English-speaking country, Brazil has a highly-dispersed population that speaks Portuguese, making the barriers to entry higher for multinational telecoms and content companies.

By examining these two telecoms markets in detail, this report will consider which of these strategies is working, looking, in particular, at whether a halfway-house approach can be successful, given the economies of scope available to companies, such as Amazon and Google, that offer consumers a broad range of digital services. It also considers whether telcos need to be vertically-integrated in the consumer market to be successful. Or can they rely heavily on partnerships with third-parties? Do they need their own distinctive service layer developed in-house?

In light of the behavourial changes brought about by the pandemic, the report also considers whether telcos should be revamping their consumer propositions so that they are more focused on the provision of ultra-reliable connectivity, so people can be sure to work from home productively. Is residential connectivity really a commodity or can telcos now charge a premium for services that ensure a home office is reliably and securely connected throughout the day?

A future STL Partners report will explore telcos’ new working from home propositions in further detail.

Enter your details below to request an extract of the report

The UK market: Convergence is king

The UK is one of the most developed and competitive telecoms markets in the world. It has a high population density, with 84% of its 66 million people living in urban areas, according to the CIA Factbook. There are almost 272 people for every square kilometre, compared with an average of 103 across Europe. For every 100 people, there are 48 fixed lines and 41 broadband connections, while the vast majority of adults have a mobile phone. GDP per capita (on a purchasing power parity basis) is US$ 48,710, compared with US$ 65,118 in the US (according to the World Bank).

The strength of the state-funded public service broadcaster, the BBC, has made it harder for private sector players to make money in the content market. The BBC delivers a large amount of high-quality advertising-free content to anyone in the UK who pays the annual license fee, which is compulsory to watch television.

In the UK, the leading telcos have mostly eschewed expansion into the broader digital services market. That reflects the strong position of the leading global Internet platforms in the UK, as well as the quality of free-to-air television, and the highly competitive nature of the UK telecoms market – UK operators have relatively low margins, giving them little leeway to invest in the development of other digital services.

Figure 1 summarises where the five main network operators (and broadband/TV provider Sky) are positioned on a matrix mapping degree of vertical integration against the breadth of the proposition.

Most UK telcos have focused on the provision of connectivity

UK telco B2C strategies

Source: STL Partners

Brazil: Land of new opportunities

Almost as large as the US, Brazil has a population density is just 25 people per square kilometre – one tenth of the total UK average population density. Although 87% of Brazil’s 212 million people live in urban areas, according to the CIA Fact book, that means almost 28 million people are spread across the country’s rural communities.

By European standards, Brazil’s fixed-line infrastructure is relatively sparse. For every 100 people, Brazil has 16 fixed lines, 15 fixed broadband connections and 99 mobile connections. Its GDP per capita (on a purchasing power parity basis) is US$ 15,259 – about one third of that in the UK. About 70% of adults had a bank account in 2017, according to the latest World Bank data. However, only 58% of the adult population were actively using the account.

A vast middle-income country, Brazil has a very different telecoms market to that of the UK. In particular, network coverage and quality continue to be important purchasing criteria for consumers in many parts of the country. As a result, Oi, one of the four main network operators, became uncompetitive and entered a bankruptcy restructuring process in 2016. It is now hoping to to sell its sub-scale mobile unit for at least 15 billion reais (US$ 2.8 billion) to refocus the company on its fibre network. The other three major telcos, Vivo (part of Telefónica), Claro (part of América Móvil) and TIM Brazil, have made a joint bid to buy its mobile assets.

For this trio, opportunities may be opening up. They could, for example, play a key role in making financial services available across Brazil’s sprawling landmass, much of which is still served by inadequate road and rail infrastructure. If they can help Brazil’s increasingly cash-strapped consumers to save time and money, they will likely prosper. Even before COVID-19 struck, Brazil was struggling with the fall-out from an early economic crisis.

At the same time, Brazil’s home entertainment market is in a major state of flux. Demand for pay television, in particular, is falling away, as consumers seek out cheaper Internet-based streaming options.

All of Brazil’s major telcos are building a broad consumer play

Brazil telco consumer market strategy overview

Source: STL Partners

Table of contents

  • Executive Summary
  • Introduction
    • The UK market: Convergence is king
    • BT: Trying to be broad and deep
    • Virgin Media: An aggregation play
    • O2 UK: Changing course again
    • Vodafone: A belated convergence play
    • Three UK: Small and focused
    • Takeaways from the UK market: Triple play gridlock
  • Brazil: Land of new opportunities
    • The Brazilian mobile market
    • The Brazilian fixed-line market
    • The Brazilian pay TV market
    • The travails of Oi
    • Vivo: Playing catch-up in fibre
    • Telefónica’s financial performance
    • América Móvil goes broad in Brazil
    • TIM: Small, but perfectly formed?
    • Takeaways from the Brazilian market: A potentially treacherous transition
  • Index

Enter your details below to request an extract of the report

Apple Glass: An iPhone moment for 5G?

Augmented reality supports many use cases across industries

Revisiting the themes explored in the AR/VR: Won’t move the 5G needle report STL Partners published in January 2018, this report explores whether augmented reality (AR) could become a catalyst for widespread adoption of 5G, as leading chip supplier Qualcomm and some telcos hope.

It considers how this technology is developing, its relationship with virtual reality (VR), and the implications for telcos trying to find compelling reasons for customers to use low latency 5G networks.

This report draws the following distinction between VR and AR

  • Virtual reality: use of an enclosed headset for total immersion in a digital3D
  • Augmented reality: superimposition of digital graphics onto images of the real world via a camera viewfinder, a pair of glasses or onto a screen fixed in real world.

In other words, AR is used both indoors and outdoors and on a variety of devices. Whereas Wi-Fi/fibre connectivity will be the preferred connectivity option in many scenarios, 5G will be required in locations lacking high-speed Wi-Fi coverage.  Many AR applications rely on responsive connectivity to enable them to interact with the real world. To be compelling, animated images superimposed on those of the real world need to change in a way that is consistent with changes in the real world and changes in the viewing angle.

AR can be used to create innovative games, such as the 2016 phenomena Pokemon Go, and educational and informational tools, such as travel guides that give you information about the monument you are looking at.  At live sports events, spectators could use AR software to identify players, see how fast they are running, check their heart rates and call up their career statistics.

Note, an advanced form of AR is sometimes referred to as mixed reality or extended reality (XR). In this case, fully interactive digital 3D objects are superimposed on the real world, effectively mixing virtual objects and people with physical objects and people into a seamless interactive scene. For example, an advanced telepresence service could project a live hologram of the person you are talking to into the same room as you. Note, this could be an avatar representing the person or, where the connectivity allows, an actual 3D video stream of the actual person.

Widespread usage of AR services will be a hallmark of the Coordination Age, in the sense that they will bring valuable information to people as and when they need it. First responders, for example, could use smart glasses to help work their way through smoke inside a building, while police officers could be immediately fed information about the owner of a car registration plate. Office workers may use smart glasses to live stream a hologram of a colleague from the other side of the world or a 3D model of a new product or building.

In the home, both AR and VR could be used to generate new entertainment experiences, ranging from highly immersive games to live holograms of sports events or music concerts. Some people may even use these services as a form of escapism, virtually inhabiting alternative realities for several hours a day.

Given sufficient time to develop, STL Partners believes mixed-reality services will ultimately become widely adopted in the developed world. They will become a valuable aid to everyday living, providing the user with information about whatever they are looking at, either on a transparent screen on a pair of glasses or through a wireless earpiece. If you had a device that could give you notifications, such as an alert about a fast approaching car or a delay to your train, in your ear or eyeline, why wouldn’t you want to use it?

How different AR applications affect mobile networks

One of the key questions for the telecoms industry is how many of these applications will require very low latency, high-speed connectivity. The transmission of high-definition holographic images from one place to another in real time could place enormous demands on telecoms networks, opening up opportunities for telcos to earn additional revenues by providing dedicated/managed connectivity at a premium price. But many AR applications, such as displaying reviews of the restaurant a consumer is looking at, are unlikely to generate much data traffic. the figure below lists some potential AR use cases and indicates how demanding they will be to support.

Examples of AR use cases and the demands they make on connectivity


Source: STL Partners

Although telcos have always struggled to convince people to pay a premium for premium connectivity, some of the most advanced AR applications may be sufficiently compelling to bring about this kind of behavioural shift, just as people are prepared to pay more for a better seat at the theatre or in a sports stadium. This could be on a pay-as-you-go or a subscription basis.

Enter your details below to request an extract of the report

The pioneers of augmented reality

Augmented reality (AR) is essentially a catch-all term for any application that seeks to overlay digital information and images on the real-world. Applications of AR can range from a simple digital label to a live 3D holographic projection of a person or event.

AR really rose to prominence at the start of the last decade with the launch of smartphone apps, such as Layar, Junaio, and Wikitude, which gave you information about what you were looking at through the smartphone viewfinder. These apps drew on data from the handset’s GPS chip, its compass and, in some cases, image recognition software to try and figure out what was being displayed in the viewfinder. Although they attracted a lot of media attention, these apps were too clunky to break through into the mass-market. However, the underlying concept persists – the reasonably popular Google Lens app enables people to identify a product, plant or animal they are looking at or translate a menu into their own language.

Perhaps the most high profile AR application to date is Niantic’s Pokemon Go, a smartphone game that superimposes cartoon monsters on images of the real world captured by the user’s smartphone camera. Pokemon Go generated $1 billion in revenue globally just seven months after its release in mid 2016, faster than any other mobile game, according to App Annie. It has also shown remarkable staying power. Four years later, in May 2020, Pokemon Go continued to be one of the top 10 grossing games worldwide, according to SensorTower.

In November 2017, Niantic, which has also had another major AR hit with sci-fi game Ingress, raised $200 million to boost its AR efforts. In 2019, it released another AR game based on the Harry Potter franchise.

Niantic is now looking to use its AR expertise to create a new kind of marketing platform. The idea is that brands will be able to post digital adverts and content in real-world locations, essentially creating digital billboards that are viewable to consumers using the Niantic platform. At the online AWE event in May 2020, Niantic executives claimed “AR gamification and location-based context” can help businesses increase their reach, boost user sentiment, and drive foot traffic to bricks-and-mortar stores. Niantic says it is working with major brands, such as AT&T, Simon Malls, Starbucks, Mcdonalds, and Samsung, to develop AR marketing that “is non-intrusive, organic, and engaging.”

The sustained success of Pokemon Go has made an impression on the major Internet platforms. By 2018, the immediate focus of both Apple and Google had clearly shifted from VR to AR. Apple CEO Tim Cook has been particularly vocal about the potential of AR. And he continues to sing the praises of the technology in public.

In January 2020, for example, during a visit to Ireland, Cook described augmented reality as the “next big thing.”  In an earnings call later that month, Cook added:When you look at AR today, you would see that there are consumer applications, there are enterprise applications. … it’s going to pervade your life…, because it’s going to go across both business and your whole life. And I think these things will happen in parallel.”

Both Apple and Google have released AR developer tools, helping AR apps to proliferate in both Apple’s App Store and on Google Play.  One of the most popular early use cases for AR is to check how potential new furniture would look inside a living room or a bedroom. Furniture stores and home design companies, such as Ikea, Wayfair and Houzz, have launched their own AR apps using Apple’s ARKit. Once the app is familiar with its surroundings, it allows the user to overlay digital models of furniture anywhere in a room to see how it will fit. The technology can work in outdoor spaces as well.

In a similar vein, there are various AR apps, such as MeasureKit, that allow you to measure any object of your choosing. After the user picks a starting point with a screen tap, a straight line will measure the length until a second tap marks the end. MeasureKit also claims to be able to calculate trajectory distances of moving objects, angle degrees, the square footage of a three-dimensional cube and a person’s height.

Table of contents

  • Executive Summary
    • More mainstream models from late 2022
    • Implications and opportunities for telcos
  • Introduction
  • Progress and Immediate Prospects
    • The pioneers of augmented reality
    • Impact of the pandemic
    • Snap – seeing the world differently
    • Facebook – the keeper of the VR flame
    • Google – the leader in image recognition
    • Apple – patiently playing the long game
    • Microsoft – expensive offerings for the enterprise
    • Amazon – teaming up with telcos to enable AR/VR
    • Market forecasts being revised down
  • Telcos Get Active in AR
    • South Korea’s telcos keep trying
    • The global picture
  • What comes next?
    • Live 3D holograms of events
    • Enhancing live venues with holograms
    • 4K HD – Simple, but effective
  • Technical requirements
    • Extreme image processing
    • An array of sensors and cameras
    • Artificial intelligence plays a role
    • Bandwidth and latency
    • Costs: energy, weight and financial
  • Timelines for Better VR and AR
    • When might mass-market models become available?
    • Implications for telcos
    • Opportunities for telcos
  • Appendix: Societal Challenges
    • AR: Is it acceptable in a public place?
    • VR: health issues
    • VR and AR: moral and ethical challenges
    • AR and VR: What do consumers really want?
  • Index

Enter your details below to request an extract of the report

Can Netflix and Spotify make the leap to the top tier?

Introduction

This is the first of two reports analysing the market position and strategies of four global technology companies – Netflix, Spotify, Tesla and Uber – that might be able to make the leap to become a top tier consumer digital player, akin to Amazon, Apple, Facebook or Google. The two reports explore how improvements in digital technologies and consumer electronics are changing the entertainment and automotive markets, allowing the four companies to cause significant disruption in their sectors.

The first part of this report considers Netflix and Spotify, which are both trying to disrupt the entertainment market. For more on the increasing domination of online entertainment by the big Internet platforms, read the STL Partners report Amazon, Apple, Facebook, Google, Netflix: Whose digital content is king?

This report considers how well Netflix and Spotify are prepared for the likely technological changes in their markets. It also provides a high-level overview of the opportunities for telcos, including partnership strategies, and the implications for telcos if one of the companies were able to make the jump to become a tier one platform.

Enter your details below to request an extract of the report

var MostRecentReportExtractAccess = “Most_Recent_Report_Extract_Access”;
var AllReportExtractAccess = “All_Report_Extract_Access”;
var formUrl = “https://go.stlpartners.com/l/859343/2022-02-16/dg485”;
var title = encodeURI(document.title);
var pageURL = encodeURI(document.location.href);
document.write(‘‘);

STL Partners is analysing the prospects of Netflix, Spotify, Tesla and Uber because all four have proven to be highly disruptive players in their relevant industries.

The four are defined by three key factors, which set them aside from their fellow challengers:

  • Rapid rise: They have become major mainstream players in a short space of time, building world-leading brands that rival those of much older and more established companies.
  • New thinking: Each of the four has challenged the conventions of the industries in which they operate, leading to major disruption and forcing incumbents to completely re-evaluate their business models.
  • Potential to challenge the dominance of Amazon, Apple, Facebook or Google: This rapid success has allowed the companies to gain dominant positions in their relative sectors, which they have used as a springboard to diversify their business models into parallel verticals. By pursuing these economies of scope, they are treading the path taken by the big four Internet companies (see Figure 1). Google, Apple, Facebook and Amazon have come from very diverse roots (ranging from an Internet search engine to a mobile device manufacturer), but are now directly competing with each other in a number of areas (communications, content, commerce and hardware).

Figure 1: How the leading Internet companies have diversified

Source: STL Partners

The evolution of online entertainment

As broadband networks proliferate and households are served by fatter pipes, telecoms networks are carrying more and more entertainment content. While there are major players in every country and region, there are essentially only six online entertainment platforms meeting this demand on a global scale – Amazon, Apple, Facebook, Google, Netflix and Spotify. These six companies are delivering increasingly sophisticated real-time entertainment services that are generating a growing proportion of Internet traffic, at the expense of traditional web browsing, file sharing, download services and physical retail entertainment.

The six are building global economies of scale that can’t be matched by national/regional media companies and telcos. Global distribution is becoming increasingly important in the media industry, given the prohibitive costs of sourcing content and then packaging it and distributing it across multiple different devices and networks.

Scale is also important for another reason. As the volume of digital content proliferates, consumers increasingly rely on recommendations. The platform capturing the most behavioural data (people who watched this, also watched this) should be able to offer the best recommendations.

Although the platforms with scale have a competitive advantage, they are still vulnerable to disruption because the online entertainment market is evolving rapidly with providers, including rights owners, experimenting with new formats and concepts.

As outlined in the STL Partners report Amazon, Apple, Facebook, Google, Netflix: Whose digital content is king?, most of this experimentation relates to the following six key trends, which are likely to shape the online entertainment market over the next decade.

  1. Greater investment in exclusive content: The major online platforms are increasingly looking to either source or develop their own exclusive content, both as a competitive differentiator and in response to the rising cost of licensing third parties’ content. Exclusive content may be anything from live sports programming to original drama series and even blockbuster movies. This is an area in which both Netflix and Amazon Video have heavily invested, making the two direct competitors for talent in this space.
  2. Growing support for live programming: People like to watch major sports events and dramatic breaking news live. Some of the online platforms are responding to this demand by creating live channels and giving celebrities and consumers the tools they need to peercast – broadcast their own live video streams.
  3. The changing face of user-generated content: Although YouTube, Facebook and other social networks have always relied on user-generated content, advances in digital technologies are making this content more compelling. If they are in the right place, at the right time, even an amateur equipped with a smartphone or a drone can produce engaging video pictures.
  4. Increasingly immersive games and interactive videos: As bandwidth, latency, graphics processing and rendering technology all improve, online games are becoming more photorealistic making them increasingly akin to an interactive movie. Furthermore, virtual reality will enable people to adopt different viewpoints within a 360-degree video stream, enabling them to choose the perspective from which to watch a movie or a live sports event. For more info, please see the STL Partners’ report: AR/VR: Won’t move the 5G needle.
  5. Rising use of ad blockers and mounting privacy concerns: Many consumers are looking for ways to avoid video advertising, which is more intrusive than a static banner ad and uses more bandwidth. At the same time, many national and regional regulators are becoming increasingly alarmed by the privacy implications of the data mining of consumer services and products, leading to clashes between the major online advertising platforms and regulators.
  6. Ongoing net neutrality uncertainty: In many jurisdictions, net neutrality regulation is either still under development or is vaguely worded as regulators struggle to balance the legitimate need to prioritise some online services with the equally important need to ensure that small content and app developers aren’t discriminated against.

To read on about Netflix and Spotify’s strategies and implications for telcos, please login and download the report, or contact us to subscribe.

Contents:

  • Executive Summary
  • Netflix: much loved, but too narrow
  • Spotify: leading a formidable pack
  • Lessons for telcos
  • Conclusions for telcos
  • Introduction
  • The evolution of online entertainment
  • Netflix: Keeping it original
  • Right time, right proposition
  • Competitive clouds gathering
  • Economies of scale, but not scope
  • Strengths
  • Weaknesses
  • Opportunities
  • Threats
  • Spotify: The power of the playlist
  • Smaller than Netflix, but more rounded
  • Strengths
  • Weaknesses
  • Opportunities
  • Threats
  • Takeaways for telcos
  • Lessons for telcos
  • Next steps for telcos

Figures:

  • Figure 1: How the leading Internet companies have diversified
  • Figure 2: Netflix revenue and paid subscriber growth, 2015-2017
  • Figure 3: Netflix has grown much faster than its rivals in the US
  • Figure 5: Netflix from a monolithic website to a flexible microservices architecture
  • Figure 6: Netflix: SWOT analysis
  • Figure 7: Tailoring movie artwork to the individual viewer
  • Figure 8: Netflix’s addressable market is growing steadily
  • Figure 9: The number of mobile broadband connections is rising rapidly
  • Figure 10: How studio films aim to make money using release windows
  • Figure 11: Hulu’s broad proposition is a challenge to Netflix
  • Figure 12: Growth in digital music is now offsetting declining sales of physical formats
  • Figure 13: Spotify’s rapid revenue and paid subscriber growth
  • Figure 14: Spotify’s fast-growing premium service is the profit engine
  • Figure 15: A SWOT analysis for Spotify
  • Figure 16: Spotify has significantly lower ARPU and costs than Netflix
  • Figure 17: Spotify’s losses continue to grow despite rapid revenue rises
  • Figure 18: Spotify’s costs are rising rapidly
  • Figure 19: YouTube is a major destination for music lovers

Enter your details below to request an extract of the report

var MostRecentReportExtractAccess = “Most_Recent_Report_Extract_Access”;
var AllReportExtractAccess = “All_Report_Extract_Access”;
var formUrl = “https://go.stlpartners.com/l/859343/2022-02-16/dg485”;
var title = encodeURI(document.title);
var pageURL = encodeURI(document.location.href);
document.write(‘‘);

Music Lessons: How the music industry rediscovered its mojo

Introduction

The latest report in STL Partners’ Dealing with Disruption stream, this paper explores what telcos and their partners can learn from the music industry and its response to disruptive forces unleashed by the Internet.

Music was among the first industries to see its core product (compact discs) completely undermined by the Internet’s emergence as the primary distribution mechanism for content and software, throwing the record labels into a long standing struggle to maintain both relevance and revenues. After almost two decades of decline, sales of recorded music are growing again and, in developed markets, at least, the existential threat posed by piracy seems to have abated. Although the music industry still has problems aplenty, the success of streaming services has steadied the ship.

This report outlines how the music industry has regained its mojo, before considering the lessons for telcos and other digital service providers. The first section of the paper considers why music streaming has become so successful and whether the model will be sustainable. The second section of the paper explores the lessons companies from other sectors, notably telecoms, can draw from the ways in which the music industry responded to the Internet’s disruptive forces.

This paper builds on other entertainment-related reports published by STL Partners, including:

Apple’s pivot to services: What it means for telcos
Telco-Driven Disruption: Will AT&T, Axiata, Reliance Jio and Turkcell succeed?
Amazon: Telcos’ Chameleon-King Ally?
Can Telcos Entertain You? Vodafone and MTN’s Emerging Market Strategies (Part 2)
Can Telcos Entertain You? (Part 1)

Music bounces back

Over the past 20 years, the rise of the Internet has shaken the music industry to the core, obsolescing its distribution model, undermining its business model and enabling new forms of piracy. Yet, the major record labels have survived, albeit in a consolidated form, and the sector is now showing some tentative signs of recovery. In 2013, the global music industry began to grow again for the first time since the turn of the Millennium. It continues to recover and will grow at a compound annual growth rate of 3.5% between now and 2021, according to research by PwC, fuelled by growth in both the recorded music and the live music sectors (see Figure 1).

Figure 1: The global music industry has returned to growth

The global music industry has returned to growth

Source: PWC and Ovum

For most of the past two decades, revenues from recorded music have been shrinking, leaving the industry increasingly reliant on ticket sales for live performances. Widespread piracy, together with the growing obsolesce of CDs, appeared to be turning recorded music into a form of advertising for concerts and tours.

But in 2015, global recorded music revenues began to grow again. In 2016, they rose a relatively healthy 5.9% to US$15.7 billion (about one third of the industry’s total revenue), according to a report by the International Federation of the Phonographic Industry (IFPI). For music industry executives, that growth marks an important milestone. “We got here through years of hard work,” Michael Nash, executive vice president of digital strategy at Universal records, told the Guardian in April 2017, adding that the music industry was still going through a “historical transformation. The only reason we saw growth in the past two years, after some 15 years of substantial decline, is that music has been one of the fastest adapting sectors in the digital world.”

Contents:

  • Executive Summary
  • Introduction
  • Music bounces back
  • What has changed?
  • Is streaming the final word in music distribution
  • Lessons to learn from music’s recovery

Figures:

  • Figure 1: The global music industry has returned to growth
  • Figure 2: The way people buy recorded music is changing dramatically
  • Figure 3: YouTube pays particularly low rates per stream
  • Figure 4: YouTube is a major destination for music lover
  • Figure 5: Music is one of the slowest growing entertainment segments
  • Figure 6: Spotify’s losses continue to grow despite the growth in revenues
  • Figure 7: Spotify’s subscription service is growing rapidly
  • Figure 8: Concert ticket revenues are up sevenfold since 1996 in North America
  • Figure 9: Major concert tickets sell for an average of $77 apiece

Apple’s pivot to services: What it means for telcos

Introduction

The latest report in STL’s Dealing with Disruption stream, this executive briefing considers Apple’s strategic dilemmas in its ongoing struggle for supremacy with the other major Internet ecosystems – Amazon, Facebook and Google. It explores how the likely shift from a mobile-first world to an artificial-intelligence first world will impact Apple, which owes much of its current status and financial success to the iPhone.

After outlining Apple’s strategic considerations, the report considers how much Apple earns from services today, before identifying Apple’s key services and how they may evolve. Finally, the report features a SWOT (strengths, weaknesses, opportunities and threats) analysis of Apple’s position in services, followed by a TOWS analysis that identifies possible next steps for Apple. It concludes by considering the potential implications for Apple’s main rivals, as well as two different kinds of telcos – those who are very active in the service layer and those focused on providing connectivity and enablers.

Several recent STL Partners’ research reports make detailed recommendations as to how telcos can compete effectively with the major Internet ecosystems in the consumer market for digital services. These include:

  • Telco-Driven Disruption: Will AT&T, Axiata, Reliance Jio and Turkcell succeed? To find new revenues, some telcos are competing head-on with the major internet players in the digital communications, content and commerce markets. Although telcos’ track record in digital services is poor, some are gaining traction. AT&T, Axiata, Reliance Jio and Turkcell are each pursuing very different digital services strategies, and we believe these potentially disruptive moves offer valuable lessons for other telcos and their partners.
  • Consumer communications: Can telcos mount a comeback? The rapid growth of Facebook, WhatsApp, WeChat and other Internet-based services has prompted some commentators to write off telcos in the consumer communications market. But many mobile operators retain surprisingly large voice and messaging businesses and still have several strategic options. Indeed, there is much telcos can learn from the leading Internet players’ evolving communications propositions and their attempts to integrate them into broad commerce and content platforms.
  • Autonomous cars: Where’s the money for telcos? The connected car market is being seen as one of the most promising segments of the Internet of Things. Everyone from telcos to internet giants Google, and specialist service providers Uber are eyeing opportunities in the sector. This report analyses 10 potential connected car use-cases to assess which ones could offer the biggest revenue opportunities for operators and outline the business case for investment.
  • AI: How telcos can profit from deep learning Artificial intelligence (AI) is improving rapidly thanks to the growing use of deep neural networks to teach computers how to interpret the real world (deep learning). These networks use vast amounts of detailed data to enable machines to learn. What are the potential benefits for telcos, and what do they need to do to make this happen?
  • Amazon: Telcos’ Chameleon-King Ally? New digital platforms are emerging – the growing popularity of smart speakers, which rely on cloud-based artificial intelligence, could help Amazon, the original online chameleon, to bolster its fast-evolving ecosystem at the expense of Google and Facebook. As the digital food chain evolves, opportunities will open up for telcos, but only if the smart home market remains heterogeneous and very competitive.

Apple’s evolving strategy

Apple is first and foremost a hardware company: It sells physical products. But unlike most other hardware makers, it also has world-class expertise in software and services. These human resources and its formidable intellectual property, together with its cash pile of more than US$250 billion and one of the world’s must coveted brands, gives Apple’s strategic options that virtually no other company has. Apple has the resources and the know-how to disrupt entire industries. Apple’s decision to double the size of it’s already-impressive services business by 2021 has ramifications for companies in a wide range of industries – from financial services to entertainment to communications.

Throughout its existence, Apple’s strategy has been to use distinctive software and services to help sell its high-margin hardware, rather than compete head-on with Google, Facebook, Microsoft and Amazon in the wider digital services and content markets. As Apple’s primary goal is to create a compelling end-to-end solution, its software and services are tightly integrated into its hardware. Although there are some exceptions, notably iTunes and Apple Music, most of Apple’s services and software can only be accessed via Apple’s devices. But there are four inter-related reasons why Apple may rethink that strategy and extend Apple’s services beyond its hardware ecosystem:

      • Services are now Apple’s primary growth engine, as iPhone revenue appears to have peaked and new products, such as the Apple Watch, have failed to take up the slack. Moreover, services, particularly content-based services, need economies of scale to be cost-effective and profitable.
      • Upstream players, such as merchants, brands and content providers, want to be able to reach as many people as possible, as cost-effectively as possible. They would like Apple’s stores and marketplaces to be accessible from non-Apple devices, as that would enable them to reach a larger customer base through a single channel. Figure 1 shows that Apple’s iPhone ecosystem (which use the iOS operating system) is approximately one quarter of the size of rival Android in terms of volumes.
      • Artificial intelligence is becoming increasingly central to the propositions of the major Internet ecosystems, including that of Apple. The development of artificial intelligence requires vast amounts of real-world data that can be used to hone the algorithms computers use to make decisions. To collect the data necessary to detect patterns and subtle, but significant, differences in real-world conditions, the Internet players need services that are used by as many people as possible.
      • As computing power and connectivity proliferates, the smartphone won’t be as central to people’s lives as it is today. For Apple, that means having the best smartphone won’t be enough: Computing will eventually be everywhere and will probably be accessed by voice commands or gestures. As the hardware fades into the background and Apple’s design skills become less important, the Cupertino company may decide to unleash its services and allow them to run on other platforms, as it did with iTunes.

Content:

  • Executive Summary
  • Introduction
  • Apple’s evolving strategy
  • Playing catch-up in artificial intelligence
  • What does Apple earn from services?
  • What are Apple’s key services?
  • Communications – Apple iMessage and FaceTime
  • Commerce – Apple Pay and Apple Wallet
  • Content – iTunes, Apple Music, Apple TV
  • Software – the App Store, Apple Maps
  • Artificial intelligence and the role of Siri
  • Tools for developers
  • Conclusions and implications for rivals
  • Implications for rivals

Figures:

  • Figure 1: Installed base of smartphones by operating system
  • Figure 2: Apple’s artificial intelligence, as manifest in Siri, isn’t that smart
  • Figure 3: Apple’s services business is comparable in size to Facebook
  • Figure 4: The services business is Apple’s main growth engine
  • Figure 5: The strength of Apple’s online commerce ecosystem
  • Figure 6: iMessage is becoming a direct competitor to Instagram and WhatsApp
  • Figure 7: Various apps allow consumers to make payments via Apple Pay
  • Figure 8: Apple Pay is available in a limited number of markets
  • Figure 9: Unlike most Apple services, Apple Music is “available everywhere”
  • Figure 10: Apple’s App Store generates far more revenue than Google Play
  • Figure 11: Apple Maps’ navigation trailed well behind Google Maps in June 2016
  • Figure 12: SWOT analysis of Apple in the services sector
  • Figure 13: TOWS analysis for Apple in the service market

Consumer communications: Can telcos mount a comeback?

Introduction

Although they make extensive use of WhatsApp, Facebook Messenger, Snapchat and other Internet-based communications services, consumers still expect mobile operators to enable them to make voice calls and text messages. Indeed, communication services are widely regarded as a fundamental part of a telco’s proposition, but telcos’ telephony and messaging services are losing ground to the Internet-based competitors and are generating less and less revenue.

Should telcos allow this business to gradually melt away of should they attempt to rebuild a competitive communications proposition for consumers? How much strategic value is there in providing voice calls and messaging services?

This report explores telcos’ strategic options in the consumer communications market, building on previous STL Partners’ research reports, notably:

Google/Telcos’ RCS: Dark Horse or Dead Horse?

WeChat: A Roadmap for Facebook and Telcos in Conversational Commerce

This report evaluates telcos’ current position in the consumer market for voice calls and messaging, before considering what they can learn from three leading Internet-based players: Tencent, Facebook and Snap. The report then lays out four strategic options for telcos and recommends which of these options particular types of telcos should pursue.

Content:

  • Introduction
  • Executive Summary
  • What do telcos have to lose?
  • Key takeaways
  • Learning from the competition
  • Tencent pushes into payments to monetise messaging
  • Facebook – nurturing network effects with fast footwork
  • Snapchat – highly-focused innovation
  • Telcos’ strategic options
  • Maximise data traffic
  • Embed communications into other services
  • Differentiate on reliability, security, privacy and reach
  • Compete head-on with Internet players
  • Recommendations

Figures:

  • Figure 1: Vodafone still makes large sums from incoming calls & messages
  • Figure 2: Usage of Vodafone’s voice services is rising in emerging markets
  • Figure 3: Vodafone Europe sees some growth in voice usage
  • Figure 4: Internet-based services are overtaking telco services in China
  • Figure 5: Usage of China Mobile’s voice services is sliding downwards
  • Figure 6: China Mobile’s SMS traffic shows signs of stabilising
  • Figure 7: Vodafone’s SMS volumes fall in Europe, but rise in AMAP
  • Figure 8: Voice & messaging account for 38% of China Mobile’s service revenues
  • Figure 9: Line is also seeing rapid growth in advertising revenue in Japan
  • Figure 10: More WeChat users are making purchases through the service
  • Figure 11: About 20% of WeChat official accounts act as online shops
  • Figure 12: Line’s new customer service platform harnesses AI
  • Figure 13: Snapchat’s user growth seems to be slowing down
  • Figure 14: Vodafone Spain is offering zero-rated access to rival services
  • Figure 15: Google is integrating communications services into Maps
  • Figure 16: Xbox Live users can interact with friends and other gamers
  • Figure 17: RCS is being touted as a business-friendly option
  • Figure 18: Turkcell’s broad and growing range of digital services

Amazon, Apple, Facebook, Google, Netflix: Whose digital content is king?

Introduction

This report analyses the market position and strategies of five global online entertainment platforms – Amazon, Apple, Facebook, Google and Netflix.

It also explores how improvements in digital technologies, consumer electronics and bandwidth are changing the online entertainment market, while explaining the ongoing uncertainty around net neutrality. The report then considers how well each of the five major entertainment platforms is prepared for the likely technological and regulatory changes in this market. Finally, it provides a high level overview of the implications for telco, paving the way for a forthcoming STL Partners report going into more detail about potential strategies for telcos in online entertainment.

The rise and rise of online entertainment

As in many other sectors, digital technologies are shaking up the global entertainment industry, giving rise to a new world order. Now that 3.2 billion people around the world have Internet access, according to the ITU, entertainment is increasingly delivered online and on-demand.

Mobile and online entertainment accounts for US$195 million (almost 11%) of the US$1.8 trillion global entertainment market today. By some estimates, that figure is on course to rise to more than 13% of the global entertainment market, which could be worth US$2.2 trillion in 2019.

Two leading distributors of online content – Google and Facebook – have infiltrated the top ten media owners in the world as defined by ZenithOptimedia (see Figure 1). ZenithOptimedia ranks media companies according to all the revenues they derive from businesses that support advertising – television broadcasting, newspaper publishing, Internet search, social media, and so on. As well as advertising revenues, it includes all revenues generated by these businesses, such as circulation revenues for newspapers or magazines. However, for pay-TV providers, only revenues from content in which the company sells advertising are included.

Figure 1 – How Google and Facebook differ from other leading media owners

Source: ZenithOptimedia, May 2015/STL Partners

ZenithOptimedia says this approach provides a clear picture of the size and negotiating power of the biggest global media owners that advertisers and agencies have to deal with. Note, Figure 1 draws on data from the financial year 2013, which is the latest year for which ZenithOptimedia had consistent revenue figures from all of the publicly listed companies. Facebook, which is growing fast, will almost certainly have climbed up the table since then.

Figure 1 also shows STL Partners’ view of the extent to which each of the top ten media owners is involved in the four key roles in the online content value chain. These four key roles are:

  1. Programme: Content creation. E.g. producing drama series, movies or live sports programmes.
  2. Package: Content curation. E.g. packaging programmes into channels or music into playlists and then selling these packages on a subscription basis or providing them free, supported by advertising.
  3. Platform: Content distribution. E.g. Distributing TV channels, films or music created and curated by another entity.
  4. Pipe: Providing connectivity. E.g. providing Internet access

Increasing vertical integration

Most of the world’s top ten media owners have traditionally focused on programming and packaging, but the rise of the Internet with its global reach has brought unprecedented economies of scale and scope to the platform players, enabling Google and now Facebook to break into the top ten. These digital disruptors earn advertising revenues by providing expansive two-sided platforms that link creators with viewers. However, intensifying competition from other major ecosystems, such as Amazon, and specialists, such as Netflix, is prompting Google, in particular, to seek new sources of differentiation. The search giant is increasingly investing in creating and packaging its own content.  The need to support an expanding range of digital devices and multiple distribution networks is also blurring the boundaries between the packaging and platform roles (see Figure 2, below) – platforms increasingly need to package content in different ways for different devices and for different devices.

Figure 2 – How the key roles in online content are changing

Source: STL Partners

These forces are prompting most of the major media groups, including Google and, to a lesser extent, Facebook, to expand across the value chain. Some of the largest telcos, including Verizon and BT, are also investing heavily in programming and packaging, as they seek to fend off competition from vertically-integrated media groups, such as Comcast and Sky (part of 21st Century Fox), who are selling broadband connectivity, as well as content.

In summary, the strongest media groups will increasingly create their own exclusive programming, package it for different devices and sell it through expansive distribution platforms that also re-sell third party content. These three elements feed of each other – the behavioural data captured by the platform can be used to improve the programming and packaging, creating a virtuous circle that attracts more customers and advertisers, generating economies of scale.

Although some leading media groups also own pipes, providing connectivity is less strategically important – consumers are increasingly happy to source their entertainment from over-the-top propositions. Instead of investing in networks, the leading media and Internet groups lobby regulators and run public relations campaigns to ensure telcos and cablecos don’t discriminate against over-the-top services. As long as these pipes are delivering adequate bandwidth and are sufficiently responsive, there is little need for the major media groups to become pipes.

The flip-side of this is that if telcos can convince the regulator and the media owners that there is a consumer and business benefit to differentiated network services (or discrimination to use the pejorative term), then the value of the pipe role increases. Guaranteed bandwidth or low-latency are a couple of the potential areas that telcos could potentially pursue here but they will need to do a significantly better job in lobbying the regulator and in marketing the benefits to consumers and the content owner/distributor if this strategy is to be successful.

To be sure, Google has deployed some fibre networks in the US and is now acting as an MVNO, reselling airtime on mobile networks in the US. But these efforts are part of its public relations effort – they are primarily designed to showcase what is possible and put pressure on telcos to improve connectivity rather than mount a serious competitive challenge.

  • Introduction
  • Executive Summary
  • The rise and rise of online entertainment
  • Increasing vertical integration
  • The world’s leading online entertainment platforms
  • A regional breakdown
  • The future of online entertainment market
  • 1. Rising investment in exclusive content
  • 2. Back to the future: Live programming
  • 3. The changing face of user generated content
  • 4. Increasingly immersive games and interactive videos
  • 5. The rise of ad blockers & the threat of a privacy backlash
  • 6. Net neutrality uncertainty
  • How the online platforms are responding
  • Conclusions and implications for telcos
  • STL Partners and Telco 2.0: Change the Game


  • Google is the leading generator of online entertainment traffic in most regions
  • How future-proof are the major online platforms?
  • Figure 1: How Google and Facebook differ from other leading media owners
  • Figure 2: How the key roles in online content are changing
  • Figure 3: Google leads in most regions in terms of entertainment traffic
  • Figure 4: YouTube serves up an eclectic mix of music videos, reality TV and animals
  • Figure 5: Facebook users recommend videos to one another
  • Figure 6: Apple introduces apps for television
  • Figure 7: Netflix, Google, Facebook and Amazon all gaining share in North America
  • Figure 8: YouTube & Facebook increasingly about entertainment, not interaction
  • Figure 9: YouTube maintains lead over Facebook on American mobile networks
  • Figure 10: US smartphones may be posting fewer images and videos to Facebook
  • Figure 11: Over-the-top entertainment is a three-way fight in North America
  • Figure 12: YouTube, Facebook & Netflix erode BitTorrent usage in Europe
  • Figure 13: File sharing falling back in Europe
  • Figure 14: iTunes cedes mobile share to YouTube and Facebook in Europe
  • Figure 15: Facebook consolidates strong upstream lead on mobile in Europe
  • Figure 16: YouTube accounts for about one fifth of traffic on Europe’s networks
  • Figure 17: YouTube & BitTorrent dominate downstream fixed-line traffic in Asia-Pac
  • Figure 18: Filesharing and peercasting apps dominate the upstream segment
  • Figure 19: YouTube stretches lead on mobile networks in Asia-Pacific
  • Figure 20: YouTube neck & neck with Facebook on upstream mobile in Asia-Pac
  • Figure 21: YouTube has a large lead in the Asia-Pacific region
  • Figure 22: YouTube fends off Facebook, as Netflix gains traction in Latam
  • Figure 23: How future-proof are the major online platforms?
  • Figure 24: YouTube’s live programming tends to be very niche
  • Figure 25: Netflix’s ranking of UK Internet service providers by bandwidth delivered
  • Figure 26: After striking a deal with Netflix, Verizon moved to top of speed rankings

How BT beat Apple and Google over 5 years

BT Group outperformed Apple and Google

Over the last five years, the share price of BT Group, the UK’s ex-incumbent telecoms operator, has outperformed those of Apple and Google, as well as a raft of other telecoms shares. The following chart shows BT’s share price in red and Apple’s in in blue for comparison.

Figure 1:  BT’s Share Price over 5 Years

Source: www.stockcharts.com

Now of course, over a longer period, Apple and Google have raced way ahead of BT in terms of market capitalisation, with Apple’s capital worth $654bn and Google $429bn USD compared to BT’s £35bn (c$53bn USD).

And, with any such analysis, where you start the comparison matters. Nonetheless, BT’s share price performance during this period has been pretty impressive – and it has delivered dividends too.

The total shareholder returns (capital growth plus all dividends) of shares in BT bought in September 2010 are over 200% despite its revenues going down in the period.

So what has happened at BT, then?

Sound basic financials despite falling revenues

Over this 5 year period, BT’s total revenues fell by 12%. However, in this period BT has also managed to grow EBITDA from £5.9bn to £6.3bn – an impressive margin expansion.   This clearly cannot go on for ever (a company cannot endlessly shrink its way to higher profits) but this has contributed to positive capital markets sentiment.

Figure 2: BT Group Revenue and EBITDA 2010/11 – 2014/15

[Figure 2]

Source: BT company accounts, STL Partners

BT pays off its debts

BT has also managed to reduce its debt significantly, from £8.8bn to £5.1bn over this period.

Figure 3: BT has reduced its debts by more than a third (£billions)


Source: BT company accounts, STL Partners

Margin expansion and debt reduction suggests good financial management but this does not explain the dramatic growth in firm value (market capitalisation plus net debt) from just over £20bn in March 2011 to circa £40bn today (based on a mid-September 2015 share price).

Figure 4: BT Group’s Firm Value has doubled in 5 Years

Source: BT company accounts, STL Partners

  • Introduction: BT’s Share Price Miracle
  • So what has happened at BT, then?
  • Sound basic financials despite falling revenues
  • Paying off its debts
  • BT Sport: a phenomenal halo effect?
  • Will BT Sport continue to shine?
  • Take-Outs from BT’s Success


  • Figure 1: BT’s Share Price over 5 Years
  • Figure 2: 5-Year Total Shareholder Returns Vs Revenue Growth for leading telecoms players
  • Figure 3: BT Group Revenue and EBITDA 2010/11-2014/15
  • Figure 4: BT has reduced its debts by more than a third (£billions)
  • Figure 5: BT Group’s Firm Value has doubled in 5 Years
  • Figure 6: BT Group has improved key market valuation ratios
  • Figure 7: BT ‘broadband and TV’ compared to BT Consumer Division
  • Figure 8: Comparing Firm Values / Revenue Ratios
  • Figure 9: BT Sport’s impact on broadband

Netflix: Threat or Opportunity?

Introduction

The way in which audiences consume movies and television content appears to be changing.  While ‘linear’ viewing of scheduled channels remains robust, the market for DVD has collapsed and new pricing and consumption models are opening up.

At the forefront of this is Netflix – with a total of 63M paying subscribers across 50 markets (it is present in a large number of locations in Latin America and the Caribbean) and a penetration of over 34% in the US, Netflix has created a new paradigm for on demand content.

How this model is going to impact other players in the market in the long term is as yet unclear. To date in the US, pay platform penetration has remained robust, premium channels such as HBO are also performing strongly, and for rights owners and producers a new player bidding for rights is hugely welcome.

So is Netflix a ‘win: win’ opportunity for all concerned?  It may not be that straightforward.  

  • For leading pay TV players, Netflix will be yet another component forcing them to invest in innovation to minimise customers churning from bundled packages, and reducing flexibility around price increases;
  • For TV channels Netflix could lead to programme rights inflation, as a new player with a distinct business model comes into bid for premium exclusive content rights
  • For both established TV platforms and premium channels there is the risk that in price sensitive markets or demographics Netflix offers may gain traction, particularly among younger consumers at the expense of traditional subscription models.
  • For telcos looking to compete with cable and satellite, while Netflix could offer a cost effective way to deliver attractive premium content, it also carries a risk of constraining the telcos into the position of a ‘dumb (or happy) pipe’, not sharing in upsides and not owning the consumer who deals directly with Netflix.

STL Partners has partnered with Prospero Strategy Consultants who work extensively with content and platform players on new market dynamics to prepare this Briefing. The work has drawn on interviews with key players and analysis of quantitative and qualitative market data, to determine the threats and opportunities emerging from this new content ecosystem and how these are likely to develop.

Overview of Netflix History

Netflix began as a postal DVD business in the US in 1997, launching its US subscription streaming service in 2007.  Since 2011 it has focused on rapid expansion into international markets with the biggest growth now coming from international subscribers (67% growth between 2013 and 2014) while its US DVD business is now in decline.

Figure 4: Netflix subscribers 1999 – 2014(Q3) in 000s

Source: Netflix annual reports, STL Partners & Prospero analysis

Netflix changed its reporting methodology from Q1 2011

Consumer Proposition and USPs

The success of the Netflix proposition to consumers has been based on a number of components:

  • Low Price and refusal to tie users into long-term contracts
  • Volume and exclusivity of content
  • Effective User Interface, recommendation engine and multi-device access
  • Customer Data

Low Price
The low monthly price point of Netflix (USD7.99 per month in the US rising to USD8.99 for new subscribers in 2014) has been a key component of the company’s success. This price point is less than the cost of purchasing a single DVD and significantly less than monthly premium drama channels such as HBO (at ~USD15 per month). This price point (and that users are not tied into long term contracts) allows Netflix to attract distinct audience groups.

  • First, the high-end audience who are already pay subscribers.  These customers have demonstrated that they are typically price inelastic and willing to pay for more, buying Netflix on top of existing services.
  • Second, the price constrained audiences, for whom traditional pay TV is out of reach but who are interested in expanded choice.  These are often younger demographics for whom the concept of non-linear consumption is very familiar.
  • There is a third audience group, the price sensitive pay TV subscribers for whom Netflix could be an effective substitute and who could churn off traditional pay TV (either completely or partially) as a result.  While the evidence around the impact on this group is as yet nascent, it is this segment that is making incumbent pay TV players nervous.

Figure 5: Reasons Netflix streamers subscribe to the Service

Source: Alphawise, 3rd Annual Streaming Video Survey – More Devices, More Consumption, March 2013

Volume and Exclusivity

As demonstrated in Figure 5 above a key to success has been offering both range and quality of content.  However, over time the shape of the Netflix library has changed as it has used its customer insight and data to inform its rights strategy.

  • In February 2012 the Netflix US library consisted of ~15k titles (Source: SNL Kagan) of which nearly three quarters were movie titles.
  • Since 2012 the volume of library titles has declined by approximately 30% nearly all of which is accounted for by a decline in movie titles.  Netflix has increased its focus on long run drama series which already have brand recognition and which are effective at attracting and keeping audiences.
  • Interestingly, the volume of content being offered in its international markets is significantly less than in the US (about one-third) as Netflix shifts its focus to quality (as opposed to quantity of content)

Netflix’s early content deals were typically library rights and non-exclusive.  Over time that mix has shifted as Netflix increasingly looks to have a component of exclusivity with the aim of shifting from a “nice to have” to a “must have” service

  • Netflix is investing in original production of a limited number of high profile, high end drama series (such as House of Cards, Orange is the only Black and the recently announced Crouching Tiger Hidden Dragon sequel).  For these Netflix can retain its exclusive rights indefinitely.
  • In addition, Netflix is bidding aggressively for exclusive windows for high end content (such as the recently announced deal for exclusive VOD rights in all territories for Gotham and first window rights in several territories for Penny Dreadful).

Figure 6: Netflix’s Evolving Content Proposition


Source: STL Partners & Prospero analysis

Effective consumer interface on multiple devices

Netflix has evolved a highly effective consumer interface, enabling personalisation by individual members in the household, with an easy to manage and visually effective selection mechanism.

  • Since 2008 Netflix has rolled out its proposition across multiple connected devices, with the most recent development being access on mobile devices and partnership with 4G operators such as Vodafone.  Cross device functionality gives users a consistent experience.
  • The consumer is able to choose when and where to consume Netflix content – leading to a new dynamic of series “bingeing” analogous to box set consumption.  In addition, Netflix’s deals with Smart TV providers gives consumers the ability to by-pass traditional pay TV gatekeepers.

Figure 7: Netflix’s user interface

Source: Netflix & SNL Kagan

Customer Data

  • Underlying a huge part of their success is Netflix’s control of its data.  This includes knowledge of individuals within households (who will have their own profiles), detailed insight into viewing behaviour (not just what, but when and how much), knowledge that no linear channel can match.
  • In all markets (regardless of its distribution partners) Netflix retains its customer data and does not share it.  This informs its rights negotiations and new programme investments.
  • Netflix continues to refine its customer understanding using sophisticated A/B testing where small sub groups are given slightly different user experiences to see how this changes behaviour


  • Executive Summary
  • Introduction
  • Overview of Netflix
  • History
  • Consumer Proposition and USPs
  • Netflix International Expansion
  • Netflix Financials
  • Attitude of the Financial Markets
  • Impact of Netflix on the Market
  • Impact on Rights Owners and Producers
  • Impact on Channels
  • Impact on Pay Platforms
  • Impact on Broadband Operators
  • Summary impacts on players along the value chain
  • Responses to Netflix
  • Case Study: HBO
  • Case Study: BSkyB
  • Case Study: Broadband Operators
  • Case Study: New Competitors


  • Figure 1: Selected Media Companies Market Capitalisation, 1st Sept. 2014 (left) & 1st Jan. 2015 (right), USD billion
  • Figure 2: Netflix’s subscriber targets for 2020 (announced launches only) in USD million
  • Figure 3: Summary of Netflix’s Impacts along the Value Chain
  • Figure 4: Netflix subscribers 1999 – 2014 in 000s
  • Figure 5: Reasons Netflix streamers subscribe to the Service
  • Figure 6: Netflix’s Evolving Content Proposition
  • Figure 7: Netflix’s user interface
  • Figure 8: Netflix geography and timeline
  • Figure 9: Netflix’s Market Penetration over time to Dec 2013 (% households)
  • Figure 10: Netflix revenue per service area, 1999 – 2014, USD million
  • Figure 11: Netflix’s revenues & costs per business line, 2011–2014, USD million
  • Figure 12: Netflix’s net income and free cash flow, 2009 – 2014, USD million
  • Figure 13: Netflix’s streaming content obligations, 2010 – 2013, USD million
  • Figure 14: Selected Media Companies Market Capitalisation, 1st Sept. 2014 (left) & 1st Jan. 2015 (right), USD billion
  • Table 1: Comparison of Key Value Ratios
  • Figure 15: Netflix’s share price (USD), Jan 2010 – Jan 2015
  • Figure 16: Players along the Value Chain
  • Figure 17: Subscribers to premium channels in the US (%of TV households)
  • Figure 18: Changes in US Pay TV Penetration
  • Figure 19: Percentage of Households that are “cord-cutters”
  • Figure 20: Real Time Entertainment Share of Downstream Traffic
  • Figure 21: Share of Traffic of Downstream Peak Time Applications
  • Figure 22: Summary of Impacts along the Value Chain
  • Figure 23: Overview of Sky Expanded Offering
  • Figure 24: Sky’s offering across All Windows
  • Figure 25: Vodafone / Spotify and Sky Sport deals – Impact on mobile broadband usage
  • Figure 26: Netflix Broadband Partners
  • Figure 27: Netflix Competitor Set

Digital Entertainment: What Gets Measured Gets Money

Summary: For mobile entertainment services to generate revenues commensurate to the attention they receive, the industry needs to improve ‘discovery’ tools, create more effective creative inventory, and deliver proof of its effectiveness. A summary of the Digital Entertainment 2.0 session of the 2013 Silicon Valley Brainstorm. (April 2013)

Digital Entertainment 2.0: What Gets Measured Gets Money

  Read in Full (Members only)   To Subscribe click here

Below are the high-level analysis and detailed contents from a 27 page Telco 2.0 Briefing Report that can be downloaded in full in PDF format by members of the Telco 2.0 Executive Briefing service here. The Digital Economy, Consumer Experience (including service ‘discovery’), Digital Commerce and the Internet of Things will also be explored in depth at the EMEA Executive Brainstorm in London, 5-6 June, 2013. Non-members can find out more about subscriptions here, or to find out more about this and other enquiries, please email contact@telco2.net or call +44 (0) 207 247 5003.

To share this article easily, please click:


Introduction

Part of the New Digital Economics Executive Brainstorm series, the Digital Entertainment 2.0 session took place at the Intercontinental Hotel, San Francisco, on the 20th March, 2013. The title and objective of the session was ‘How to Make Mobile Work’.

Analysis: What Gets Measured Gets Money

The key steps for mobile entertainment services to generate revenues commensurate to the attention it receives in North America are: to improve measurement of the success of ‘discovery’ tools, create more effective creative advertising inventory, and deliver proof of its effectiveness, not just the attention.

Mobile is a ‘break out’ entertainment media

Mobile has for some time been an entertainment media in the eyes of consumers, and particularly younger ones who soak up ‘dead time’ by playing games, using apps and even just communicating for fun, although to date not all these forms of entertainment have been connected.

In the past 3 years there has been a significant increase in ‘on demand’ and mobile consumption in North American and European markets, particularly in these younger segments, although a key challenge has been that monetisation has not followed the use of time spent on mobile.

Mobile entertainment itself can be defined as related to a context (e.g. ‘out and about’, ‘dead time’, ‘second screen’), devices (featurephone, smartphone or tablet), or type of connection (e.g. none, 3G, 4G, Wi-Fi). In general though, there are two main scenarios: mobile as a medium in its own right; and mobile as a ‘second screen’ experience. So in either scenario, we think the clearest answer to ‘what is the role of mobile?’ is that it is a ‘break out’ media, either extending the context of a form of entertainment, or extending the nature of entertainment in the existing context.

For video in North America, TV is still the dominant form of consumption, but mobile is growing rapidly as the ‘second screen’ that controls or supplements the main screen, especially with the explosive growth of tablets since the introduction of the Apple iPad.

Segmentation – there’s no single dominant business model

There has been much debate about the viability of different business models, broadly: advertising funded; consumer ownership; and subscription. While most participants believed that the ownership model would be most successful in music, where there is a higher likelihood that a consumer will want to listen to a track or album numerous times, ‘collectors’ or owners will still exist for videos, books and games.

Digital Collector Segment Size April 2013

Equally, demand exists for single ‘on demand’ services (e.g. pay per view), subscription (e.g. Spotify, cable), and advertising funded (e.g. YouTube). The balance is likely to change in video in particular with a move to increasing ‘on demand’ services in line with the current trend in consumer behaviour.

‘Discovery’: finding a model that proves it works

As the previously dominant channel-based model of curation in broadcast media gradually dissolves, and as the screen size, context and characteristics of consumption change, consumers face an increasing challenge finding out what they want to see, play or listen to.

Curation still exists through channel guides, taste-makers and review sites, and indeed through many offline sources, but is increasingly less the property of the content producer or distributor that it once was.

Content Discovery, one of the great buzz phrases of the industry, is therefore an ongoing challenge, and the application of networked computing power provide some advantages to connected and interactive devices like smartphones and tablets. Approaches used include:

  • 3rd party classification (e.g. by genre, subject), enabling more structured self-selection through menu choices etc.;
  • Recommendation engines (the Amazon/Netflix model), that can be based on a ‘Big Data’ approach (‘other people who bought this also bought that’) and/or semantic association (‘here’s another sentimental family comedy you might like’);
  • Social approaches, based on what your friends like or are watching, either through generic social media like Facebook, and specialised social media such as Zeebox.com (for video) and Goodread.com (for books);
  • Search – although this is non-trivial due to the volume of material in existence, and the ever-changing art of Search Engine Optimisation (SEO) – getting the right items at the top of the list.
  • Hybrid approaches that combine ‘Big Data’ with ‘semantic association’ (e.g. see Jinni.com) and/or other forms e.g. Social (e.g. see this intriguing article on the $1m recommendations challenge from Netflix).

For all methods, the inconsistencies of the metadata recorded (e.g. is the media described accurately using your terms) is frequently a challenging limitation.

To a degree though, content discovery has always been a process of ‘trial and error’. Consumers read, hear or see a load of ideas, try a few out, stick to the ones they like, and grow to trust the means of discovery that is most successful for them.

To this end, an element that appears to be missing in many discovery processes today is the measurement of success rate for the user – “was this a good recommendation for you”? In our view, discovery applications that accurately track success well (easily, with a good UI, and with a tangibly good and improving success rate) will ultimately prove successful. All of the above techniques could and to a greater or lesser extent do adopt this approach, although it isn’t yet clear which will perform the best in the market.

Delivering the goods

The challenges of delivering content, particularly large volume (e.g. HD Video) and/or latency sensitive content (such as multi-player virtual gaming), were not addressed in the Digital Entertainment session, though Software Defined Networking (SDN), which offers the promise of more efficient routing through networks for certain traffic, was discussed in the Digital Economy session. Content Delivery Networks and other Broadband design techniques have also been addressed at length in other STL Partners research and brainstorms

However, ‘Bandwidth’ was one of the key determinants of success according to the ‘BBC’ heuristic offered from Mitch Berman’s experience as a guide to how mobile entertainment will operate in different markets: Bandwidth; Business Model; and Culture. (NB We think this can also be seen as a shorthand variant of our business model framework, with culture being a key driver of the content proposition, bandwidth of the technical capability, and business model as the value proposition.) 

Getting money commensurate with the time spent on mobile

A major challenge for advertising funded mobile entertainment is that there is a significant gap between the ratio of the amount of time spent viewing mobile and the money spent on it, and other forms of media. This is illustrated by the stats that:

  • For The Weather Channel, mobile is 1.5 X the traffic but less than 50% of the revenue;
  • 10% of media consumption occurs online Vs. 1% media spend (from the presentation by Cary Tild, CIO GroupM in subsequent Marketing and Advertising session).

While this imbalance is genuine, there are important advantages and limitations to mobile as a medium that haven’t yet been fully exploited or overcome, respectively.

One of the major limitations has been the need for more effective commercial inventory on mobile. At the Brainstorm there was, for example, much discussion on the limitations of banner type ads in a mobile environment. Many more innovative forms are now evolving, illustrated by:

  • The Weather Channel’s experimental creative commercial content within its app, in which instead of a rectangular banner at the top of the screen, appropriate commercial content is embedded on background of the weather screen (e.g. a cloud-wrapped image from a mystery film on a cloudy day’s forecast screen);
  • New trial applications that insert products virtually in existing content (e.g. a soft-drink on a table in an old TV show, as demonstrated in test form by ReinCloud);
  • And subsequently, the launch of Facebook Home, designed to increase the commercial inventory available to Facebook by taking over the screen of a user’s smartphone.

In the same way that advertising has always evolved (from print to radio, radio to TV, etc.), there is still much to be learned through innovation and experimentation – and of course the related measurements of success.

Charging differently for content rights by content owners, e.g. by the use of content rather than as an upfront fee, was also discussed, although many content owners are reluctant to move to or even test this model as they see it representing a significant risk to existing revenue streams.

The digital economy core themes of ‘big data’ and ‘localisation’ were also raised, and an example given by the Weather Company of a highly effective promotion of grass seeds based on locality and the detection of key seasonal weather changes.

Finally, a key theme in common with the subsequent advertising session was that proving the effectiveness of models to consumers, brands, and investors was the key step for most mobile entertainment concepts. We see thoughtful design, coupled with trial and experimentation, effective measurement and the ongoing application of learning processes to be central to achieving that proof.

Next Steps

Effectiveness in the ‘discovery’ phase of digital service is a key success criterion, particularly in Digital Entertainment. We will continue to research and explore this area in our Executive Brainstorms in Europe, the Middle East, and Asia-Pacific.

To read the note in full, including the following sections detailing additional analysis…

  • Brainstorm: Stimulus Presentations – summary and key points
  • Brainstorm: Table Discussions
  • Verbatim delegate questions & comments
  • Brainstorm: Panel Session in summary

…and the following figures…

  • Figure 1 – Traditional linear TV model is facing multiple disruptions
  • Figure 2 – Non-linear forms of TV becoming a massmarket requirement
  • Figure 3 – Tablets are changing the TV/video landscape
  • Figure 4 – The mobile problem
  • Figure 5 – Whither digital collectors?
  • Figure 6 – Shine on you crazy diamond?
  • Figure 7 – Sharing the locker?
  • Figure 8 – Do we all want libraries?

Members of the Telco 2.0 Executive Briefing Subscription Service can download the full 27 page report in PDF format here. Non-Members, please subscribe here. The Digital Economy, Consumer Experience (including service ‘discovery’), Digital Commerce and the Internet of Things will also be explored in depth at the EMEA Executive Brainstorm in London, 5-6 June, 2013. For this or any other enquiries, please email contact@telco2.net / call +44 (0) 207 247 5003.

Background & Further Information

The 2013 Silicon Valley Brainstorm used STL’s unique ‘Mindshare’ interactive format, including cutting-edge new research, case studies, use cases and a showcase of innovators, structured small group discussion on round-tables, panel debates and instant voting using on-site collaborative technology. Around 30 executives from entertainment, media, telecoms and technology companies participated in this session in total.

The focus was on looking at “the true role for mobile” in the digital entertainment industry. Opening the session informally, various attendees were canvassed about their intentions & hopes for the day. This yielded a desire for information to assist in business modelling, to learn about the realities of the US entertainment market – or just to experience “inspiration and surprise” from a diverse set of speakers.

Objective: How to Make Mobile Work

The session covered three presentations and a demo, spanning the width of the entertainment business from TV to books, and from user behaviour to advertising. Its principle focus was around how content and telecom companies could generate sustainable businesses by leveraging the trend towards mobility – both devices and networks.

  • Designing compelling mobile entertainment experiences
  • 4G: The impact on video distribution and consumption economics
  • Latest models for monetisation

The session included three Stimulus Speakers:

  • Andre James, Partner, Bain & Co
  • Alex Linde, Vice President, Mobile & Digital Apps,The Weather Channel
  • Keith McMahon, Senior Analyst, STL Partners/Telco 2.0

In addition, Dan Reitan, CEO, Reincloud gave an Innovation Showcase demo, after which these four were joined on the debate panel by two other industry luminaries:

  • David Gale, EVP New Media, MTV
  • Mitchell Berman, Principal, Blend Digital

We’d like to thank the sponsors of the Brainstorm:
Silicon Valley 2013 Sponsors

The Great Compression: surviving the ‘Digital Hunger Gap’

Introduction

The Silicon Valley Brainstorm took place on 19-20 March 2013, at the Intercontinental Hotel, San Francisco.

Part of the New Digital Economics Executive Brainstorm & Innovation Series, it built on output from previous events in Singapore, Dubai, London and New York, and new market research and analysis, and focused on new business models and growth opportunities in digital commerce, content and the Internet of Things.

Summary Analysis: ‘The Great Compression’

In the next 10 years, many industries face the ‘Great Compression’ in which, in addition to the pressures of ongoing global economic uncertainty, there is also a major digital transformation that is destroying traditional value and moving it ‘disruptively’ to new areas and geographies, albeit at diminished levels.

In previous analyses (e.g. Dealing with the ‘Disruptors’: Google, Apple, Facebook, Microsoft/Skype and Amazon) we have shown how key technology players in particular compete with different objectives in different parts of the digital value chain. Figure 1 below shows via crossed dollar signs (‘New Non-Profit’) the areas in which companies are competing without the primary intention of driving profits, which means that traditional competitors in those areas can expect ‘disruptive’ competition from new business models.

Figure 1 – Digital disruption
Digital disruption occurring in many industries Mar 2013

Source: STL Partners ‘Dealing with the ‘Disruptors’: Google, Apple, Facebook, Microsoft/Skype and Amazon’


The Digital Hunger Gap

For the incumbent industry players we call the near-term results of this disruption ‘The Digital Hunger Gap’ – the widening deficit between past and projected revenues. Chris Barraclough, Chief Strategist STL Partners presented the classic Music Industry case study of the ‘Hunger Gap’ effects of digital disruption.

Figure 2 – The Music Industry’s ‘Hunger Gap’
The Music Industry's ‘Hunger Gap’ Mar 2013

Source: STL Partners


In a vote, 95% of participants agreed that something similar would happen in other industries.

Chris then presented our initial analysis of the ‘Hunger Gap’ for telcos (to be published in full shortly), and asked the participants where they thought the telco industry would be relative to its 2012 position in 2020.

Figure 3 – Participants’ views on forecasts for the telecoms industry
Participants' views on forecasts for the telecoms industry Mar 2013

Source: Silicon Valley 2013 Participants / STL Partners


As can be seen, participants’ views were widely spread, with a slight bias towards a more pessimistic outlook than that presented of a recovery to 2012 levels.

Chris argued that as the ‘hunger gap’ widens, and before new revenues are developed, there will be massive consolidation and cost-reduction among incumbent players, and opportunities for innovation in services, but the chances of success in the latter are very low and require a portfolio approach and either deep pockets, exceptional insight, or considerable good fortune.

Richard Kramer, Managing Partner of Arete Research, also presented a deflationary outlook for all but the leading consumer technology players in the handset and tablet arena.

Participants then voted on which areas needed the most significant changes in their business – and existing managements’ ‘mindset’ was voted as the top priority.

Figure 4 – ‘Mindset’ is the biggest barrier to transformation
'Mindset' is the biggest barrier to transformation Mar 2013

Source: Silicon Valley 2013 Participants / STL Partners


It is also notable that all categories averaged 3.0 or over – or needing ‘Significant Change’. This points to a significant transformation across all industries.

Content:

  • Opportunities
  • Telco 2.0 Strategies
  • Big Data and Personal Data
  • Digital Commerce
  • Digital Entertainment
  • Mobile Advertising & Marketing
  • The Internet of Things
  • Outlook by Industry
  • Next Steps


  • Figure 1 – Digital disruption
  • Figure 2 – The Music Industry’s ‘Hunger Gap’
  • Figure 3 – Participants’ views on forecasts for the telecoms industry
  • Figure 4 – ‘Mindset’ is the biggest barrier to transformation
  • Figure 5 – The ‘Telco 2.0’ opportunities for CSPs
  • Figure 6 – The impact of ‘Software Defined Networks’ (SDN)
  • Figure 7 – Will ‘Personal Data’ be more useful than ‘Big Data’?
  • Figure 8 – STL Partners’ ‘Wheel of Digital Commerce’
  • Figure 9 – Who will in ‘SoMoLo’?
  • Figure 10 – Significant changes in viewing habits
  • Figure 11 – Transformation needed in the advertising industry
  • Figure 12 – Growth projections for M2M ‘mobile’ (e.g. 3G/4G) connected devices