
Lightstorm’s SmartNet and Polarin – NaaS case study
Welcome to this series analysing innovative B2B offerings by leading telcos worldwide. In this second edition, we turn our focus to a successful NaaS player in India.

Welcome to this series analysing innovative B2B offerings by leading telcos worldwide. In this second edition, we turn our focus to a successful NaaS player in India.

Welcome to this series analysing innovative B2B offerings by leading telcos worldwide.
In this first edition, we turn our focus to a successful software-as-a-service (SaaS) offering coming from Singapore.

This is part 2 of a 3-part series taking an in-depth look at how 5G pioneers have evolved their approaches to commercialisation since launch, navigating a maze of factors such as handset availability, technology immaturity and more. What should others take from their experience to date?

Will many other digital commerce and content companies follow Reliance and Rakuten into the consumer connectivity market?

What the leading on-demand entertainment specialists – Netflix and Spotify – will need to do the mount a serious challenge to GAFA in the top tier of Internet platforms and how telcos can help them make the online world more competitive.

Telcos and the major Internet platforms increasingly rely on each other. What kinds of agreements should operators enter into with Amazon, Apple, Facebook and Google and what should they avoid? And what are the strategic implications of supporting players who habitually use their powerful brands and software expertise to disrupt entire industries?

With iPhone sales apparently peaking, Apple is looking to double its revenue from services over the next four years to approximately US$50 billion, taking it deeper into adjacent markets, such as entertainment, financial services and communications. However, Apple trails behind Google in developing artificial intelligence and needs to extend the reach of its services to capture more behavioural data. If Apple decides to decouple more of its key services from its hardware, that would have major ramifications for Google, Amazon, Facebook and many of the world’s leading telcos.

To find new revenues, some telcos are competing head-on with the major internet players in the digital communications, content and commerce markets. Although telcos’ track record in digital services is poor, some are gaining traction. AT&T, Axiata, Reliance Jio and Turkcell are each pursuing very different digital services strategies, and we believe these potentially disruptive moves offer valuable lessons for other telcos and their partners.

The rapid growth of Facebook, WhatsApp, WeChat and other Internet-based services has prompted some commentators to write off telcos in the consumer communications market. But many mobile operators retain surprisingly large voice and messaging businesses and still have several strategic options. Indeed, there is much telcos can learn from the leading Internet players’ evolving communications propositions and their attempts to integrate them into broad commerce and content platforms. In this report we examine what opportunities still exist for telcos in this strategically important sector.

Over 5 years, BT Group’s share price has more than tripled, outperforming Apple’s and Google’s, while its revenues have shrunk. Why, and what can other telcos learn from its success?
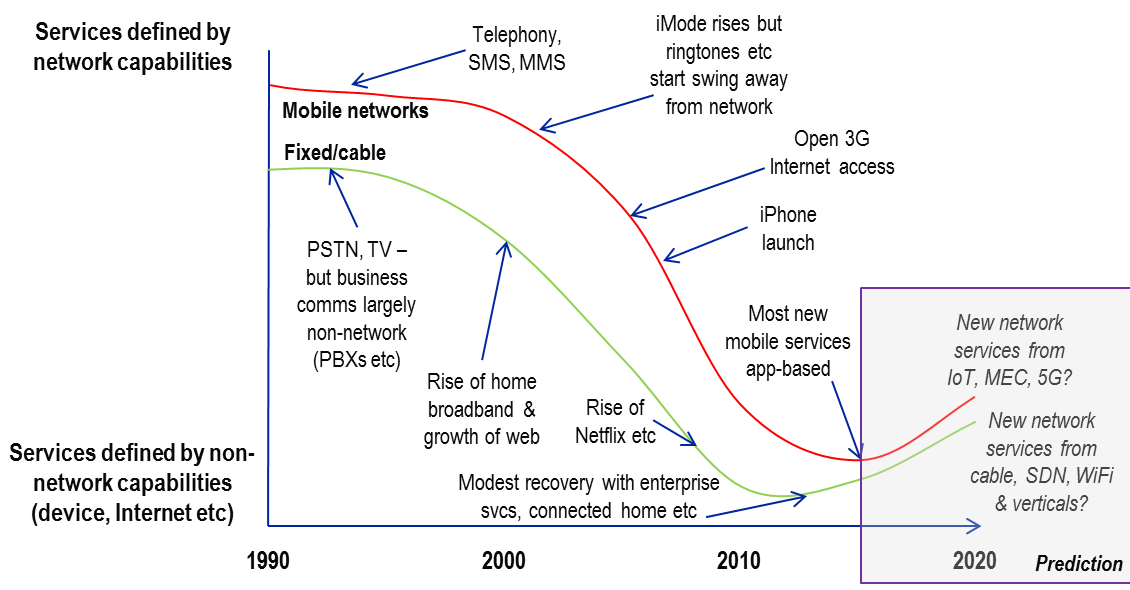
Enthusiasm for creating novel so-called “digital” services is pervasive in the telecoms industry. There is a major shift afoot in the way telcos create, integrate, sell and manage value-added propositions. But how much is enabled by – or dependent on – the network itself? In recent years, most investment has been solely for improved connectivity, but there are signs that future network capex might drive new service opportunities directly, rather than just by empowering 3rd parties.
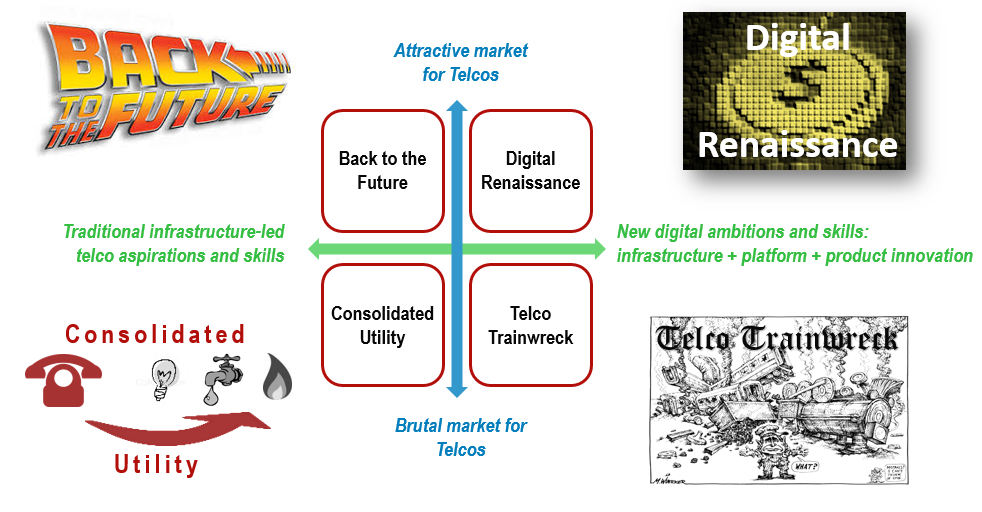
Seven predictions and four scenarios for how the industry might play out in Europe in the next 5 years: ‘Digital Renaissance’, ‘Back to the Future’, ‘Commoditised Utility’ and ‘Telco Trainwreck’. Plus what are the take-outs for other markets?
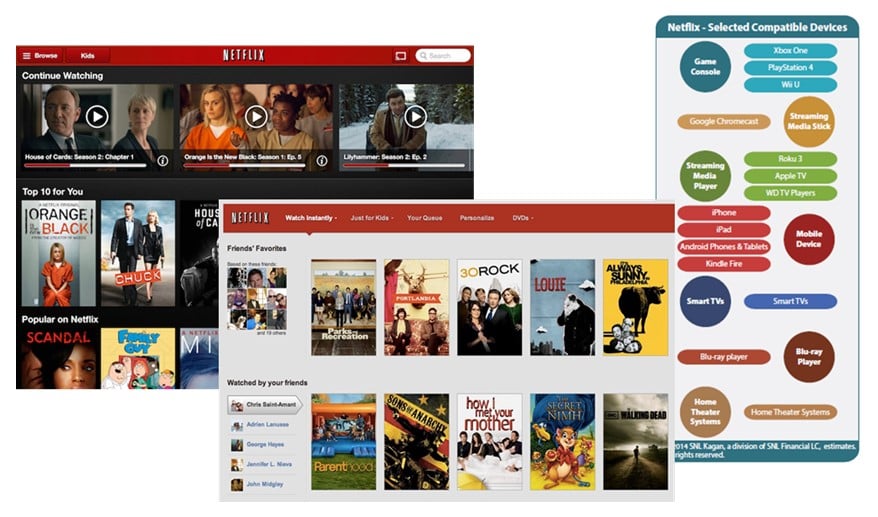
Netflix’s success in the US and in Western Europe has demonstrated that consumers are willing to change how they watch and pay for TV and movies. As a result Netflix’s OTT proposition is challenging traditional pay TV models and changing how new broadband services are looking at content. For some players Netflix is a threat and for others an opportunity. So, how should content owners, channels, pay platforms and broadband providers respond?

BT’s attempt to acquire EE in the UK presents the regulator and its competitors with choices that could re-frame the principles of regulation and competition in an era of consolidation, with consequences for many other markets. Will BT succeed, and if so, what will be the terms of the deal, and how will the market subsequently play out?
Verizon and Comcast have invested in high bandwidth fibre and cable networks, whereas AT&T has until recently focused on U-Verse, an IPTV play. Which strategy is winning out and why? The answer is surprising and may transform the US and other markets, and there are parallels with Apple and Samsung’s ‘deep value’ strategies of investing in assets that are hard to replicate.

An extract from our 284 page, 124 chart, strategy report that analyses the business models, markets, objectives, strategies and modus operandi of the major adjacent players, and their current and future impact on the telecoms industry. The report identifies the areas and options for competition and co-operation, and outlines potential strategies for interacting with each player. It also draws the combined activities of the digital empires – telcos, so called ‘OTT players’ and others – into the context of the new ‘Great Game’, the battle for power and value in the emerging digital economy. (Page updated February 2012, report published November 2011, Dealing with Disruption stream) Google Apple Facebook Microsoft Skype Amazon Telco 2.0 Disruptor Report Cover

Digital Entertainment 2.0: A summary of the findings of the Digital Entertainment 2.0 workshop, 8th November 2011, held in the Guoman Hotel, London.
Digital Entertainment 2.0: Event Summary Analysis Presentation