
Telco 2030: New purpose, strategy and business models for the Coordination Age
How telecoms industry CEOs can reignite growth, align investors, employees, customers and governments, and reinvigorate the industry for the next decade.

How telecoms industry CEOs can reignite growth, align investors, employees, customers and governments, and reinvigorate the industry for the next decade.

Uber and Tesla are at the forefront of a new age of personal transportation in which wireless connectivity will play a major role. Both of these disruptors could be important partners for telcos, while offering lessons about consumer engagement, relationships with regulators and strategic thinking.

All telcos know they need to change. We believe the defining characteristic of those that will grow most is a clear focus on where and how they can create value beyond connectivity. This report lays out the two viable paths forward, and six steps all telcos must take in this new version of the Telco 2.0 vision.

With Multi-Access Edge Computing (MEC), telcos can move workloads and applications closer to customers, potentially enhancing experiences and enabling a plethora of new use cases. But with competition looming from other players, telcos need to start commercialising MEC. We have identified and modelled five viable telco business models.

Telcos can draw ten lessons around organisational structure, strategy and staying relevant with customers from AccorHotels’ rapid digital transformation. This is the second in our series of transformation case studies from outside the telecoms sector.

M&A is a key tool in building digital businesses, but is the telco sector investing enough? We examine the key drivers and barriers to telco digital M&A strategies, comparing investment levels to other verticals, and compare and contrast M&A activity with our previous findings.

Developing new digital services is a key growth strategy to make up for Voice revenue decline, but many telcos are struggling to implement it effectively. NTT DoCoMo has made more progress in digital services than any other operator, but is often dismissed as an example because Japan is considered “too different” to be useful for other operators. We disagree with this assumption and highlight key lessons that operators can learn from NTT DoCoMo’s digital journey.

The quality of experience delivered by operators’ mobile data networks is a key indicator of their current performance, and a foundation of their future prospects in digital. Our MobiNEX ranking, updated this week for H1 2016, shows how 80 operators in 25 countries compare. How does your telco stack up?

This report explores how Net Neutrality legislation has evolved significantly, looking at the general shape and specifics in the EU, US, India, Brazil and other territories. In general telcos can differentiate some aspects of broadband access with pricing or “specialized services”, but Internet app-blocking or paid-priority are disallowed. While legal challenges are ongoing, the way ahead seems much clearer, and we explore how telcos should focus on and enable interesting non-Internet connectivity opportunities around 5G, NFV and IoT.

Software-Defined Wide Area Networks (SD-WANs) have catapulted to prominence in the enterprise networking world in the last 12 months, driven by the growth of demand for access to cloud applications, and businesses’ desire to control WAN costs and complexity. SD-WAN may be a new “intermediary” layer in the network which has the potential to disrupt telcos’ enterprise aspirations, particularly given that it is dominated by vendors and specialist providers rather than telcos. SD-WAN may reduce operators’ MPLS and WAN services revenues and could potentially restrict future NFV/SDN opportunities. But SD-WAN also offers opportunities, where it is embraced – tactically – as part of operators’ enterprise portfolios.

We analyse the aggressive strategy Telstra has chosen to develop its digital healthcare business – which relies heavily on acquisitions across the whole eHealth value chain – and discuss how this fits into a wider companywide digital strategy, what it will take for Telstra to succeed in this vertical, and what insights other telcos can take away about their own digital health strategies.

For the first time, STL Partners quantifies the customer ‘app experience’ on twenty-seven mobile networks in seven countries. MobiNEX – The Mobile Network Experience Index – benchmarks mobile operators’ network speed and reliability by measuring download speed; average latency; error rate and latency consistency. It’s based on billions of real customer data points provided by our partners Apteligent. Congratulations to the top three performers – Bouygues, Free and Orange (all in France).

Partnering is a key competence for building telco digital services offerings, but many past attempts have failed. So what does it take to succeed? In this briefing we review viable strategies, key success factors and barriers, and profile the highly effective approach used in AT&T’s Drive Ecosystem.

The last few years have seen attempts by many leading telecoms operators to refresh their business model and generate new sources of growth and value. Now many digital initiatives are being scaled back. Telefonica and Telenor, two companies in the vanguard of the ‘drive to digital’ have both disbanded their digital organisations. In the first of two reports, STL Partners explores why efforts to yoke platform and product innovation businesses to a traditional infrastructure business have proved so difficult. The financial and operational constraints associated with traditional telecoms – particularly the need for long investment cycles in ‘one-function’ infrastructure – have made achieving the switch to ‘agile digital innovation’ all but impossible. But all that may be about to change and the future could be a little brighter.
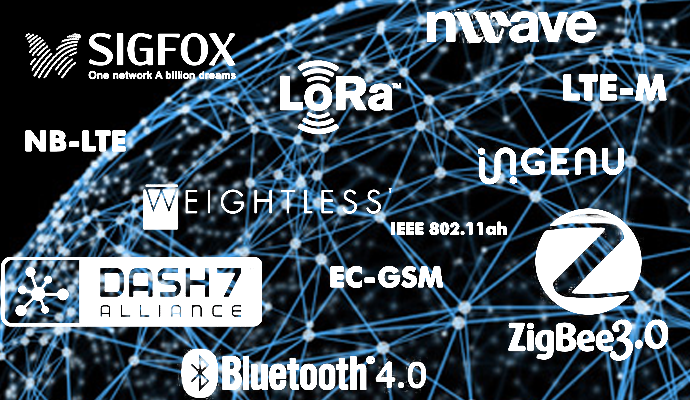
It’s reasonably clear that standard cellular networks will only carry a fraction of the data of the Internet of Things (IoT), but how should telcos be involved in the fast growing range of low cost, disruptive networks that will carry the bulk? We examine the alternatives and outline strategic options.
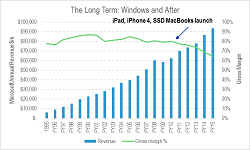
Microsoft faces the post-monopoly era, having had to write off its $8bn adventure in mobile and cope with significant disruption across the piece. Collaboration and communications are key to its new strategy, leading to significant implications for telcos and others.
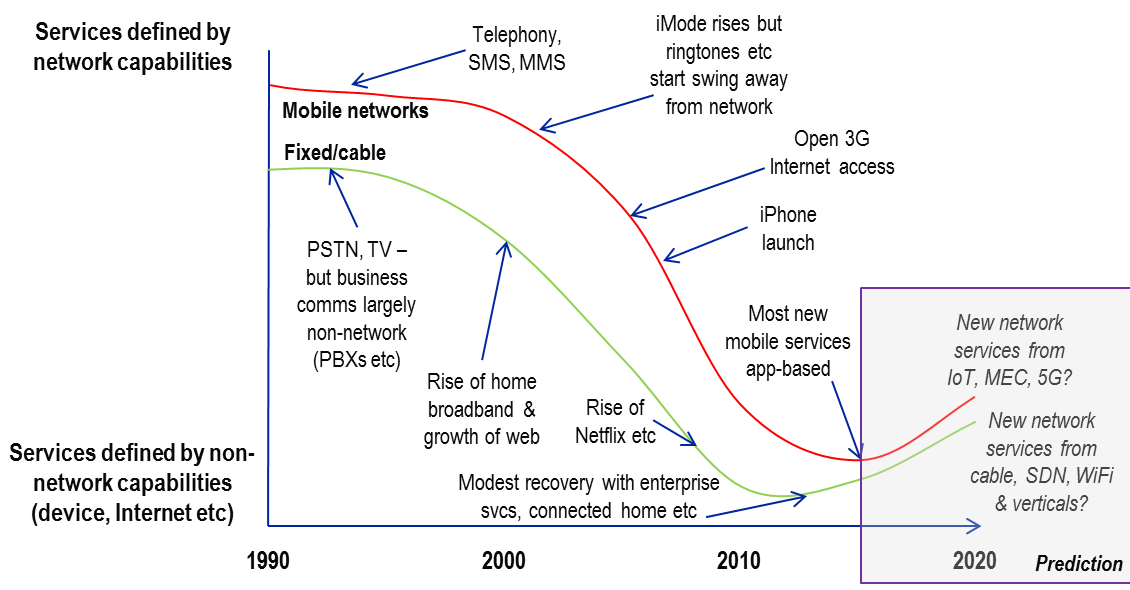
Enthusiasm for creating novel so-called “digital” services is pervasive in the telecoms industry. There is a major shift afoot in the way telcos create, integrate, sell and manage value-added propositions. But how much is enabled by – or dependent on – the network itself? In recent years, most investment has been solely for improved connectivity, but there are signs that future network capex might drive new service opportunities directly, rather than just by empowering 3rd parties.