
Telco roadmap to net-zero carbon emissions: Why, when and how
Based on discussions with 40 service providers (SPs) this report explores the challenges, priorities, strategies and best practices they identified around reducing carbon emissions.

Based on discussions with 40 service providers (SPs) this report explores the challenges, priorities, strategies and best practices they identified around reducing carbon emissions.

Updated analysis of STL Partners’ NFV deployment tracker. What have Europe’s major telcos done, how are vendors faring, and who leads the pack?
A small and surprising set of national operators are delivering outstanding performance in the challenging European market. Our analysis shows how they’re achieving differentiation with smart strategies that target the hottest customer need, and the considerable ramifications for the rest of the market.

The unveiling of Apple Pay and unravelling of Weve (the UK operators’ payments venture) looked like bad news for telcos’ ambitions in mobile payments in some markets, and highlighted challenges to Google and others’ models. Yet there are already successful telco models and favourable market trends that telcos should exploit. So what are the opportunities now?
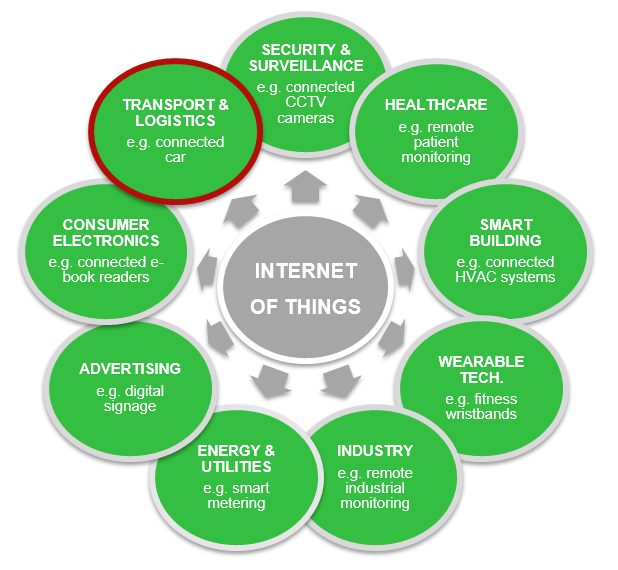
Connected cars are set to revolutionise the automotive industry as we know it, turning the car into the ‘ultimate mobile device’ and driving the growth of M2M in a big way. With Apple, Google, telcos and many others in the chase, we analyse the growth drivers, value chain, and key battles for control of this increasingly complex ecosystem, and outline a new connected car services framework.
Free’s shock bid for T-Mobile USA will stretch its finances and management capacity to the limit. Can Free’s package of tactics, technology, and procedures work in the US context?
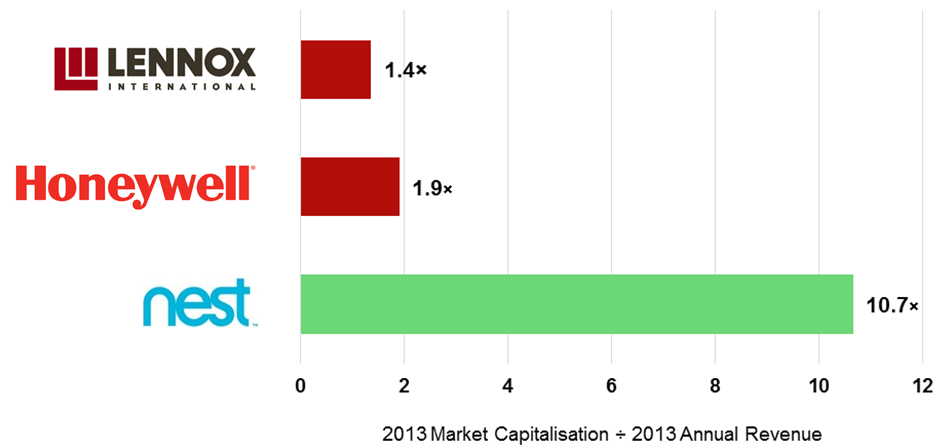
Since Google acquired Nest for $3.2bn, Apple and Samsung have also entered the complex battle for the connected home. We analyse in-depth why Google wanted Nest, the players’ goals and strategies, and what should telcos and others do to stay in the game?
Facing lockout from a growing chunk of the Internet and mounting competition from the Facebook-Microsoft alliance and Amazon, Google’s core business is under intense pressure. The search giant’s response is to innovate, offering consumers proactive recommendations, as well as reactive search results. Once an interesting sideline, Google Now has become fundamental to the Mountain View company’s future. Is the suggestion service good enough to maintain Google’s position as the world’s leading big data company?
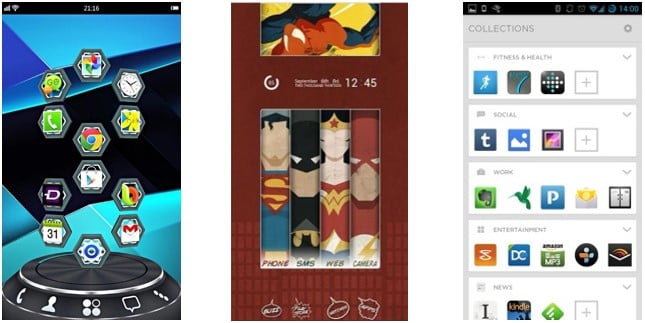
A launcher is a customizable home screen for an Android device that allows users to reorganize, customize and interact with their device. Launchers are gaining popularity, with Facebook, Google, Twitter and Yahoo all having either acquired or developed their own versions, but the market is fragmented with different launchers providing different functionality, services and monetization methods. Our latest analysis shows how telcos should seek to explore this area to help them establish more relevance in the digital ecosystem.
T-Mobile USA’s ‘uncarrier’ strategy has delivered significant net additions, but is it a good strategy – and is the disruption promised by Softbank CEO Masayoshi Son already underway? We compare it to Free Mobile’s disruptive approach in France, and the results of its competitors’ responses.

Digital transformation is now impacting every industry, and one of the hardest organisational challenges is developing small-scale innovations fast and managing them in large and mature organisations. Here are our recommendations and key findings from the OnFuture EMEA 2014 cross-industry brainstorm, including a summary of Facebook’s internal recipe for speedy success. (June 2014, Executive Briefing Service, Transformation Stream.)
Existing Business remains the biggest obstacle to innovation
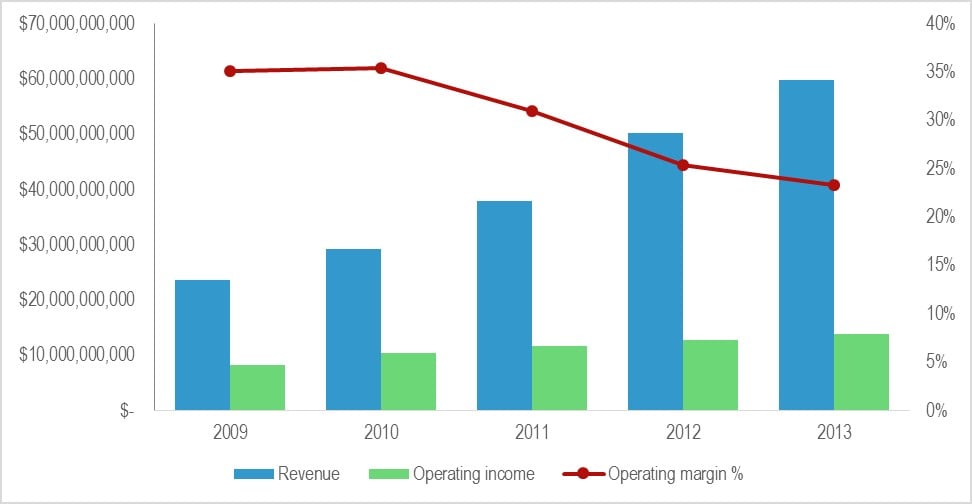
Verizon and Comcast have invested in high bandwidth fibre and cable networks, whereas AT&T has until recently focused on U-Verse, an IPTV play. Which strategy is winning out and why? The answer is surprising and may transform the US and other markets, and there are parallels with Apple and Samsung’s ‘deep value’ strategies of investing in assets that are hard to replicate.
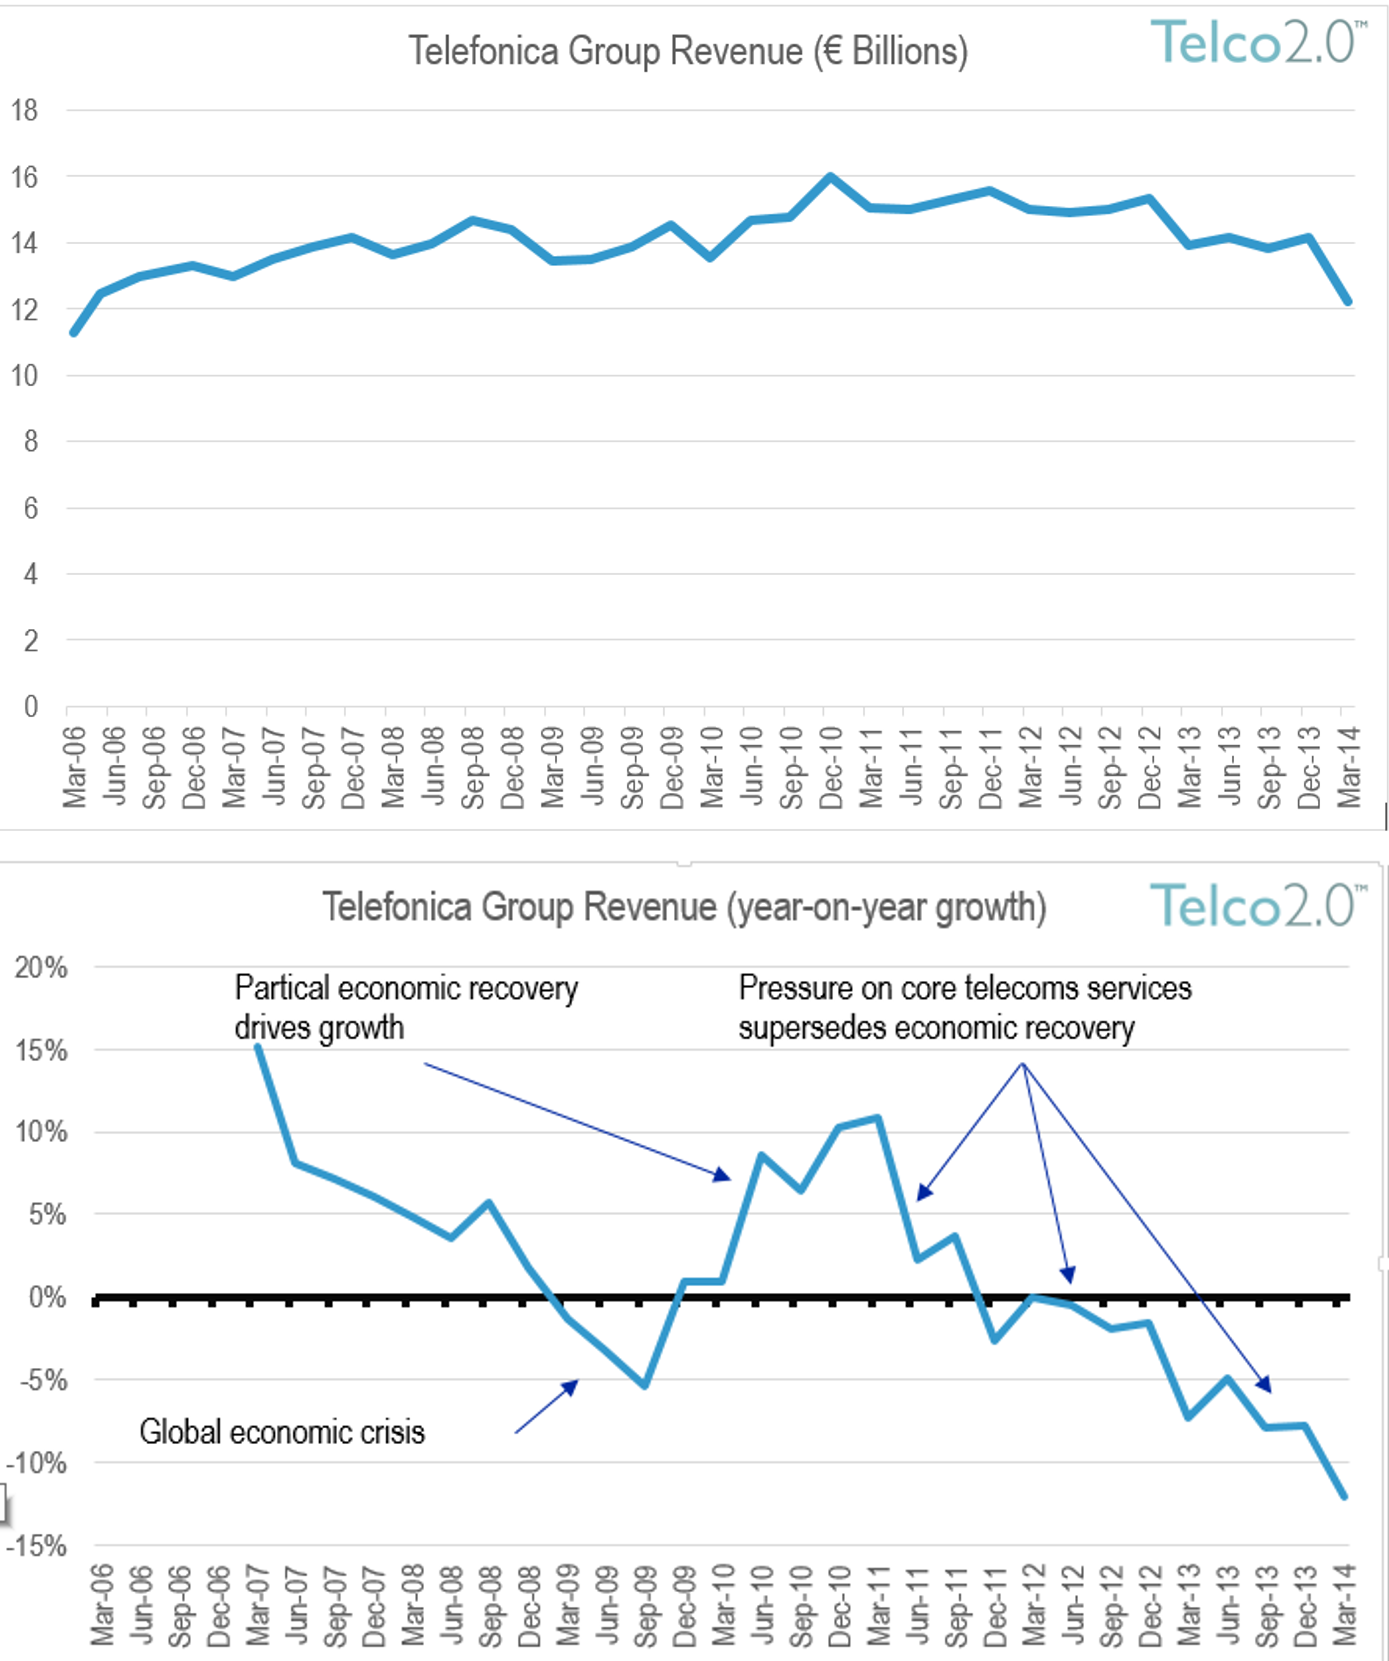
The latest results for Telefonica are grim, showing a 12% y-o-y revenue decline, following Orange and Deutsche Telekom’s 4% drops. This signals unequivocally that transformation is now a necessity not a luxury for European operators – and the rest of the world is not far behind. Longer term recovery is possible but not a certainty – what are the key steps? (May 2014, Foundation 2.0, Executive Briefing Service, Telco 2.0 Transformation Stream.)
Enterprise Mobility Framework December 2013
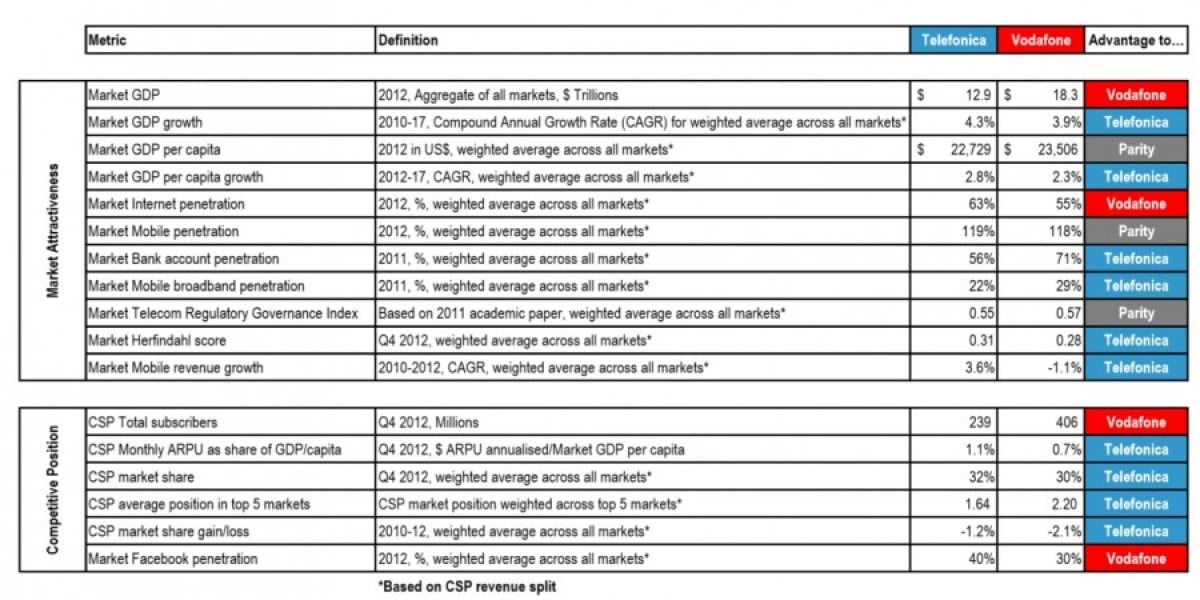
In this new report based on Telco 2.0 Transformation Index analysis we compare Vodafone’s competitive positioning with another European-centric multi-national, Telefonica. The results are surprising and instructive, showing that Vodafone faces substantial challenges if it is to grow in the foreseeable future.

We see five major trends leading towards the overall picture of the ‘software defined operator’ – an operator whose boundaries and structure can be set and controlled through software. This presents threats as well as opportunities for industry players selling and wanting to sell to telcos.
Albeit pioneering, Telefonica’s Digital business unit as was lacked focus and combined too many clashing cultures and incompatible businesses. Our latest analysis sees the change as ‘the end of the beginning’ for Telefonica’s Telco 2.0 services, and summarises lessons for all players implementing strategic transformation.
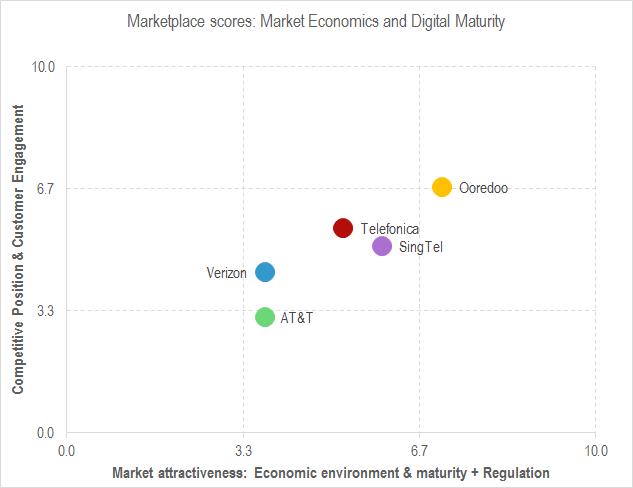
Operators face difficult choices on the best way to change their business models. In this note we analyse the approaches taken by AT&T, Verizon, Ooredoo, Singtel and Telefonica, extrapolate the options for all carriers, and offer a framework to help managers define the right new business model goal for their organisation.