Telco 2.0 Transformation Index: Technology Survey

Summary: 150 senior execs from Vodafone, Telefonica, Etisalat, Ooredoo (formerly Qtel), Axiata and Singtel supported our technology survey for the Telco 2.0 Transformation Index. This analysis of the results includes findings on prioritisation, alignment, accountability, speed of change, skills, partners, projects and approaches to transformation. It shows that there are common issues around urgency, accountability and skills, and interesting differences in priorities and overall approach to technology as an enabler of transformation. (November 2013, Executive Briefing Service, Transformation Stream.) Telco 2.0 Transformation Index Tech Survey Cover Small
  Read in Full (Members only)   To Subscribe click here

Below are a brief extract and detailed contents from a 29 page Telco 2.0 Briefing Report that can be downloaded in full in Powerpoint slideshow format by members of the Premium Telco 2.0 Executive Briefing service and the Telco 2.0 Transformation stream here.

This report is an extract from the overall analysis for the Telco 2.0 Transformation Index, a new service from Telco 2.0 Research. Non-members can find out more about subscribing to the Briefing Service here and the Transformation Index here. There will be a world first preview of the Telco 2.0 Transformation Index at our Digital Arabia Executive Brainstorm in Dubai on 11-13th November 2013. To find out more about any of these services please email contact@telco2.net or call +44 (0) 207 247 5003.

To share this article easily, please click:


Introduction


Details of the objectives and key benefits of the overall Telco 2.0 Transformation Index can be found here, and the methodology and approach here. There’s also an example of Telefonica’s market position here.

One component of our analysis has been a survey of 150 senior execs on the reality of developing and implementing technology strategy in their organisations, and the results are now available to download to members of the Telco 2.0 Executive Briefing Service.

Key Benefits

  • The report’s highly graphical and interactive Powerpoint show format makes it extremely easy to digest and reach valuable insights quickly
  • The structure of the analysis allows the reader to rapidly and concisely assimilate the complex similarities and differences between players
  • It is underpinned with detailed and sourced numerical and qualitative data


Example charts from the report

The report analyses similarities and differences in priorities across the six players.Telco 2.0 Transformation Index - Tech Prioritisation Differences - Singtel, Axiata, Vodafone, Telefonica, Etisalat, Ooredoo


It also assesses the skills profiles of the players against different strategic areas.

Telco 2.0 Transformation Index - Technology Skills analysis, Telefonica, Vodafone, Etisalat, Ooredoo, Axiata, Singtel
Contents

To access the contents of the report, including…

  • Introduction and Methodology
  • Background – the Telco 2.0 Transformation Index
  • Executive Summary
  • Survey respondents
  • Drivers of network and IT projects
  • Degree of challenge of ‘Transformation’ by operator
  • Priority areas for Transformation by operator
  • What are the preferred project approaches for transformation?
  • Alignment of techology and commercial priorities
  • Accountability for leveraging and generating value from technology projects
  • IT Skills – ‘Telco 1.0’ Vs ‘Telco 2.0’
  • Nature of strategic partnerships by operator
  • Technology project life-cycles by operator
  • Groupings by attitude to technology as a driver of success
  • Priority areas for technological improvement or transformation

Members of the Telco 2.0 Executive Briefing Subscription Service and the Telco 2.0 Transformation stream can download the full 29 page report in interactive Powerpoint slideshow format hereNon-Members, please subscribe here. For other enquiries, please email contact@telco2.net / call +44 (0) 207 247 5003.

Cloud 2.0: Securing Trust to Survive the ‘One-In-Five’ CSP Shake-Out

Summary: The Cloud market is on the verge of the next wave of market penetration, yet it’s likely that only one in five Cloud Service Providers (CSPs) in today’s marketplace will still be around by 2018, as providers fail or are swallowed up by aggressive competitors. So what do CSPs need to do to survive and prosper? (October 2013, Foundation 2.0, Executive Briefing Service, Cloud & Enterprise ICT Stream.) Technology adoption rates Sept 2013


Introduction: one in five Cloud providers will survive 

The Cloud market is on the verge of the next wave of market penetration, yet it’s likely that only one in five Cloud Service Providers (CSPs) in today’s marketplace will still be around by 2018, as providers fail or are swallowed up by aggressive competitors. So what do CSPs need to do to survive and prosper?

This research was sponsored by Trend Micro but the analysis and recommendations represent STL Partners’ independent view. STL Partners carried out an independent study based on in-depth interviews with 27 senior decision makers representing Cloud Service Providers and enterprises across Europe. These discussions explored from both perspectives cloud maturity, the barriers to adoption and how these might be overcome. The findings and observations are detailed in this three-part report, together with practical recommendations on how CSPs can address enterprise security concerns and ensure the sustainability of the cloud model itself.

Part 1: Cloud – coming of age or troubled adolescent?

While the concept of organising computing as a utility dates back to the 1960s, the cloud computing model as we know it today is built on the sub-classifications of Infrastructure as a Service (IaaS), Platform as a Service (PaaS) and Software as a Service (SaaS).

We’ve covered telcos’ role in Cloud Services in depth in our Cloud research stream, and found that hype, hope and uncertainty have been notable features of the early stages of development of the market, with many optimistic forecasts of adoption being somewhat premature.

In terms of the adoption cycle adoption today, our analysis is that Cloud Services are on the brink of ‘the chasm’: well established among early adopters but less well known, trusted and used by the mass market segment of the enterprise market.

Building trust among new customer segments is the key to bridging this gap. For the industry it is a make or break point in terms of achieving scale. For CSPs, trust will be a key to survival and prosperity in the next phase of the market, enabling them to open up new opportunities and expand the amenable market, as well as to compete to retain and grow their individual market shares.

Many of the obstacles to and inhibitors of cloud adoption stem from customers’ perceptions of product immaturity – “will it be safe and work how we want without too much hassle and commitment?” In this report we examine findings on the general inhibitors and drivers of adoption, and then those related to the main inhibitor, data security, and how they might be addressed.

Overcoming the obstacles

Enterprise decision-makers in the study admitted to being deterred from the cloud by the prospect of migration, with the “enterprise/cloud barrier” perceived as a significant technical hurdle. While CSPs with enterprise-grade propositions have in place the business model, margins and consultative resources to offer customers an assisted journey to the cloud, standard public offerings are provided on a Do-It-Yourself basis.

However, data privacy and security remain the biggest inhibitors to cloud adoption among enterprises, due in no small part to a perceived loss of visibility and control.  Recent headline-grabbing events relating to mass surveillance programmes such as PRISM have only served to feed these fears.  As will be seen in this report, a lack of consistent industry standards, governance and even terminology heightens the confusion. Internal compliance procedures, often rooted in an out-dated “physical” mind-set, fail to reflect today’s technological realty and the nature of potential threats.

According to the UK Department for Business Innovation & Skills, the direct cost of a security breach (any unauthorised access of data, applications, services, networks or devices) is around £65,000 for SMEs and £850,000 for larger enterprises. However, add to this financial penalties for failure to protect customer data, reputational damage, diminished goodwill and lost business, and the consequential losses can be enough to put a company out of business.  It’s little wonder some enterprises still regard cloud as a risk too far.

In reality, CSPs with a heritage in managed services and favourable economies of scale can typically match or better the security provisions of on-premise data centres.  However, as “super enterprises” they present a larger and therefore more attractive target for malicious activity than a single business.  There is simply no room for complacency.

CSPs must shift their view of security from a business inhibitor to a business enabler: crucial to maintaining and expanding the overall cloud market and confidence in the model by winning customer trust.  This requires a fundamental rethink of compliance – both on the part of CSPs and enterprises – from a tick-box exercise to achieve lowest-cost perimeter protection to cost effectively meeting the rigorous demands of today’s information-reliant enterprises.

Cloud services cannot be considered mature until enterprises en masse are prepared to entrust anything more than low-sensitivity data to third party CSPs.  The more customer security breaches that occur, the more trust will be undermined, and the greater the risk of the cloud model imploding altogether.

State of the nation

The journey to the cloud is often presented in the media as a matter of “when” rather than “if”.  However, while several CSPs in our study believed that the cloud model was starting to approach maturity, enterprise participants were more likely to contend that cloud was still at an experimental or “early adopter” stage.

The requirements of certain vertical markets were perceived by some respondents to make cloud a non-starter, for example, broadcasters that need to upload and download multi-terabyte sized media files, or low-latency trading environments in the financial sector.  Similarly, the value of intellectual property was cited by pharmaceutical companies as justifying the retention of data in a private cloud or internal data centre at any cost.

CSPs universally acknowledged that their toughest competitor continues to be enterprises’ own in-house data centres.  IT departments are accustomed to having control over their applications, services, servers, storage, network and security. While notionally, they accept they will have to be less “hands on” in the cloud, a lack of trust persists among many. This reticence was typically seen by CSPs as unwarranted fear and parochialism, yet many are still finding it a challenge to educate prospective customers and correct misconceptions. CSPs suggested that IT professionals may be as likely to voice support for the cloud as turkeys voting for Christmas. However, more enlightened IT functions have embraced the opportunity to evolve their remit to working with their CSP to monitor services against SLAs, enforce compliance requirements and investigate new technologies rather than maintaining the old.

For tentative enterprises, security is still seen as a barrier to, rather than an accelerant of, cloud adoption, and one of the most technically challenging issues for both IT and compliance owners. Enterprises that had advanced their cloud strategy testified that successful adoption relies on effective risk management when evaluating and engaging a cloud partner. Proponents of cloud solutions will need compelling proof points to win over their CISO, security team or compliance officer.  However, due diligence is a lengthy and often convoluted process that should be taken into account by those drawn to the cloud model for the agility it promises.

The majority of CSPs interviewed were relatively dismissive of customer security concerns, making the valid argument that their security provisions were at least equal to, if not better than, that of most enterprise data centres.  However, as multiple companies concentrate their data into the hands of a few CSPs, the larger and more attractive those providers become to hackers as an attack target. Nonetheless, CSPs rarely offer any indemnification against hacking (aside from financial compensation for a breach of SLA) and SaaS providers tend to be more obscure than IaaS/PaaS providers in terms of the security of their operations.  Further commercial concerns explored in this report relate to migration and punitive contractual lock-in. Enterprises need to feel that they can easily relocate services and data across the cloud boundary, whether back in house or to another provider.  This creates the added challenge of being able to provide end-to-end audit continuity as well as in transit.

There are currently around 800 cloud service providers (CSPs) in Europe.  Something of a land grab is taking place as organisations whose heritage lies in software, telecoms and managed hosting are launching cloud-enabled services, primarily IaaS and SaaS.

However, “cloudwashing” – a combination of vendor obfuscation and hyperbole – is already slowing down the sales cycles at a time when greater transparency would be likely to lead to more proofs of concept, accelerated uptake and expansion of the overall market.

Turbulence in the macro economy is exacerbating the problem: business creation and destruction are among the most telling indicators of economic vitality.  A landmark report from RSM shows that the net rate of business creation (business births minus deaths) for the G7 countries was just 0.8% on a compound annual basis over the five-year period of the study. The BRICs, by contrast, show a net rate of business creation of 6.2% per annum – approximately eight times the G7 rate.

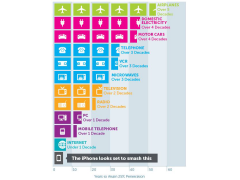
In parallel, the pace of technology success is accelerating.  Technologies are considered to have become “mainstream” once they have achieved 25% penetration. As cloud follows this same trajectory, with a rash of telcos, cable operators, data centre specialists and colocation providers entering the market, significant consolidation will be inevitable, since cloud economics are inextricably linked to scale.

Figure 1 – Technology adoption rates
Technology Adoption Rates Sept 2013

Source: STL Partners

Lastly, customers are adapting and evolving faster than ever, due in no small part to the advent of social media and digital marketing practices, creating a hyper-competitive environment.  As a by-product, the rate of business failure is rising.  In the 1950s, two-thirds of the Fortune 500 companies failed. Throughout the 1980s, almost nine out of ten of the so-called “Excellent” companies went to the wall, and 98% of firms borne out of the “Dot Com” revolution in the late 1990s are not expected to survive.

As a result, STL Partners anticipates that by 2018, a combination of consolidation and natural wastage will leave only 160 CSPs in the marketplace – a survival rate of one in five.

Drivers of cloud adoption

The business benefits of the cloud are well documented, so the main value drivers cited by participants in the study can be briefly summarised as follows:

Figure 2 – Business and IT Drivers of cloud adoption
Business and IT Drivers of cloud adoption Sept 2013

Report Contents

  • Introduction: one in five Cloud providers will survive
  • Part 1: Cloud – coming of age or troubled adolescent?
  •    Overcoming the obstacles
  •    State of the nation
  •    Drivers of cloud adoption
  •    Inhibitors to cloud adoption
  •       Cloud migration and integration with internal systems
  •       Vendor lock-in and exit strategies
  •       Governance and compliance issues
  •       Supplier credibility and longevity
  •       Testing and assurance
  • Part 2: Cloud security and data privacy challenges
  •    Physical security
  •    Data residency and jurisdiction
  •    Compliance and audit
  •    Encryption
  •    Identity and Access Management
  •    Shared resources and data segregation
  •    Security incident management
  •    Continuity services
  •    Data disposal
  •    Cloud provider assessment
  •    Industry standards and codes of practice
  •    Migration strategy
  •    Customer visibility
  • Part 3: Improving your ‘security posture’
  •    The ethos, tools and know-how needed to win customers’ trust
  •    The Four Levels of Cloud Security
  • Key take-aways for Cloud Services Providers
  • About STL Partners
  • About Trend Micro

Table of Figures

  • Figure 1 – Technology adoption rates
  • Figure 2 – Business and IT Drivers of cloud adoption
  • Figure 3 – Information security breaches 2013
  • Figure 4 – The four levels of Cloud security
  • Figure 5 – A 360 Degree Framework for Cloud Security

Finding the Next Golden Egg: Sourcing Great Telecoms Innovations

The telco innovation problem…

The challenge facing the telecoms industry has been well documented (not least by STL Partners). The solution, the need for telcos to develop a new telecoms ’business model’ is also now generally accepted. For some, the new business model may entail eschewing service development and instead focusing on cost efficiency and network performance – the Telco 2.0 Happy Piper.

For many, however, the desire to compete in the ‘services layer’ remains strong. These would-be Telco 2.0 Service Providers must seek to replace the contracting voice and messaging revenue streams with new revenues from new products and services and customers.

How to develop these new products and services and customer relationships is the $1 trillion question for telcos and their partners.

STL Partners has spent much time exploring both the nature of new opportunities and the processes for realising them. The problem for telcos is that they are not natural innovators. Their raisin d’etre historically has been to build infrastructure and generate returns from services that were only available because they owned and controlled the infrastructure – voice, messaging, and connectivity. The result was very low levels of innovation in telecoms but stable high-margin returns from ‘protected services’.

The Internet has changed the game. Now, voice and messaging and other communications services are available from alternate service providers – the internet giants and start-ups in particular. These new players have innovation in their DNA – they are product and service-oriented; they have sexy brands; they understand the value of customer data and how to exploit it; with lower capital expenditures, they can generate returns on investment with much lower margins.

…and one part of the solution addressed in this report

For telcos to develop competitive enabling or end-user services, whether consumer or enterprise, they need to develop the same skills and relationships enjoyed by the new competitors. As we discuss at length A Practical Guide to Implementing Telco 2.0 and we measure in the forthcoming Telco 2.0 Transformation Index, this requires a fundamental business model transformation that encompasses the whole telco industry: services, organisation structure and processes, partnerships, technology, and the cost and revenue model.

Rather than cover all the elements of the transformation, this report focuses narrowly on the process of developing compelling new propositions and services that deliver what customers want better than existing available solutions. It is based on a simple premise: that innovation and creativity is based on ‘associative thinking’ – the ability to link together ideas and concepts. For example, it was associative thinking in 2006 that led Apple’s iPhone designers to spot how an accelerometer – a widely used device in the transport, construction and medical industries – could be integrated into an iPhone to manage automatic screen rotation and countless applications we now take for granted on mobile.

Two ‘associative thinking’ approaches to identifying Telco 2.0 innovations

1. Existing tried and tested solutions

Rather than start with a blank sheet of paper, one way to innovate is to copy solutions that others have brought to market successfully. This does not necessarily imply a ‘me too’ approach entirely as there is scope, or course, to improve the solutions that others have created. In fact, most innovations are actually an extension of an existing product or service. For example:

  • Apple’s iPhone, with its capacitive screen and integrated content ecosystem was a massive improvement on previous smartphones but clearly drew on early work done by, for example, Nokia with its 9210 Communicator and Ericsson with the R380.
  • Google’s powerful search algorithm and clean user interface contrasted with the clutter of earlier search sites such AltaVista but also built on their idea of helping people find things on the web. Interestingly, AltaVista has now made a comeback with a slick clean interface that looks remarkably similar to Google!

If there is value in taking another firm’s idea and improving it, what are the sources of such concepts for CSPs?

STL Partners sees three main ones:

1. Your local telecoms market.

Scan the offerings of your competitors and if you spot something that looks attractive or seems to be getting traction in the marketplace, find ways to improve it and launch a better competitive offering yourself. You may remember in the view of Telefonica and Vodafone we mentioned that Freebees was a copy of O2’s earlier Top-up Surprises. Two important points here that Vodafone failed to do:

  • Follow fast. The Freebees programme was launched around three years after Top-up Surprises and so Vodafone missed out on being seen as an innovator. Vodafone also missed out on the financial benefits that O2 enjoyed in those intervening years.
  • Improve the original concept. Freebees is fine but fails to materially improve on what was offered by O2 – rewards for customers that top-up their prepay account.

2. The global telecoms market.

Look outside your market to other geographies to see what has worked in other parts of the world and then explore how these solutions might work in your own market. Clearly, you need to make allowance for different local customs and behaviours, industry structures, regulations and so on but the global nature of (tele)communications means that things that have worked in one market can often be easily adapted to others. STL Partners carries out this global scouting service for clients looking at what is available from other CSPs, vendors and start-ups and believes it is a sensible low-risk strategy for many CSPs – see on page 17 of this document, for more details.

Contents

To access the contents of the report, including…

  • The telco innovation problem…
  • …and one part of the solution addressed in this report
  • Two ‘associative thinking’ approaches to identifying Telco 2.0 innovations
  • 1. Existing tried and tested solutions
  • 2. Customer Goal-led Innovation (CGLI)
  • Case study on identifying Telco 2.0 innovations: The STL Partners scouting service
  • About STL Partners

…and the following table of exhibits…

  • Figure 1: Sources for tried and tested Telco 2.0 solutions
  • Figure 2: The limitations of asking customers what they need when innovating, some examples
  • Figure 3: How Customer Goal-led Innovation focuses on real needs and uncovers innovation opportunities
  • Figure 4: The STL Partners’ Customer Goal-led Innovation process
  • Figure 5: Producing a customer activity map to support a goal statement
  • Figure 6: Customer goal-led innovation – activity analysis table, example
  • Figure 7: Identifying opportunity areas for innovation, example
  • Figure 8: The STL Partners scouting service in a nutshell

Telco 2.0 Transformation Index: Understanding Telefonica’s Markets and Market Position

Summary: This extract from the Telco 2.0 Transformation Index shows our analysis of Telefonica’s markets and market position, including economic and digital market maturity, regulation, customers, competition and pricing. It is one part of our overall analysis of Telefonica’s progress towards transformation to the Telco 2.0 business model. The other parts of the Telefonica analysis are: Service Proposition, Finances, Technology, Value Network, and an overall summary. Telefonica is one of the companies analysed and compared in the first tranche of analysis that also addresses Vodafone, AT&T, Verizon, Axiata, SingTel, Etisalat and Ooredoo (formerly Qtel). (August 2013, Executive Briefing Service, Transformation Stream.) Telefonica Telco 2.0 Transformation Index Small

Introduction


Details of the objectives and key benefits of the overall Telco 2.0 Transformation Index can be found here, and the methodology and approach here.

Telefonica is one of the first companies featured in our Transformation Index, and one that is viewed with great interest by others. With operating companies facing very different conditions in Europe and South America, Telefonica faces some interesting strategic challenges, and has attempted to stimulate growth through innovation with the development of Telefonica Digital.

The ‘Markets and Position’ section of the analysis puts Telefonica’s current global position, risks and opportunities in context, and is now available to download to members of the Telco 2.0 Executive Briefing Service. The rest of the analysis (covering Service Proposition, Value Network, Technology and Finances), and the analyses of the other seven companies initially covered (Vodafone, AT&T, Verizon, Etisalat, Ooredoo [formerly Qtel], Singtel and Axiata) will be published from September 2013.

Key Benefits

  • The report’s highly graphical format makes it extremely easy to digest and reach valuable insights quickly into both Telefonica’s current position and future strategic needs
  • The structure of the analysis allows the reader to rapidly and concisely assimilate the complex picture of Telefonica’s international businesses, risks and opportunities
  • It is underpinned with detailed and sourced numerical and qualitative data


Example charts from the report

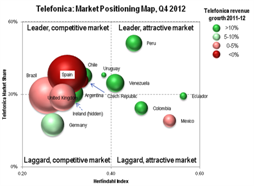
The report analyses Telefonica’s market share position across markets against their regulatory strength.
Telco 2.0 Transformation Index - Market Positioning Detail


It also assesses the economic and demographic make-up of Telefonica’s markets.

Telco 2.0 Transformation Index - Market Analysis Detail Example, Telefonica

The market analyses are consolidated into an overall summary of market positioning by Operating Company, which is further refined into an assessment of strategic approach and operational performance.

Telco 2.0 Transformation Index - Market Share and Profitability Detail


Contents

To access the contents of the report, including…

  • Introduction and Methodology
  • Market Position Summary: Economic, Regulatory, Competitive and Customers
  • Summary analysis of growth, GDP, prices and economics of key markets
  • Comparison and contrasts between European and Latin American markets
  • Regulation vs EBITDA margins
  • Mobile revenue growth by market
  • Subscribers and revenues by region
  • Mari-Meko of Subscribers and Shares in key markets
  • Market Share Vs. Regulation
  • Market Vs. Telefonica Growth by national market
  • Telefonica’s commercial strategy
  • Strength of OTT entrants in Telefonica’s markets
  • Pre-Pay, Post-Pay and Churn by Market
  • Telefonica’s relative brand strength


Cloud 2.0: Network Functions Virtualisation (NFV) vs. Software Defined Networking (SDN)

Network Functions Virtualisation

What is Network Functions Virtualisation?

Network Functions Virtualisation (NFV)  is an ominous sounding term, but on examination relatively easy to understand what it is and why it is needed.

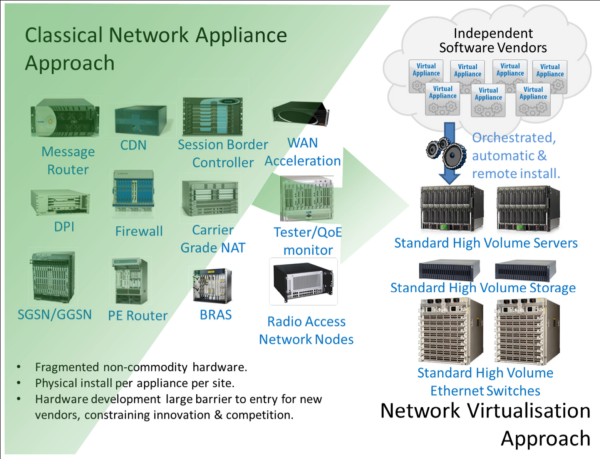
If you run a network whether as an enterprise customer or as a service provider you will end up a stack of dedicated hardware appliances performing a variety of functions needed to make the network work or to optimise its performance. Boxes like Routers, Application Load Balancers, Session Border Controllers (SBC), Network Address Translation (NAT), Deep Packet Inspection (DPI) and Firewalls to pick just a few. Each one of these hardware appliances needs space, power, cooling, configuration, backup, capital investment, replacement as they become obsolete and people who can deploy and manage them leading to on-going capex and opex. And with a few exceptions, each performs a single purpose, so a firewall is always a firewall or an SBC is always an SBC and neither can perform the function of the other.

Contrast this model with the virtualised server or cloud computing world where Virtual Machines run on standard PC/Server hardware, where you can add more compute power/storage on an elastic basis should you need it and where network cards are only required when you connect one physical device to another.

What problems does NFV solve?

NFV seeks to solve the problems of dedicated hardware by deploying the network functions on a virtualised PC/server environment. NFV started as a special interest group running under the auspices of the European Telecommunications Standards Institute (ETSI) by 7 of the world’s largest telecoms operators and has now been joined by additional telecoms companies, equipment vendors and a variety of technology providers.

While NFV can replace many dedicated hardware devices with a virtualised software platform, it is yet to be seen if this approach can deliver the sustained performance and low latency that is currently delivered by some specialised hardware appliances such as load balancing, real time encryption or deep packet inspection.

Figure 8 shows ETSI’s vision of NFV.

Figure 8 – ETSI’s vision for Network Functions Virtualisation
Network Virtualisation Approach June 2013

 Source ETSI

Report Contents

  • Network Functions Virtualisation
  • What is Network Functions Virtualisation?
  • What problems does NFV solve?
  • How does NFV relate to Software Defined Networking (SDN)?
  • Relative benefits of NFV and SDN
  • STL Partners and the Telco 2.0™ Initiative

Report Figures

  • Figure 8 – ETSI’s vision for Network Functions Virtualisation
  • Figure 9 – Network Functions Virtualised and managed by SDN
  • Figure 10 – Network Functions Virtualisation relationship with SDN

The Great Compression: surviving the ‘Digital Hunger Gap’

Introduction

The Silicon Valley Brainstorm took place on 19-20 March 2013, at the Intercontinental Hotel, San Francisco.

Part of the New Digital Economics Executive Brainstorm & Innovation Series, it built on output from previous events in Singapore, Dubai, London and New York, and new market research and analysis, and focused on new business models and growth opportunities in digital commerce, content and the Internet of Things.

Summary Analysis: ‘The Great Compression’

In the next 10 years, many industries face the ‘Great Compression’ in which, in addition to the pressures of ongoing global economic uncertainty, there is also a major digital transformation that is destroying traditional value and moving it ‘disruptively’ to new areas and geographies, albeit at diminished levels.

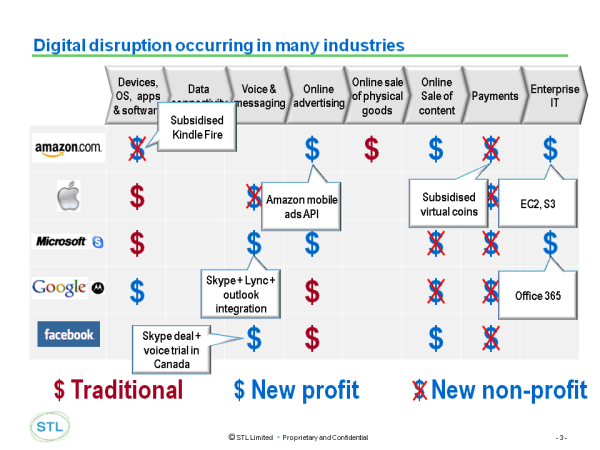
In previous analyses (e.g. Dealing with the ‘Disruptors’: Google, Apple, Facebook, Microsoft/Skype and Amazon) we have shown how key technology players in particular compete with different objectives in different parts of the digital value chain. Figure 1 below shows via crossed dollar signs (‘New Non-Profit’) the areas in which companies are competing without the primary intention of driving profits, which means that traditional competitors in those areas can expect ‘disruptive’ competition from new business models.

Figure 1 – Digital disruption
Digital disruption occurring in many industries Mar 2013

Source: STL Partners ‘Dealing with the ‘Disruptors’: Google, Apple, Facebook, Microsoft/Skype and Amazon’


The Digital Hunger Gap

For the incumbent industry players we call the near-term results of this disruption ‘The Digital Hunger Gap’ – the widening deficit between past and projected revenues. Chris Barraclough, Chief Strategist STL Partners presented the classic Music Industry case study of the ‘Hunger Gap’ effects of digital disruption.

Figure 2 – The Music Industry’s ‘Hunger Gap’
The Music Industry's ‘Hunger Gap’ Mar 2013

Source: STL Partners


In a vote, 95% of participants agreed that something similar would happen in other industries.

Chris then presented our initial analysis of the ‘Hunger Gap’ for telcos (to be published in full shortly), and asked the participants where they thought the telco industry would be relative to its 2012 position in 2020.

Figure 3 – Participants’ views on forecasts for the telecoms industry
Participants' views on forecasts for the telecoms industry Mar 2013

Source: Silicon Valley 2013 Participants / STL Partners


As can be seen, participants’ views were widely spread, with a slight bias towards a more pessimistic outlook than that presented of a recovery to 2012 levels.

Chris argued that as the ‘hunger gap’ widens, and before new revenues are developed, there will be massive consolidation and cost-reduction among incumbent players, and opportunities for innovation in services, but the chances of success in the latter are very low and require a portfolio approach and either deep pockets, exceptional insight, or considerable good fortune.

Richard Kramer, Managing Partner of Arete Research, also presented a deflationary outlook for all but the leading consumer technology players in the handset and tablet arena.

Participants then voted on which areas needed the most significant changes in their business – and existing managements’ ‘mindset’ was voted as the top priority.

Figure 4 – ‘Mindset’ is the biggest barrier to transformation
'Mindset' is the biggest barrier to transformation Mar 2013

Source: Silicon Valley 2013 Participants / STL Partners


It is also notable that all categories averaged 3.0 or over – or needing ‘Significant Change’. This points to a significant transformation across all industries.

Content:

  • Opportunities
  • Telco 2.0 Strategies
  • Big Data and Personal Data
  • Digital Commerce
  • Digital Entertainment
  • Mobile Advertising & Marketing
  • The Internet of Things
  • Outlook by Industry
  • Next Steps


  • Figure 1 – Digital disruption
  • Figure 2 – The Music Industry’s ‘Hunger Gap’
  • Figure 3 – Participants’ views on forecasts for the telecoms industry
  • Figure 4 – ‘Mindset’ is the biggest barrier to transformation
  • Figure 5 – The ‘Telco 2.0’ opportunities for CSPs
  • Figure 6 – The impact of ‘Software Defined Networks’ (SDN)
  • Figure 7 – Will ‘Personal Data’ be more useful than ‘Big Data’?
  • Figure 8 – STL Partners’ ‘Wheel of Digital Commerce’
  • Figure 9 – Who will in ‘SoMoLo’?
  • Figure 10 – Significant changes in viewing habits
  • Figure 11 – Transformation needed in the advertising industry
  • Figure 12 – Growth projections for M2M ‘mobile’ (e.g. 3G/4G) connected devices

Finance: Optimising the Telco 2.0 revenue and cost model

Summary: Structuring finances is key for the success of innovations in general and Telco 2.0 projects in particular. In this detailed extract from our new strategy report ‘A Practical Guide to Implementing Telco 2.0’, we describe the best ways to approach the management of revenues and costs of new business models, and how to get the CFO and finance department onside with the new approaches required (February 2013, Executive Briefing Service, Transformation Stream). Small table on finances
  Read in Full (Members only)  To Subscribe click here

Below is an extract from this 15 page Telco 2.0 Report that can be downloaded in full in PDF format by members of the Telco 2.0 Executive Briefing service and the Telco 2.0 Transformation Stream here. Non-members can subscribe here or other enquiries, please email contact@telco2.net / call +44 (0) 207 247 5003.

We’ll also be discussing our findings at the New Digital Economics Brainstorms in Silicon Valley, 19-20 March, 2013 and in EMEA 2013 in London, June 5-6.

Telco 2.0 has a different financial model to Telco 1.0

Cash Returns On Invested Capital (CROIC) is a good measure of company performance because it demonstrates how much cash investors get back on the money they deploy in a business. It removes measures that can be open to interpretation or manipulation such as earnings, depreciation or amortisation. In simple terms CROIC is calculated as:

Figure 1: Cash Returns On Invested Capital (CROIC)
CROIC Definition

While it is simplistic, STL Partners broadly sees the benefits of a Telco 2.0 Happy Pipe strategy accruing to a CSP in the form of higher EBITDA (Earnings Before Interest, Tax, Depreciation and Amortisation) margins (owing to lower costs) and lower capital expenditures. A Telco 2.0 Service Provider strategy will seek to also achieve this as well as generate sales growth. It is, therefore, easy to see why many operators are interested in pursuing a Telco 2.0 Service Provider strategy: if they can execute successfully then they will receive a double-whammy benefit on CROIC because lower opex and higher sales will result in more free cash flow being generated from lower levels of invested capital.

CROIC also demonstrates how the current financial metrics used by operators – particularly EBITDA margins – preclude operators from considering different operational and business models which may have lower EBITDA margins but higher overall cash returns on invested capital. Thus, as shown in Figure 2 (showing relative rather than actual financials), CSPs tend to focus on the existing capital-intensive business which currently generates CROIC of around 6% for most operators rather than investing in new business model areas which yield higher returns. The new business model areas require relatively low levels of incremental capital investment so, although they generate lower EBITDA margins than existing Telco 1.0 services, they can generate substantial CROIC margins and can ‘move the needle’ for operators.

Specifically, Figure 2 illustrates the way that different skills and operational models translate into different financial models by showing:

  • Telco 1.0 (Core Services + Vertical Industries Solutions (SI) + Infrastructure Services) requires high capital investment and generates relative low levels of revenue for each $1 of invested capital ($0.5-0.7) but at high EBITDA margin (30-50%). This results in healthy cash generation (EBITDA) but a large proportion of this cash needs to be reinvested as capital expenditure each year resulting in relatively modest levels of free cash flow and CROIC of 5.2-6.4% for a typical CSP.
  • Even if we exclude any capex and opex savings generated from becoming a Telco 2.0 Happy Pipe, the addition of additional revenues from Embedded Communications (see Strategy 2.0: The Six Key Telco 2.0 Opportunities) mean that a Happy Piper generates new revenues that require relatively low levels of capital investment. Although these ‘embedded communications’ revenues are at a lower margin than the core services (28% compared with 45%), they require little incremental capital expenditure. This means that free cash flow is healthy and CROIC for Embedded Communications is 10.7% lifting the Happy Piper overall CROIC percentage.
  • For the Telco 2.0 Service Provider, again setting aside any efficiency benefits from adopting Telco 2.0 principles, the two pure-play Telco 2.0 service areas – Third-party Business Enablers and Own-brand OTT – have very different financial characteristics. They generate much lower EBITDA margins (15-20%) but generate significantly higher sales relative to capital investment ($1.4-2.0) and so are able to generate substantially higher CROIC than the Telco 1.0 services.

In essence, the new ‘product innovation’ businesses associated with being a Telco 2.0 Service Provider are much closer to an internet player such as Amazon or the early Google business (prior to heavy capital investment in fibre and data centres) in the way they make money. Not convinced? Look at Figure 3 which demonstrates the return on total assets generated by CSPs and three key internet players – Microsoft, Google and Amazon. Microsoft, a software business, generates high margins on a relatively low capital base (and hence generates very strong returns) owing to its dominant position on the desktop. Microsoft’s issue is growth not profitability, hence the big investments it is making in its internet business and in mobile. The young

Google and Amazon are classic product innovation businesses – low margin and high sales generation relative to invested capital. The CSP group all generate sales of $0.3-0.7 per $1 of capital but generate higher margins than Amazon and Google before 2005.

So we can see that the new Telco 2.0 business model makes money in a different way to the traditional business and needs to be managed and measured in a new way. Let’s explore the implications of this in more detail.

Figure 2: Cash Returns on Invest Capital of different Telco 2.0 opportunity areas

This table demonstrates the relative, rather than absolute, financial metrics for different CSP opportunity areas. The starting point is a nominal $1,000 of invested capital in the CSP network that results in $500 of annualised ‘Core Services’ revenues. Levels of invested capital, sales, EBITDA, annual capex, tax and free cash flow are then shown for each of the opportunity areas.

Different returns of different business models

Figure 3: Different financial models illustrated – CSPs vs Internet Players

This chart shows how different businesses generate returns by plotting asset intensity (x-axis) against profitability (y-axis). Note that the profitability measure here (NOPAT margin) is not directly comparable to the EBITDA margin in Figure 2 as this is post-taxation.

Different returns at different stages of business development

Revenue model implications and guiding principles

The different types of revenue to be considered when developing a new Telco 2.0 service are outlined in detail in the A Practical Guide to Implementing Telco 2.0 in the section on the Telco 2.0 Service Development Process. These include different revenue types (such as single stream, multi-stream, interdependent), different revenue models (subscriptions, unit charges, advertising, licensing and commissions) and different sources (consumer, SME, enterprise as both end users and as third-party service providers – advertisers, merchants, etc.). It is clear that:

  • Telco 1.0 services are largely single stream, confined to a few models (subscription and per unit charging) and sourced from end users (consumers, SMEs and enterprises).
  • Telco 2.0 services typically have more revenue types, including interdependent (two-sided revenues), introduce more revenue models, including advertising and commission, and source revenues from third-parties as well as end-users.

But what about how these new revenue types, models and sources impact the overall CSP business? How should (finance) managers now evaluate services given the different financial models between Telco 1.0 and Telco 2.0? What constitutes ‘attractive’ now? What metrics are the right ones to use? What trade-offs between the Telco 1.0 and Telco 2.0 revenue models need to be considered?

Five guiding principles for revenue models

We lay out 5 revenue model guiding principles to help you address these knotty questions below:

1. Ensure your revenue model supports your overall strategy and need to build appropriate ecosystem control points.

In the Telco 1.0 world, the revenue model is simple and, although pricing is complex, decision- making is simplified by clear goals – to maximise the number of paying users and manage the price-volume trade-off (higher prices = lower volume of users or transactions) to maximise overall returns from communications services. The Telco 2.0 world is far more complex. As well as having ‘more revenue levers to pull’, management needs to consider the company’s overall digital strategy beyond communications.

CSPs need to consider where and how they will create one or more control points within the digital ecosystem. Revenue and pricing strategy is a core component of this. In some arenas – payments for example – CSPs may choose to price their services very low or make them free to build up a large number of mobile wallet users and a strong merchant network that can be monetised in another arena – mobile advertising perhaps. In other words, management cannot take a siloed approach to the CSP revenue model – there is a need to think horizontally across the CSP digital platform.

To read the note in full, including the following additional analysis…

  • The rest of the five guiding principles for revenue models
  • Five guiding principles for cost models
  • Final thoughts on Telco 2.0 finances – how to work with the Finance team


…and the following figures

  • Figure 1: Cash Returns On Invested Capital (CROIC)
  • Figure 2: Cash Returns on Invest Capital of different Telco 2.0 opportunity areas
  • Figure 3: Different financial models illustrated – CSPs vs Internet Players
  • Figure 4: Revenue metrics – Telco 1.0 and Telco 2.0 examples
  • Figure 5: Product Innovation vs Infrastructure cost models – Unilever & Vodafone


Members of the Telco 2.0 Executive Briefing Subscription Service and the Telco 2.0 Transformation Stream can download the full 15 page report in PDF format hereNon-Members, please subscribe here or email contact@telco2.net / call +44 (0) 207 247 5003.

The M-Commerce ‘Land-Grab’: Telcos Vs. Apple & Google

Summary: The mobile commerce market is going through a critical ‘land-grab’ phase. This report reviews the strategies and tactics of the leading telcos and Internet players in Asia, Europe and North America as they seek to use the mobile medium to become an intermediary between buyers and sellers. It considers the pivotal role of the digital wallet, ‘big data’, the race to acquire merchants and the key alliances between telcos, banks, payment networks and Internet players (December 2012, Executive Briefing Service, Dealing with Disruption Stream).

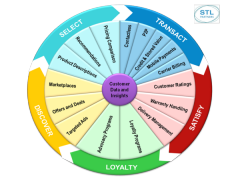
Digital Commerce Flywheel December 2012

  Read in Full (Members only)   To Subscribe click here

Below is an extract from this 33 page Telco 2.0 Briefing Report that can be downloaded in full in PDF format by members of the Telco 2.0 Executive Briefing service and the Telco 2.0 Dealing with Disruption Stream here. We’ll be publishing more on Digital Commerce in in 2013 and it will be a key theme at our Executive Brainstorms in Silicon Valley (March 2013), Europe (London, June 2013), Digital Arabia (Dubai, November 2013), and Digital Asia (Singapore, December 2012). Non-members can subscribe here and for this and other enquiries, please email contact@telco2.net / call +44 (0) 207 247 5003.

Introduction

STL defines Digital Commerce 2.0 as the use of new digital and mobile technologies, such as smartphones, to bring buyers and sellers together more efficiently and effectively.  Fast growing usage of mobile, social and local services is opening up opportunities to provide consumers with highly-relevant advertising and marketing services, underpinned by secure and easy-to-use payment services. By giving people easy access to information, vouchers, loyalty points and electronic payment services, smartphones can be used to make shopping in bricks and mortar stores as interactive as shopping through web sites and mobile apps.

Telcos and their partners could play a major role in enabling digital commerce 2.0 as intermediaries that create platforms that help to bring together buyers and sellers. But Internet companies, banks, payment networks and others are also seeking to act as digital intermediaries between merchants and consumers.

This executive briefing builds on STL Partners’ Strategy Report, Dealing with the ‘Disruptors’: Google, Apple, Facebook, Microsoft/Skype and Amazon, which examines the mobile commerce strategies of the major Internet players, and STL’s Digital Commerce 2.0 Executive Brainstorm events in London, New York, San Francisco and Singapore.

This report reviews the strategies and tactics of the leading telcos and Internet players aiming to use the mobile medium to become an intermediary between buyers and sellers. It considers the pivotal role of the digital wallet, the race to acquire merchants and the key alliances in this space. It sets the scene for a forthcoming report that will make recommendations for how telcos and their partners should build a compelling mobile commerce proposition.

To share this article easily, please click:


Executive Summary

Smartphones are extending digital commerce out of the home and the office and on to the street and in to the store. With full web browsers and a host of apps, these handsets enable consumers to access information and interact with merchants and brands from anywhere and anytime.  

The wallet land-grab

As smartphones go mass market, Internet companies, telcos, banks, payment networks and other companies are in land-grab mode – racing to sign up merchants and consumers for platforms that could enable them to secure a pivotal (and lucrative) position in the fast growing digital commerce market.

Across Europe, the Americas, Asia and parts of Africa, telcos, Internet players, payment networks and banks are looking to deploy their own digital wallets in the belief that these apps will become a key strategic platform. A digital wallet – software that stores debit and credit card information, loyalty points, electronic vouchers and cash – could be used  to interact with consumers while they are actually shopping, brokering targeted offers and promotions. For marketers, the wallet offers a golden opportunity to reach a consumer on the cusp of making a purchase.

While Internet players, such as PayPal and Apple, tend to be focused on signing up users for their online wallets, telcos, such as AT&T and Vodafone, are developing a mobile app-centric solution that uses the SIM card for authentication.

In fact, you need both. To become a market leader, a digital wallet will have to be very easy to use both online and at point of sale. Most consumers will want to use the same digital wallet across a PC, a mobile handset and a tablet, so they can track all of their spending and offers easily. At the same time, wallets that are used both online and at point of sale will be able to generate a far more complete and comprehensive picture of the consumers’ shopping habits.

More and better data

Akin to a search engine, the digital wallet could also enable companies to capture valuable data that can be used to improve the targeting of offers and promotions. For example, the transactional data captured by a digital wallet may show what kinds of restaurants the consumer likes to eat at, enabling the delivery of appropriate vouchers. The data generated by a digital wallet could be used to broker highly-targeted offers, thereby enabling the wallet supplier to secure a pivotal and lucrative position in the digital commerce value chain.

However, it will be important for wallet suppliers to give individuals a high degree of control over their data, enabling them to delete or amend information captured by the wallet and even take that data to with them to a new wallet. While that may seem counterintuitive, both individuals and regulators are more likely to trust and accept services that are transparent and put the consumer in control. 

Fragmentation could equal failure

The large number of players targeting the mobile commerce market with a diverse range of approaches risks confusing both consumers and merchants. There is a danger that both groups will play a waiting game, preferring to see which solutions rise to the top and which flop. Many stakeholders, particularly upmarket retailers and brands, will be waiting for Apple to roll out a mobile commerce proposition they can use to target the many affluent owners of iPhones. In other words, the land-grab may end up being a very drawn out and expensive process for all involved.

The Digital Commerce 2.0 Gold Rush

The opportunity

Digital commerce is being reinvented for the post-PC era. The combination of Internet and mobile technologies is enabling new forms of digital marketing, retailing and payments which could dramatically improve the efficiency and effectiveness of all kinds of businesses. Internet companies, telcos, banks, payment networks and other companies are in land-grab mode – racing to sign up merchants and consumers for platforms that could enable them to secure a pivotal (and potentially lucrative) position in the fast growing digital commerce market. Although it is early days for Digital Commerce 2.0, the gold rush is in full swing.   

The advent of mass-market smartphones, with touchscreens, full Internet browsers and an array of feature-rich apps, is a game changer that is profoundly impacting the way in which people and businesses buy and sell. Consumers are already using these smartphones to access social, local and mobile digital services and make smarter purchase decisions. As they shop, they can easily canvas opinion via Facebook, read product reviews on Amazon or compare prices across multiple stores. 

STL Partners’ strategy report, Dealing with the ‘Disruptors’: Google, Apple, Facebook, Microsoft/Skype and Amazon, identified authentication and payments and  brokering online advertising and marketing as two of the key battlegrounds in the Great Game being played out by the Internet giants and the leading telcos. 

Although hundreds of millions of people have already entrusted their credit or debit card details to eBay, Facebook, Apple, Google or Amazon and use these web giants’ online payment services to pay for goods, services or digital content online, telcos could yet become key players. Approximately three billion people worldwide have a billing relationship with one or more telco and carrier billing can be more secure and convenient that other payment mechanisms, particularly for people lacking debit and credit cards. Some Internet players, such as Google, would like to tap telcos’ assets and processes to help them authenticate consumers.

Brokering online advertising and marketing is clearly Google and Facebook’s core business, while Microsoft, Apple and Amazon see it as potential source of revenue growth. Different telcos have adopted different approaches to this market. While some, such as Telefonica O2, see advertising and marketing as a potential source of revenue growth, other telcos prefer to focus on providing enablers to specialists, such as Facebook. Figure 1 shows how Telefonica, an advanced telco, compares with the leading Internet players across key enablers of digital commerce. Green indicates a strong position, amber, a middling position and red, a weak position, while light blue indicates no position.

Figure 1 splits the enablers according to the two sides digital commerce platform – the blue set of enablers are aimed at downstream customers (typically consumers), while the red set of enablers are aimed at upstream customers (typically merchants and brands). Some of the Internet players, notably Google and Amazon, have a strong position on both sides of this platform.

As it stands, the online advertising and marketing market is Google’s and Facebook’s to lose. The more data and inventory you have, the more precise the targeting and the bigger the target audience. STL Partners believes only telcos with major in-market scale, such as China Mobile or NTT DOCOMO, should consider competing head-to-head with the web giants.  

But, in developing countries, in particular, where most people don’t have smartphones, SMS and MMS remain a powerful marketing medium with plenty of scope to grow. There is also an opportunity for telcos to act as a trusted intermediary, helping consumers concerned about privacy to control and derive value from their personal data.

Figure 1: How a leading telco stacks up with Internet players on digital commerce

Telco vs Internet Players on Digital Commerce December 2012

Source: STL Partners

Perhaps the biggest growth opportunity in online marketing and advertising is to help merchants and brands use social, local and mobile services to stimulate demand, engage better with customers and potential customers and achieve a higher return on investment (ROI) from their marketing spend.  Amazon, for example, is pursuing this market through its Amazon Local service, which emails offers from local merchants to consumers in specific geographic areas.  

In theory, at least, targeting marketing at consumers in the right geography and the right demographic group should be far more effective than simply displaying adverts to anyone who conducts an Internet search using a specific term.

Highly-targeted direct marketing and loyalty programmes could be a much bigger opportunity than conventional advertising 

In the U.S., the direct marketing market (US$ 139 billion) is worth more than three times the U.S. advertising market (US$39 billion), according to some estimates (see Figure 2).  

Figure 2: A breakdown of the U.S. direct marketing and advertising market

U.S. Direct Marketing & Advertising Market December 2012
Source: STL Partners

The extensive data being generated by smartphones can give companies’ real-time information on where their customers are and what they are doing. That data can be used to improve merchants’ marketing, advertising, stock management, fulfilment and customer care. For example, a smartphone’s sensors can detect how fast the device is moving and in what direction, so a merchant could see if a potential customer is driving or walking past their store. 

Moreover, mobile technologies also make it easier for merchants and brands to tell whether a specific marketing activity actually led to a sale. If a consumer uses their smartphone to research a product and then pay for the product, the retailer could gain a complete view of the whole commerce cycle, enabling it to see exactly what kind of marketing results in transactions.

With merchants looking to close the loop in this way, marketing and advertising brokers, such as Google, and some telcos, are increasingly moving into the payments space. In general, their approach is to roll out digital wallets that can be used to complete both online transactions and point of sale transactions (either using a contactless technology, such as NFC, or a mobile network-based solution).

Although payments itself is a low margin business, it could be an important pillar of a broader and much more lucrative digital commerce offering – American Express estimates that merchants in the US spend four to five times as much on marketing activities, such as loyalty programmes and offers, as they do on payments. In fact, transactions are just one element of a far bigger flywheel that drives the digital commerce market (see Figure 3).

Figure 3: The key elements of the digital commerce flywheel

Digital Commerce Flywheel December 2012

Source: STL Partners

Actual deployments

With potentially hundreds of billions of dollars of business in play, an array of companies around the world are making significant investments in digital commerce services. They are generally experimenting with and testing different approaches and business models, particularly in the areas of mobile advertising, location-based marketing, payments and mobile money transfers. 

In the following sections we outline examples of services we believe will have the most market impact, either because they have already gained market traction or because they have the backing of powerful companies. These examples illustrate the diversity of the players involved and the approaches they have adopted.

To read the note in full, including the following sections detailing support for the analysis…

  • Europe – experiments abound
  • The Weve joint venture
  • Cityzi
  • Moneta
  • Turkcell
  • WyWallet
  • Visa Europe
  • PayPal
  • The Mobile Money Network
  • CellPay
  • Pingit from Barclays
  • Asia – leading the world
  • South Korea
  • The Philippines
  • Bharti Airtel
  • SingTel
  • Japan
  • China
  • The U.S. – gang culture
  • The Merchant Customer Exchange
  • Starbucks and Square
  • American Express
  • PayPal
  • The Isis joint venture
  • Minutrade
  • Global players – grappling with glocal
  • Google
  • Apple
  • Vodafone and Visa
  • Telefonica and Visa
  • Deutsche Telekom and MasterCard
  • Conclusions and Key takeaways
  • Index

…and the following figures…

  • Figure 1: How a leading telco stacks up with Internet players on digital commerce
  • Figure 2: A breakdown of the U.S. direct marketing and advertising market
  • Figure 3: The key elements of the digital commerce flywheel
  • Figure 4: Examples of mobile commerce activity in the U.K.
  • Figure 5: Where the Weve joint venture fits into Telefonica’s strategy
  • Figure 6: Examples of online wallets moving into mobile
  • Figure 7: How Isis compares with other mobile wallets in the US market
  • Figure 8: Google Wallet no longer needs to work directly with banks
  • Figure 9: Telefonica O2’s two sided strategy
  • Figure 10: The mobile commerce strategy of leading telcos
  • Figure 11: The mobile commerce strategy of leading Internet players
  • Figure 12: Giving consumers control over personal data


Members of the Telco 2.0 Executive Briefing Subscription Serviceand the Telco 2.0 Dealing with Disruption Stream can download the full 33 page report in PDF format hereNon-Members, please subscribe here. For this or other enquiries, please email contact@telco2.net / call +44 (0) 207 247 5003.

Companies and technologies covered: Mobile wallets, localized commerce, location based services, personal data, telco strategy, big data, mobile commerce, APIs, business models, SoLoMo, mobile advertising, mobile marketing, mobile payments, digital wallets.

Cloud 2.0: Telstra, Singtel, China Mobile Strategies

Summary: In this extract from our forthcoming report ‘Cloud 2.0: Telco Strategies in the Cloud’ we outline the key components of Telstra, Singtel and China Mobile’s cloud strategies, and how they compare to the major ‘Big Technology’ players (such as Microsoft, VMWare, IBM, HP, etc.) and ‘Web Giants’ such as Google and Amazon. (November 2012, Executive Briefing Service, Cloud & Enterprise ICT Stream.) Vodafone results Nov 2012
  Read in Full (Members only)  To Subscribe click here

Below is an extract from this 14 page Telco 2.0 Report that can be downloaded in full in PDF format by members of the Telco 2.0 Executive Briefing service and the Cloud and Enterprise ICT Stream here. Non-members can subscribe here or other enquiries, please email contact@telco2.net / call +44 (0) 207 247 5003.

We’ll also be discussing our findings at the New Digital Economics Brainstorms in Singapore (3-5 December, 2012).

To share this article easily, please click:


Introduction

This is an edited extract of Cloud 2.0: Telco Strategies in the Cloud, a new Telco 2.0 Strategy Report to be published next week. The report examines the evolution of cloud services; the current opportunities for vendors and Telcos in the Cloud market, plus a penetrating analysis on the positioning Telcos need to adopt in order to take advantage of the global $200Bn Cloud services market opportunity.

The report shows how CSP’s can create sustainable differentiated positions in Enterprise Cloud. It contains a concise and comprehensive analysis of key vendor and telco strategies, market forecasts (including our own for both the market and telcos), and key technologies.

Led by Robert Brace (formerly Global Head of Cloud Services for Vodafone), it leverages the knowledge and experience of Telco 2.0 analyst team, senior global brainstorm participants, and targeted industry research and interviews. Robert will also be presenting at Digital Asia, 4-5 Dec, Singapore 2012.

Methodology

In the full report, we reviewed both telcos and technology companies using a list of 30 criteria organised in six groups (Market, Vision, Finance, Proposition, Value Network, and Technology). We aimed to cover their objectives, strategy, market areas addressed, target customers, proposition strategy, routes to market, operational approach, buy / build partner approach, and technology choices.

We based our analysis on a combination of desk research, expert interviews, and output from our Executive Brainstorms.

Among the leading cloud technology companies we identify two groups, which we characterise as “Big Tech” and the “Web Giants”. The first of these are the traditional enterprise IT vendors, while the second are the players originating in the consumer web 2.0 space (hence the name).

  • Big Tech: Microsoft (Azure), Google (Dev & Enterprise), VMWare, Parallels, Rackspace, HP, IBM.
  • Web Giants: Microsoft (Office 365), Amazon, Google (Apps & Consumer), Salesforce, Akamai.

In the report and our analyses below, we use averages for each of these groups to give a key comparator for telco strategies. The full strategy report contains individual analyses for each of these companies and the following telcos: AT&T, Orange, Telefonica, Deutsche Telekom, Vodafone, Verizon, China Telecom, SFR, Belgacom, Elisa, Telenor, Telstra, BT, Cable and Wireless.

Summary

The ‘heatmap’ table below shows the summary results of a 4-box scoring against our key criteria for the four APAC telcos enterprise cloud product intentions (i.e. what they intend to do in the market), where 1 (light blue) is weakest, 4 (bright red) stronger.

Figure 1: Cloud ‘heatmap’ for selected APAC telcos
Cloud APAC Heatmap
Source: STL Partners / Telco 2.0

In the full report are similar tables and comparisons for capabilities and used these results to compare telco to vendor strategies and telco to telco strategies where they compete in the same markets.

In this briefing we summarise results for Telstra, Singtel, China Mobile, and China Telecom.

Telstra – building regional leadership


Operating in the somewhat special circumstances of Australia, Telstra is pursuing both an SMB SaaS strategy (typical of mobile operators) and an enterprise IaaS strategy (see Figure 2). Under the first, it resells a suite of business applications centred on Microsoft Office 365, for which it has exclusivity in Australia.

Under the second, it is trying to develop a cloud computing business out of its managed hosting business. VMWare is the main technology provider, with some Microsoft Hyper-V. Unlike many telcos, Telstra benefits from the fact that the major IaaS players are only just beginning to develop data centres in Australia, and therefore cloud applications hosted with Amazon etc. are subject to a considerable latency penalty.


Figure 2: Telstra: A local leader

Cloud Telstra Radar Map

Source: STL Partners / Telco 2.0

However, data sovereignty concerns in Australia will force other cloud providers to develop at least some presence if they wish to address a variety of important markets (finance, government, and perhaps even mining), and this will eventually bring greater competition.

So far, Telstra has a web portal for the reseller SaaS products, and relies on a mixture of its direct sales force and a partnership with Accenture as a channel for IaaS.

Figure 3: Telstra benefits from geography

Telstra Cloud Radar Map 2

Source: STL Partners / Telco 2.0

To read the note in full, including the following analysis…

  • Introduction
  • Methodology
  • Summary
  • Telstra – building regional leadership
  • SingTel – aiming to be a regional hub
  • China Mobile – the Great Cloud?
  • China Telecom – making a start
  • Conclusions
  • Next steps

…and the following figures…

  • Figure 1: Cloud ‘heatmap’ for selected APAC telcos
  • Figure 2: Telstra: A local leader
  • Figure 3: Telstra benefits from geography
  • Figure 4: SingTel’s strategy is typical, but well executed
  • Figure 5: China Mobile: A less average telco
  • Figure 6: China Mobile has a distinctly different technology strategy
  • Figure 7: China Mobile has some key differentiators (“spikes”) versus its rivals
  • Figure 8: Comparing the APAC Giants
  • Figure 9: Cluster analysis: Telco operators


Members of the Telco 2.0 Executive Briefing Subscription Service and the Cloud and Enterprise ICT Stream can download the full 14 page report in PDF format hereNon-Members, please subscribe here or email contact@telco2.net / call +44 (0) 207 247 5003.


Technologies and industry terms referenced: strategy, cloud, business model, APAC, Singtel, Telstra, China Mobile, China Telecom, VMWare, Amazon, Google, IBM, HP.

The Cloud 2.0 Programme

This research report is a part of the ‘Cloud 2.0’ programme. The report was independently commissioned, written, edited and produced by STL Partners.

The Cloud 2.0 programme is a new initiative that brings together STL Partners’ research and senior thought-leaders and decision makers in the fast evolving Cloud ecosystem to develop new propositions and new partnerships. We’d like to thank the sponsors of the programme listed below for their support. To find out more or to join the Cloud 2.0 programme, please email contact@telco2.net or call +44 (0) 207 247 5003.

Stratus Partners:

Cordys Logo


Europe’s brutal future: Vodafone and Telefonica hit hard

Introduction


Even in the UK and Germany, the markets with the brightest future, STL Partners forecasts a respective 19% and 20% decline in mobile core services (voice, messaging and data) revenues by 2020. The UK has less far to fall simply because the market has already contracted over the last 2-3 years whereas the German market has continued to grow.

We forecast a decline of 34% in France over the same period.

In Italy and, in particular, Spain we forecast a brutal decline of 47% and 61% respectively. Overall, STL Partners anticipates a reduction of 36% or €30 billion in core mobile service revenues by 2020. This equates to around €50 billion for Europe as a whole.


Like the medical profession, we don’t always like being correct when our diagnoses are pessimistic. So it is with some regret that we note that our forecasts are being borne out by the latest reports from southern Europe. Vodafone has been forced into a loss for H1 2012, after it wrote down the value of its Spanish and Italian OpCos by £5.9bn. Here’s why:

eurobloodbath.png

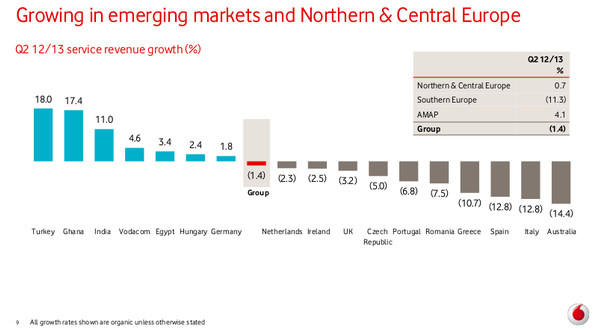
The writedown is of course non-cash, and those of us who remember Chris Gent’s Vodafone will be familiar with the sensation. But the reasons for it could not be more real. Service revenue has fallen sickeningly, down 7.9% across Europe, 1.4% across the group.

Vodafone has enjoyed a decent performance from the company’s assets in Africa, Asia, Turkey, and the Pacific, and a hefty dividend from Verizon Wireless. It is the performance in Europe which is dreadful and the situation in southern Europe especially bad.

For while service revenue in Gernany was up 1.8%, it was down a staggering 12.8% in both Spain and Italy. And margins were sacrificed for volume; EBITDA was down 16.6% in Italy, and 13.8% in “Other Southern Europe”, that is to say mostly Greece and Portugal. Even the UK saw service revenues fall -2.1%, while the Netherlands was down -1.9%. Vodafone’s investments across Europe seem to have landed in an arc of austerity running from the Norwegian Sea to the Aegean, the long way around.

Vodafone’s enterprise line of business has helped the Italian division defy gravity for a while. Until recently, OneNet was racking up the same 6% growth rates in Italy that it saw in Germany and contributing substantially to service revenue, even though the wider business was shrinking. In Q2, service revenue in Italy was down 4.1% but enterprise was up 5.8%.

But strategy inevitably beats tactics. Tellingly, the half-year statement from Vodafone management went a little coy about enterprise’s performance. Numbers are only given for Germany and Turkey, and for group-wide One Net seats. They are good, but you wonder about the numbers that aren’t given. We are told that One Net is “performing well” in Italy, but that’s not a number.

Meanwhile, Telefonica saw its European revenues fall 6.4% year-on-year. The problem is in Spain, where the plummet was 12.9%. Mobile was worse still, with revenues thumped downwards by 16.2%.

The damage, for both carriers, is concentrated in mobility, in southern Europe, and in voice and messaging. Telefonica blames termination rate cuts (as does Vodafone – both carriers are big enough that they tend to terminate more calls from other carriers than they pay out on), but this isn’t really going to wash. As Vodafone’s own statement makes clear, MTRs are coming down everywhere. And Telefonica’s wireline revenues were horrible, too, down 9.6%.

But the biggest hit to revenue for Vodafone was in messaging, and then in voice. Data revenue is growing. In the half to 30th September 2011, Vodafone.es subscribers generated £156 million in messaging revenues. In the corresponding half this year, it was £99 million. Part of this is accounted for by movement in the euro-sterling exchange rate, so Vodafone reports it as a 30% hit to messaging and a 20% hit to voice. Italy saw an 11.4% hit to messaging and a 16% hit to voice. The upshot to Vodafone is a 29.7% cut to the division’s operating profits. Brutal indeed.

Obviously, a lot of this is being driven by the European economic crisis. It is more than telling that Vodafone’s German and Turkish operations are powering ahead, while it’s not just the Mediterranean economies under the European Union’s “troika” management (EC, ECB and IMF) that are suffering. The UK, under its own voluntary austerity plan, was down 2.1% for Telefonica, and the Netherlands, having gone from being the keenest pupil in the class to another austerity case in the space of one unexpectedly bad budget, is off 1.9%. Even if you file Turkey under “emerging market”, the comparison between the Mediterranean disaster area, the OK-ish position in North-Western Europe, and the impressive (£2.4bn) dividend from Verizon Wireless in the States is compelling.

But disruption is a fact. We should not expect that things will snap back as soon as the macro-economy takes a turn for the better. One of the reasons for our grim prediction was that as well as weak economies, the Southern European markets exhibited surprisingly high prices for mobile service.

The impact of the crisis is likely to permanently reset customer behaviour, technology adoption, and price expectations. The Southern price premium is likely to be permanently eroded, whether by price war or by regulatory action. Customers are observably changing their behaviour in order to counter-optimise the carriers’ tariff plans.

Vodafone observes plummeting messaging revenues, poor voice revenues, and heavy customer retention spending, specifically on handset subsidies for smartphones. In fact, Vodafone admits that it has tried to phase out subsidy in Spain and been forced to turn back. This suggests that customers are becoming very much more aware of the high margin on SMS, are rationing it, and are deliberately pressing for any kind of smartphone in order to make use of alternatives to SMS. Once they are hooked on WhatsApp, they are unlikely to go back to carrier messaging if the economy looks up.

Another customer optimisation Vodafone encounters is that the customers love their integrated fixed/mobile plan. Unfortunately, this may mean they are shifting data traffic off the cellular network in the home-zone and onto WLAN. Further, as Vodafone is a DSL unbundler, the margin consequences of moving revenue this way may not be so great. In Italy, although the integrated tariffs sold well, a “fall in the non-ULL customer base” is blamed for a 5.6% drop in fixed service revenue. Are the customers fleeing the reseller lines because Vodafone can’t match TI or Fastweb’s pricing, or is it that the regulatory position means margins on unbundled lines are worse?

Vodafone’s response to all this is its RED tariff plan. This essentially represents a Telco 2.0 Happy Pipe strategy, providing unlimited voice and messaging in order to slow down the adoption of alternative communications, and setting data bundles at levels intended to be above the expected monthly usage, so the subscribers feel able to use them, but not far enough above it that the bandwidth-hog psychology takes hold.

vf-red.png

With regard to devices, RED offers three options with tiered pricing: SIM only, basic smartphone, and iPhone. The idea is to make the subsidy costs more evident to the customer, to slow up the replacement cycle on flagship smartphones via SIM-only, and to channel the smartphone hunters into the cheaper devices. Overall, the point is to drive data and smartphone adoption down the diffusion curve, so as to help the transition from a metered voice-centric to a data-centric business model.

The CEO, Vittorio Colao, says as much:

The reason why the whole industry is on a difficult trend…is because we historically voice priced really high and data priced really low.

Vodafone’s competitors face a serious challenge. They are typically still very dependent on prepaid voice minutes, a market which is suffering. Even in Northern Europe, it’s off 10%. Telcos loved PAYG because everything in it is incremental. Now, the challenge is how to create a RED-like tariff for the PAYG market.

Euro Voice Brutal Image 2 Chart Euro 5 Oct 2012.png

Those in North and South America, MENA and Asia-Pacific may be looking at Europe and breathing a sigh of relief. But don’t fool yourself. SMS revenues in the US are down for the first time driven by volume and price declines. One rather worrying outcome of last week’s Digital Arabia event was that operators in the region seem to be under the impression that the decline for them is still several years out and destined to be a relatively gentle softening of the market. There’s more here on our initial take on what they need to do to avoid complacency and start to build new business models more quickly.

Cloud 2.0: the fight for the next wave of customers

Summary: The fight for the Cloud Services market is about to move into new segments and territories. In the build up to the launch of our new strategy report, ‘Telco strategies in the Cloud’, we review perspectives on this shared at the 2012 EMEA and Silicon Valley Executive Brainstorms by strategists from major telcos and tech players, including: Orange, Telefonica, Verizon, Vodafone, Amazon, Bain, Cisco, and Ericsson (September 2012, , Executive Briefing Service, Cloud & Enterprise ICT Stream). Cloud Growth Groups September 2012
  Read in Full (Members only)   To Subscribe click here

Below is an extract from this 33 page Telco 2.0 Briefing Report that can be downloaded in full in PDF format by members of the Telco 2.0 Executive Briefing service and the Cloud and Enterprise ICT Stream here. Non-members can subscribe here and for this and other enquiries, please email contact@telco2.net / call +44 (0) 207 247 5003.

Introduction

As part of the New Digital Economics Executive Brainstorm series, future strategies in Cloud Services were explored at the New Digital Economics Silicon Valley event at the Marriott Hotel, San Francisco, on the 27th March, 2012, and the second EMEA Cloud 2.0 event at the Grange St. Pauls Hotel on the 13th June 2012.

At the events, over 200 specially-invited senior executives from across the communications, media, retail, finance and technology sectors looked at how to make money from cloud services and the role and strategies of telcos in this industry, using a widely acclaimed interactive format called ‘Mindshare’.

This briefing summarises key points, participant votes, and our high-level take-outs from across the events, and focuses on the common theme that the cloud market is evolving to address new customers, and the consequence of this change on strategy and implementation. We are also publishing a comprehensive report on Cloud 2.0: Telco Strategies in the Cloud.

To share this article easily, please click:


Executive Summary

The end of the beginning

The first phase of enterprise cloud services has been dominated by the ‘big tech’ and web players like Amazon, Google, and Microsoft, who have developed highly sophisticated cloud operations at enormous scale. The customers in this first round are the classic ‘early adopters’ of enterprise ICT – players with a high proportion of IT genes in their corporate DNA such as Netflix, NASA, Silicon Valley start ups, some of the world’s largest industrial and marketing companies, and the IT industry itself. There is little doubt that these leading customers and major suppliers will retain their leading edge status in the market.

The next phase of cloud market development is the move into new segments in the broader market. Participants at the EMEA brainstorm thought that a combination of new customers and new propositions would drive the most growth in the next 3 years.

UK Services Revenues: Actual and Forecast (index)

These new segments comprise both industries and companies outside the early adopters in developed markets, and companies in new territories in emerging and developing markets. These customers are typically less technology oriented, more focused on business requirements, and need a combination of de-mystification of cloud and support to develop and run such systems.

Closer to the customer

There are opportunities for telcos in this evolving landscape. While the major players’ scale will be hard to beat, there are opportunities in the new segments in being ‘closer to the customer’. This involves telcos leveraging potential advantages of:

  • existing customer relationships, existing enterprise IT assets, and channels to markets (where they exist);
  • geographical proximity, where telcos can build, locate and connect more directly to overcome data sovereignty and latency issues.

Offering unique, differentiated services

Telcos should also be able to leverage existing assets and capabilities through APIs in the cloud to create distinctive offerings to enterprise and SME customers:

  • Network assets will enable better management of cloud services by allowing greater control of the network components;
  • Data assets will enable a wider range of potential applications for cloud services that use telco data (such as identification services);
  • And communications assets (such as APIs to voice and messaging) will allow communications services to be built in to cloud applications.

Next steps for telcos

  • Telcos need to move fast to leverage their existing relationships with customers both large and small and optimise their cloud offerings in line with new trends in the enterprise ICT market, such as bring-your-own-device (BYOD).
  • Customers are increasingly looking to outsource business processes to cut costs, and telcos are well-placed to take advantage of this opportunity.
  • Telcos need to continue to partner with independent software vendors, in order to build new products and services. Telcos should also focus on tight integration between their core services and cloud services or cloud service providers (either delivered by themselves or by third parties.) During the events, we saw examples from Vodafone, Verizon and Orange amongst others.
  • Telcos should also look at the opportunity to act as cloud service brokers. For example, delivering a mash up of Google Apps, Workday and other services that are tightly integrated with telco products, such as billing, support, voice and data services. The telco could ensure that the applications work well together and deliver a fully supported, managed and billed suite of products.
  • Identity management and security also came through as strong themes and there is a natural role for telcos to play here. Telcos already have a trusted billing relationship and hold personal customer information. Extending this capability to offer pre-population of forms, acting as an authentication broker on behalf of other services and integrating information about location and context through APIs would represent additional business and revenue generating opportunities.
  • Most telcos are already exploring opportunities to exploit APIs, which will enable them to start offering network-as-a-service, voice-as-a-service, device management, billing integration and other services. Depending on platform and network capability, there are literally hundreds of APIs that telcos could offer to external developers. These APIs could be used to develop applications that are integrated with telcos’ network product or service, which in turn makes the telco more relevant to their customers.

We will be exploring these strategies in depth in Cloud 2.0: Telco Strategies in the Cloud and at the invitation only New Digital Economics Executive Brainstorms in Digital Arabia in Dubai, 6-7 November, and Digital Asia in Singapore, 3-5 December, 2012.

Key questions explored at the brainstorms and in this briefing:

  • How will the Cloud Services market evolve?
  • Which customer and service segments are growing fastest (Iaas, PaaS, SaaS)?
  • What are the critical success factors to market adoption?
  • Who will be the leading players, and how will it impact different sectors?
  • What are the telcos’ strengths and who are the most advanced telcos today?
  • Which aspects of the cloud services market should they pursue first?
  • Where should telcos compete with IT companies and where should they cooperate?
  • What must telcos do to secure their share of the cloud and how much time do they have?

Stimulus Speakers/Panelists

Telcos

  • Peter Martin, Head of Strategy, Cloud Computing, Orange Group
  • Moisés Navarro Marín, Director, Strategy Global Cloud Services, Telefonica Digital
  • Alex Jinivizian, Head of Enterprise Strategy, Verizon Enterprise Solutions
  • Robert Brace, Head of Cloud Services, Vodafone Group

Technology Companies

  • Mohan Sadashiva, VP & GM, Cloud Services, Aepona
  • Gustavo Reyna, Solutions Marketing Manager, Aepona
  • Iain Gavin, Head of EMEA Web Services, Amazon
  • Pat Adamiak, Senior Director, Cloud Solutions, Cisco
  • Charles J. Meyers, President, Equinix Americas
  • Arun Bhikshesvaran, CMO, Ericsson
  • John Zanni, VP of Service Provider Marketing & Alliances, Parallels

Consulting & Industry Analysis

  • Chris Brahm, Partner, Head of Americas Technology Practices, Bain
  • Andrew Collinson, Research Director, STL Partners

With thanks to our Silicon Valley 2012 event sponsors and partners:

Silicon Valley 2012 Event Sponsors

And our EMEA 2012 event sponsors:

EMEA 2012 Event Sponsors

To read the note in full, including the following sections detailing support for the analysis…

  • Round 2 of the Cloud Fight
  • Selling to new customers
  • What channels are needed?
  • How will telcos perform in cloud?
  • With which services will telcos succeed?
  • How can telcos differentiate?
  • Comments on telcos’ role, objectives and opportunities
  • Four telcos’ perspectives
  • Telefonica Digital – focusing on business requirements
  • Verizon – Cloud as a key Platform
  • Orange Business Services – communications related cloud
  • Vodafone – future cloud vision
  • Techco’s Perspectives
  • Amazon – A history of Amazon Web Services (AWS)
  • Cisco – a world of many clouds
  • Ericsson – the networked society and telco cloud
  • Aepona – Cloud Brokerage & ‘Network as a Service’ (NaaS)
  • The Telco 2.0™ Initiative

…and the following figures…

  • Figure 1 – Bain forecasts for business cloud market size
  • Figure 2 – Key barriers to cloud adoption
  • Figure 3 – Identifying the cloud growth markets
  • Figure 4 – Requirements for success
  • Figure 5 – New customers to drive cloud growth
  • Figure 6 – How to increase revenues from cloud services
  • Figure 7 – How to move cloud services forward
  • Figure 8 – Enterprise cloud channels
  • Figure 9 – Small businesses cloud channels
  • Figure 10 – Vote on Telco Cloud Market Share
  • Figure 11 – Telcos’ top differentiators in the cloud
  • Figure 12 – The global reach of Orange Business
  • Figure 13 – The telco as an intermediary
  • Figure 14 – Vodafone’s vision of the cloud
  • Figure 15 – Amazon Web Services’ cloud infrastructure
  • Figure 16 – Cisco’s world of many clouds
  • Figure 17 – Cloud traffic in the data centre
  • Figure 18 – Ericsson’s vision for telco cloud
  • Figure 19 – Summary of Ericsson cloud functions
  • Figure 20 – Aepona Cloud Services Broker
  • Figure 21 – How to deliver network-enhanced cloud services

Members of the Telco 2.0 Executive Briefing Subscription Service and the Cloud and Enterprise ICT Stream can download the full 33 page report in PDF format hereNon-Members, please subscribe here. For this or other enquiries, please email contact@telco2.net / call +44 (0) 207 247 5003.

Companies and technologies covered: Telefonica, Vodafone, Verizon, Orange, Cloud, Amazon, Google, Ericsson, Cisco, Aepona, Equinix, Parallels, Bain, Telco 2.0, IaaS, PaaS, SaaS, private cloud, public cloud, telecom, strategy, innovation, ICT, enterprise.

Euro telcos: fiddling while the platform burns?

Summary: Most executives across the European telecoms industry accept that the current telco business model is in decline (the ‘burning platform’), but wholehearted action to create sustainable new models is not in place. We identify the key barriers and next steps to overcome them in this top-level analysis of findings from our recent EMEA Executive Brainstorm. (July 2012, Executive Briefing Service, Transformation Stream.)

UK Services Revenues: Actual and Forecast (index)

  Read in Full (Members only)   To Subscribe click here

Below is an extract from this 16 page Telco 2.0 Report that can be downloaded in full in PDF format by members of the Telco 2.0 Executive Briefing service and the Telco 2.0 Transformation stream here. Non-members can subscribe here and for this and other enquiries, please email contact@telco2.net / call +44 (0) 207 247 5003.

To share this article easily, please click:


Executive Summary

The Burning Platform

It was clear at the Telco 2.0/New Digital Economics Brainstorm in London a few weeks ago that most executives across the European telecoms industry accept that the current telco business model is in decline (the ‘burning platform’), but wholehearted action to create sustainable new models is not in place. 

Figure 1 – The burning platform illustrated: e.g. forecast decline in UK revenues

UK Services Revenues: Actual and Forecast (index)

Source: Presentation by Chris Barraclough, Chief Strategist and MD Telco 2.0

Two thirds of delegates thought this leading indicator forecast ‘about right’ or ‘too optimistic’.

Telcos need to act more decisively

The core message to the leaders of the European telecoms industry is that they must make a more concerted effort to change direction now or will have much less control over their future destinies.

Some telcos are taking steps, but even the most advanced are still in experimental mode, and the rest somewhere between strategic slide-ware and tacit acceptance of a future as a ‘pipe’.

As well as prudent re-pricing of data and diligence in cost and efficiency management, the primary opportunities for telcos are to re-conceive the core communications proposition, re-define the overall experience of being a telco customer and ultimately to create interoperable multi-sided business models that help 3rd parties and end-users (people, organisations and devices) connect in more efficient and effective ways. These actions will create a more valuable and defensible role for telcos in the emerging digital economy.

Overcoming industry inhibitions

To progress, the industry needs to overcome the following challenges:

  • Time is short. Delegates perceived that telcos had significantly less time to secure strategic control points in the digital economy than at previous brainstorms. Telcos need to act more decisively now in payments, advertising, creating new forms of ‘OTT’ communications, identity and cloud services.
  • Money is hard to find. The business cases for some of the new models are complex and the economics are different from traditional telco business models. We know because we have been working on many recently, and have also been recommending important new evaluation metrics. It’s not straightforward, nor is it easy to fill the gap left by the predicted decline in the current model, but it is possible to create new value.
  • Technology is a tool, not a strategy. The business case for LTE, for example, is hard to make without new service revenues in addition to access, which somewhat begs the question of who and what is leading this major industry investment. 
  • The right people are hard to find. 95% of delegates thought there is a serious shortage of the internal skills needed to manage, innovate and deliver very different types of propositions. Understanding, addressing and filling this gap is a vital priority.
  • Customers will not solve the industry’s problems. Most customers – upstream and downstream – do not understand how telcos could help them in new ways. Our research shows a range in comprehension and belief in telcos’ abilities, so telcos need to work harder to create and sell new solutions.
  • It’s tricky to organise innovation and change at scale. The operators that are starting to take action face a complex organisational challenge: should innovation be built into the core business or established in a new unit? In the core it is closer to the heart but also more vulnerable to the organisation’s white blood cells (the ones that attack unrecognised intruders). In a separate unit it’s easier to grant more freedoms but it’s much more difficult to integrate and change the core. 
  • Collaboration: the Prisoners’ Dilemma. Many of the new business models will only work effectively if telcos cooperate on a common approach. This is usually slow and difficult (witness the slow progress of RCS-e and the demise of WAC). There is also regulatory uncertainty around industry collaboration, and fear of the regulator is quite reasonably a powerful internal inhibitor in telcos. Additionally, some players perceive they could achieve competitive advantage by ‘going it alone’. A way through this dilemma needs to be navigated, and our recent analysis suggests some new ways to think about this.
  • It’s hard to change a winning formula (even when you are losing). Financial markets have been keen on telcos’ relative stability and cash flows in turbulent economic times. At the same time there are also those high up in telco organisations who have known nothing but success with the existing model and who will argue to defend the status quo. Yet the financial markets, well known as fickle and irrational beasts, will at some point start to be much more sensitive to the structural change in the telco industry and seek a new direction. Unreasonably perhaps, they will expect change to happen quickly, and if this is not apparent, they will demand new leaders but by then it may be too late.

Next steps for STL Partners and Telco 2.0

Telco 2.0 first described the core challenges facing the industry six years ago in ‘How to make money in an IP world‘, and proposed the ‘two-sided telecoms business model‘ as a key part of the solution four years ago. Over the last year we have published the ‘Roadmap to New Telco 2.0 Business Models‘ describing core innovations needed, and ‘Dealing with the Disruptors – Google, Apple, Facebook, Skype and Amazon‘ outlining strategies in the adjacent competitive landscape.

We’re now driving a range of implementation projects with individual players and collaborative consortiums and will be publishing a further detailed Telco 2.0 implementation guide later this year. Through our research we will also be benchmarking telcos’ strategies, to help the capital markets better understand how to make investment choices in the industry, and looking in-depth at creative strategies in voice and messaging, m-commerce, cloud services and M2M, as well as continuing our work with the World Economic Forum on one of the biggest prizes, how telcos can play a pivotal role in enabling the emergence of a new class of economic asset, ‘Personal Data‘.

We will also be running further invitation only Executive Brainstorms in Dubai (November 6-7, 2012), Singapore (4-5 December, 2012), Silicon Valley (19-20 March 2013), and London (23-24 April, 2013). Email contact@stlpartners.com or call +44 (0) 207 243 5003 to find out more.    

Support for Key Findings

The Platform is burning

Figure 2 – Delegates broadly agreed with STL’s UK Revenue forecast

STL Partners UK Revenue Forecast (June 2012)

Chris Barraclough, MD and Chief Strategist, Telco 2.0 / STL Partners, presented an example analysis of voice and data revenues from the UK market, and predicted a 24% decline from the peak in 2009 to 2018.

Delegates broadly supported this analysis, with over half saying they thought this was ‘about right’. We will be conducting and publishing further analysis in the top 5 European markets over the next few months.

NB The original ‘burning platform’ reference comes from this article describing a choice between certain death and possible death, and is now used to describe a situation where people are forced to act by dint of the alternative being somewhat worse. Nokia recently made ‘burning platform’ a famous phrase in the handset part of the telecoms sector, but it’s now relevant to telcos themselves as they face significant declines in their core revenues.

To read the note in full, including the following sections detailing support for the analysis…

  • Time is short
  • Money is hard to find
  • The right people are hard to find
  • Customers will not solve the industry’s problems
  • It’s tricky to organise innovation and change at scale
  • Collaboration: the Prisoners’ Dilemma
  • It’s hard to change a winning formula (even when you are losing)
  • Next steps

…and the following figures…

  • Figure 1 – The burning platform illustrated: e.g. forecast decline in UK revenues
  • Figure 2 – Delegates broadly agreed with STL’s UK Revenue forecast
  • Figure 3 – Time is running out for telcos
  • Figure 4 – The business case for Telco OTT Voice and Messaging is complex
  • Figure 5 – Telcos need to transform skills, systems, structures and incentives
  • Figure 6 – Upstream customers’ views on telco capabilities
  • Figure 7 – KPN is building innovation into the core rather than a separate business unit
  • Figure 8 – The Prisoners’ Dilemma
  • Figure 9 – It’s difficult to get the timing of new investments right 

Members of the Telco 2.0 Executive Briefing Subscription Service and the Telco 2.0 Transformation stream can download the full 16 page report in PDF format hereNon-Members, please subscribe here. For this or other enquiries, please email contact@telco2.net / call +44 (0) 207 247 5003.

Strategy 2.0: Google’s Strategic Identity Crisis

Summary: Google’s shares have made little headway recently despite its dominance in search and advertising, and it faces increasing regulatory threats in this area. It either needs to find new sources of value growth or start paying out dividends, like Microsoft, Apple (or indeed, a telco). Overall, this is resulting in something of a strategic identity crisis. A review of Google’s strategy and implications for Telcos. (March 2012, Executive Briefing Service, Dealing with Disruption Stream).

Google's Advertising Revenues Cascade

  Read in Full (Members only)  Buy a single user license online  To Subscribe click here

Below is an extract from this 24 page Telco 2.0 Report that can be downloaded in full in PDF format by members of the Telco 2.0 Executive Briefing service and the Telco 2.0 Dealing with Disruption Stream here. Non-members can subscribe here, buy a Single User license for this report online here for £595 (+VAT for UK buyers), or for multi-user licenses or other enquiries, please email contact@telco2.net / call +44 (0) 207 247 5003. We’ll also be discussing our findings and more on Google at the Silicon Valley (27-28 March) and London (12-13 June) New Digital Economics Brainstorms.

To share this article easily, please click:


Executive Summary

Google appears to be suffering from a strategic identity crisis. It is the giant of search advertising but it also now owns a handset maker, fibre projects, an increasingly fragmented mobile operating system, a social network of questionable success, and a driverless car programme (among other things). It has a great reputation for innovation and creativity, but risks losing direction and value by trying to focus on too many strategies and initiatives.

We believe that Google needs to stop trying to copy what Apple and Facebook are doing, de-prioritise its ‘Hail Mary’ hunt for a strategy (e.g. driverless cars), and continue to build new solutions that serve better the customers who are already willing to pay – namely, advertisers.

It is our view that the companies who have created most value in the market have done so by solving a customer problem really well. Apple’s recent success derives from creating a simpler and more beautiful way (platform + products) for people to manage their digital lives. People pay because it’s appealing and it works.

Google initially solved how people could find relevant information online and then, critically, how to use this to help advertisers get more customers. They do this so well that Google’s $37bn revenues continue to grow at double digit pace, and there’s plenty of headroom in the market for now. While the TV strategy may not yet be paying off, it would seem sensible to keep working at it to try to keep extending the reach of Google’s platform. 

While Android keeps Google in the mobile game to a degree, and has certainly helped to constrain certain rivals, we think Google should cast a hard eye over its other competing and distracting activities: Motorola, Payments, Google +, Driverless Cars etc. Its management team should look at the size of the opportunity, the strength of the competition, and their ability to execute in each. 

Pruning the projects might also lose Google an adversary or two, and it might also afford some reward to shareholders too. After all, even Apple has recently decided to pay back some cash to investors.

This may be very difficult for Google’s current leadership. Larry Page seems to have the restless instincts of the stereotypical Valley venture capitalist, hunting the latest ideas, and constantly trying to create the next big beautiful thing. The trouble is that this is Google in 2012, not 1995, and it looks to us at least that a degree of ‘sticking to the knitting’ within Google’s huge, profitable and growing search advertising business may be a better bet than the highly speculative (and expensive) ‘Hail Mary’ strategy route. 

This may sound surprising coming from us, the inveterate fans of innovation at Telco 2.0, so we’d like to point out some important differences between the situations that Google and the telcos are in:

  • Google’s core markets are growing, not flat or shrinking, and are at a different life-stage to the telecoms market;
  • Google is global, rather than being confined to any given geography. There are many opportunities still out there.
  • We are not saying that Google should stop innovating, but we are saying it should focus its innovative energy more clearly on activities that grow the core business.

Introduction

In January this year, Google achieved a first – it missed the consensus forecast for its quarterly earnings. There is of course no magic in the consensus, which is an average of highly conventionalised guesses from a bunch of City analysts, but it is as good a moment as ever to review Google’s strategic position. If you bought Google stock at the beginning, you may not need to read this, as you’re probably very rich (the return since then is of the order of 400%). The entirety of this return, however, is accounted for by the 2004-2007 bull run. On a five-year basis, Google stock is ahead 30%, which sounds pretty impressive (a 6% annual return), but again, all the growth is accounted for by the last surge upwards over the summer of 2007. The peak was achieved on the 2nd of November, 2007. 

As this chart shows, Google stock is still down about 9% from the peak, and perhaps more importantly, its path tracks Microsoft very closely indeed. Plus Microsoft investors get a dividend, whereas Google investors do not.

Figure 1: Google, Microsoft 2.0?

Google, Microsoft 2.0?
Source: Google Finance

Larry Page is reported to have said that “Google is no longer a “search company.” He says its model is now 

“invent wild things that will help humanity, get them adopted by users, profit, and then use the corporate structure to keep inventing new things.”

No longer a search company? Take a look at the revenues. Out of Google’s $37.9bn in revenues in 2011, $36bn came from advertising, aka the flip side of Google Search. Despite a whole string of mammoth product launches since 2007, Google’s business is essentially what it was in 2007 – a massive search-based advertising machine.

Google’s Challenges

Our last Google coverage – Android: An Anti-Apple Virus ? and the Dealing with the Disruptors Strategy Report   suggested that the search giant was suffering from a lack of direction, although some of this was accounted for by a deliberate policy of experimenting and shutting down failed initiatives.

Since then, Google has launched Google +, closed Google Buzz, and closed Google Wave while releasing it into a second life as an open-source project. It has been involved in major litigation over patents and in regulatory inquiries. It has seen an enormous boom in Android shipments but not necessarily much revenue. It is about to become a major hardware manufacturer by acquiring Motorola. And it has embarked on extensive changes to the core search product and to company-wide UI design.

In this note, we will explore Google’s activities since our last note, summarise key threats to the business and strategies to counter them, and consider if a bearish view of the company is appropriate.

We’ve found it convenient to organise Google’s business  into several themed groups as follows:

1: Questionable Victories

Pyrrhic victory is defined as a victory so costly it is indistinguishable from defeat. Although there is nothing so bad at Google, it seems to have a knack of creating products that are hugely successful without necessarily generating cash. Android is exhibit A. 

The obvious point here is surging, soaring growth – forecasts for Android shipments have repeatedly been made, beaten on the upside, adjusted upwards, and then beaten again. Android has hugely expanded the market for smartphones overall, caused seismic change in the vendor industry, and triggered an intellectual property war. It has found its way into an awe-inspiring variety of devices and device classes.

But questions are still hanging over how much actual money is involved. During the Q4 results call, a figure for “mobile” revenues of $2.5bn was quoted. This turns out to consist of advertising served to browsers that present a mobile device user-agent string. However, Google lawyer Susan Creighton is on record as saying  that 66% of Google mobile web traffic originates from Apple iOS devices. It is hard to see how this can be accounted for as Android revenue.

Further, the much-trailed “fragmentation” began in 2011 with a vengeance. “Forkdroids”, devices using an operating system based on Android but extensively adapted (“forked” from the main development line), appeared in China and elsewhere. Amazon’s Kindle Fire tablet is an example closer to home.

And the intellectual property fights with Oracle, Apple, and others are a constant source of disruption and a potentially sizable leakage of revenue. In so far as Google’s motivation in acquiring Motorola Mobility was to get hold of its patent portfolio, this has already involved very large sums of money. Another counter-strategy is the partnership with Intel and Lenovo to produce x86-based Android devices, which cannot be cheap either and will probably mean even more fragmentation.

This is not the only example, though – think of Google Books, an extremely expensive product which caused a great deal of litigation, eventually got its way (although not all the issues are resolved), and is now an excellent free tool for searching in old books but no kind of profit centre. Further, Google’s patented automatic scanning has the unfortunate feature of pulling in marginalia, etc. from the original text that its rivals (such as Amazon Kindle) don’t.
Further, Google has recently been trying to monetise one of its classic products, the Google Maps API that essentially started the Web 2.0 phenomenon, with the result that several heavy users (notably Apple and Foursquare)  have migrated to the free OpenStreetMap project and its OpenLayers API.

2: Telco-isation

Like a telco, Google is dependent on one key source of revenue that cross-subsidises the rest of the company – search-based advertising. 

Figure 2: Google’s advertising revenues cascade into all other divisions

Google's Advertising Revenues Cascade

[NB TAC = Traffic Acquisition Cost, CoNR = Cost of Net Revenues]

Having proven to be a category killer for search and advertising across the  whole of the Internet, the twins (search and ads) are hugely critical for Google and also for millions of web sites, content creators, and applications developers. As a result, just like a telco, they are increasingly subject to regulation and political risk. 

Google search rankings have always been subject to an arms race between the black art of search-engine optimisation and Google engineers’ efforts to ensure the integrity of their results, but the whole issue has taken a more serious twist with the arrival of a Federal Trade Commission inquiry into Google’s business practices. The potential problems were dramatised by the so-called “white lady from Google”  incident at Google Kenya, where Google employees scraped a rival directory website’s customers and cold-called them, misrepresenting their competitors’ services, and further by the $500 million online pharmacy settlement. Similarly, the case of the Spanish camp site that wants to be disassociated from horrific photographs of a disaster demonstrates both that there is a demand for regulation and that sooner or later, a regulator or legislator will be tempted to supply it.

The decision to stream Google search quality meetings online should be seen in this light, as an effort to cover this political flank.

As well as the FTC, there is also substantial regulatory risk in the EU. The European Commission, in giving permission for the Motorola acquisition, also stated that it would consider further transactions involving Google and Motorola’s intellectual property on a case-by-case basis. To put it another way, after the Motorola deal, the Commission has set up a Google Alert for M&A activity involving Google.

3: Look & Feel Problems

Google is in the process of a far-reaching refresh of its user interfaces, graphic design, and core search product. The new look affects Search, GMail, and Google + so far, but is presumably going to roll out across the entire company. At the same time, they have begun to integrate Google + content into the search results.

This is, unsurprisingly, controversial and has attracted much criticism, so far only from the early adopter crowd. There is a need for real data to evaluate it. However, there are some reasons to think that Search is looking in the wrong place.

Since the major release codenamed Caffeine in 2008, Google Search engineers have been optimising the system for speed and for first-hit relevance, while also indexing rapidly-changing content faster by redesigning the process of “spidering” web sites to work in parallel. Since then, Google Instant has further concentrated on speed to the first result. In the Q4 results, it was suggested that mobile users are less valuable to Google than desktop ones. One reason for this may be that “obvious” search – Wikipedia in the first two hits – is well served by mobile apps. Some users find that Google’s “deep web” search has suffered.

Under “Google and your world”, recommendations drawn from Google + are being injected into search results. This is especially controversial for a mixture of privacy and user-experience reasons. Danny Sullivan’s SearchEngineLand, for example, argues that it harms relevance without adding enough private results to be of value. Further, doubt has been cast on Google’s numbers regarding the new policy of integrating Google accounts into G+ and G+ content into search.

Another, cogent criticism is that it introduces an element of personality that will render regulatory issues more troublesome. When Google’s results were visibly the output of an algorithm, it was easier for Google to claim that they were the work of impartial machines. If they are given agency and associated with individuals, it may be harder to deny that there is an element of editorial judgment and hence the possibility of bias involved.

Social search has been repeatedly mooted since the mid-2000s as the next-big-thing, but it seems hard to implement. Yahoo!, Facebook, and several others have tried and failed.

Figure 3: Google + on Google Trends: fading into the noise?

 Google + on Google Trends: Fading Into the Noise?
Source: Google Trends

It is possible that Google may have a structural weakness in design as opposed to engineering (which is as excellent as ever). This may explain why a succession of design-focused initiatives have failed – Wave and Buzz have been shut down, Google TV hasn’t gained traction (there are less than one million active devices), and feedback on the developer APIs is poor.

4: Palpable Project Proliferation

Google’s tendency to launch new products is as intimidating as ever. However, there is a strong argument that its tireless creativity lacks focus, and the hit-rate is worrying low. Does Google really need two cut-down OSs for ultra-mobile devices? It has both Android, and ChromeOS, and if the first was intended for mobile phones and the second for netbooks, you can now buy a netbook-like (but rather more powerful) Asus PC that runs Android. Further, Google supports a third operating system for its own internal purposes – the highly customised version of Linux that powers the Google Platform – and could be said to support a fourth, as it pays the Mozilla Foundation substantial amounts of money under the terms of their distribution agreement and their Boot to Gecko project is essentially a mobile OS. IBM also supported four operating systems at its historic peak in the 1980s.  

Also, does Google really need to operate an FTTH network, or own a smartphone vendor? The Larry Page quote we opened with tends to suggest that Google’s historical tendency to do experiments is at work, but both Google’s revenue raisers (Ads and YouTube, which from an economic point of view is part of the advertising business) date from the first three years as a public company. The only real hit Google has had for some time is Android, and as we have seen, it’s not clear that it makes serious money.

Google Wallet, for example, was launched with a blaze of publicity, but failed to attract support from either the financial or the telecoms industry, rather like its predecessor Google Checkout. It also failed to gain user adoption, but it has this in common with all NFC-based payments initiatives. Recently, a major security bug was discovered, and key staff have been leaving steadily, including the head of consumer payments. Another shutdown is probably on the cards. 

Meanwhile, a whole range of minor applications have been shuttered

Another heavily hyped project which does not seem to be gaining traction is the Chromebook, the hardware-as-a-service IT offering aimed at enterprises. This has been criticised on the basis that its $28/seat/month pricing is actually rather high. Over a typical 3 year depreciation cycle for IT equipment, it’s on a par with Apple laptops, and has the restriction that all the applications must work in a Web browser on netbook-class hardware. Google management has been promoting small contract wins in US school districts . Meanwhile, it is frequently observed that Google’s own PC fleet consists mostly of Apple hardware. If Google won’t use them itself, why should any other enterprise IT shop do so? The Google Search meeting linked above contains 2 Lenovo ThinkPads and 13 Apple MacBooks of various models and zero Chromebooks, while none other than Eric Schmidt used a Mac for his MWC 2012 keynote. Traditionally, Google insisted on “dogfooding” its products by using them internally.

The Google Fibre project in Kansas City, for its part, has been struggling with regulatory problems related to its access to city-owned civil infrastructure. Kansas City’s utility poles have reserved areas for different services, for example telecoms and electrical power. Google was given the concession to string the fibre in the more spacious electrical section – however, this requires high voltage electricians rather than telecoms installers to do the job and costs substantially more. Google has been trying to change the terms, and use the telecoms section, but (unsurprisingly) local cable and Bell operators are objecting. As with the muni-WLAN projects of the mid-2000s, the abortive attempt to market the Nexus One without the carriers, and Google Voice, Google has had to learn the hard way that telecoms is difficult.

And while all this has been going on, you might wonder where Google Enterprise 2.0 or Google Ads 2.0 are.

5. Google Play – a Collection of Challenges?

Google recently announced its “new ecosystem”, Google Play. This consists of what was historically known as the Android Market, plus Google Books, Google Music, and the web-based elements of Google Wallet (aka Google Checkout). All of these products are more or less challenged. Although the Android Market has been a success in distributing apps to the growing fleets of Android devices, it continues to contain an unusually high percentage of free apps, developer payouts tend to be lower than on its rivals, and it has had repeated problems with malware. Google Books has been an expensive hobby, involving substantial engineering work and litigation, and seems unlikely to be a profit centre. Google Music – as opposed to YouTube – is also no great success, and it is worth asking why both projects continue.

However, it will be the existing manager of Google Music who takes charge, with Android Market management moving out. It is worth noting that in fact there were two heads of the Android Market – Eric Chu for developer relations and David Conway for product management. This is not ideal in itself.

Further, an effort is being made to force app developers to use the ex-Google Checkout system for in-app billing. This obviously reflects an increased concern for monetisation, but it also suggests a degree of “arguing with the customers”.

To read the note in full, including the following additional analysis…

  • On the Other Hand…
  • Strengths of the Core Business
  • “Apple vs. Google”
  • Content acquisition
  • Summary Key Product Review
  • Search & Advertising
  • YouTube and Google TV
  • Communications Products
  • Android
  • Enterprise
  • Developer Products
  • Summary: Google Dashboard
  • Conclusion
  • Recommendations for Operators
  • The Telco 2.0™ Initiative
  • Index

…and the following figures…

  • Figure 1: Google, Microsoft 2.0?
  • Figure 2: Google’s advertising revenues cascade into all other divisions
  • Figure 3: Google + on Google Trends: fading into the noise?
  • Figure 4: Google’s Diverse Advertiser Base
  • Figure 5: Google’s Content Acquisition. 2008-2009, the missing data point
  • Figure 6: Google Product Dashboard

Members of the Telco 2.0 Executive Briefing Subscription Service and the Telco 2.0 Dealing with Disruption Stream can download the full 24 page report in PDF format hereNon-Members, please subscribe here, buy a Single User license for this report online here for £595 (+VAT for UK buyers), or for multi-user licenses or other enquiries, please email contact@telco2.net / call +44 (0) 207 247 5003.

Organisations, geographies, people and products referenced: AdSense, AdWords, Amazon, Android, Apple, Asus, AT&T, Australia, BBVA, Bell Labs, Boot to Gecko, Caffeine, CES, China, Chromebook, ChromeOS, ContentID, David Conway, Eric Chu, Eric Schmidt, European Commission, Facebook, Federal Trade Commission, GMail, Google, Google +, Google Books, Google Buzz, Google Checkout, Google Maps, Google Music, Google Play, Google TV, Google Voice, Google Wave, GSM, IBM, Intel, Kenya, Keyhole Software, Kindle Fire, Larry Page, Lenovo, Linux, MacBooks, Microsoft, Motorola, Mozilla Foundation, Netflix, Nexus, Office 365, OneNet, OpenLayers API, OpenStreetMap, Oracle, Susan Creighton, ThinkPads, VMWare, Vodafone, Western Electric, Wikipedia, Yahoo!, Your World, YouTube, Zynga

Technologies and industry terms referenced: advertisers, API, content acquisition costs, driverless car, Fibre, Forkdroids, M&A, mobile apps, muni-WLAN, NFC, Search, smart TV, spectrum, UI, VoIP, Wallet

Facebook: what the pre-IPO S-1 filing revealed

Summary: New figures released in Facebook’s S-1 filing for its IPO stack up with Telco 2.0’s previous analysis of Facebook’s performance for our report ‘Dealing with the Disruptors’. This further strengthens our views that many mooted valuations are overblown, and that Facebook will seek new sources of value in communications. (February 2012, Executive Briefing Service, Dealing with Disruption Stream).

Facebook user saturation bubble chart

  Read in Full (Members only)  Buy a single user license online  To Subscribe click here

Below is an extract from this 23 page Telco 2.0 Report that can be downloaded in full in PDF format by members of the Telco 2.0 Executive Briefing service and the Telco 2.0 Dealing with Disruption Stream here. Non-members can subscribe here, buy a Single User license for this report online here for £595 (+VAT for UK buyers), or for multi-user licenses or other enquiries, please email contact@telco2.net / call +44 (0) 207 247 5003. We’ll also be discussing our findings and more on Facebook at the Silicon Valley (27-28 March) and London (12-13 June) New Digital Economics Brainstorms.

To share this article easily, please click:


Introduction

The Facebook public share flotation is underway and as part of the process, it has published its first set of financial statements which detail financial trading and key performance indicators for the previous three years for their S-1 filing with the US Securities Exchange Commission (SEC)

The Telco 2.0 Team has recently analysed Facebook’s strategy and business model in our strategy report Dealing with the ‘Disruptors’: Google, Apple, Facebook, Microsoft/Skype and Amazon. Back in August 2011 we published a preview (Facebook: really ‘worth’ $30 billion max – $100 billion is hype), and we’ve now taken the opportunity to revisit our analysis in the light of the new data from Facebook’s S-1 filing.

Overview of findings

Figure 1: STL Forecast vs. Actuals from Facebook S-1

2011 (figures in millions)

Facebook S-1

Telco 2.0 forecast

Users

845

800

Revenue

$3,711

$3,500

Free Cash Flow

$470

$438

Facebook has a remarkable set of financials for a company so young.

Nonetheless, the Telco 2.0 Team stands by its original model and conclusions, which were that many mooted valuations of Facebook were too high given its current services and growth profile, and that the discrepancy would compel Facebook to expand into adjacent fields. The publication of the Facebook Initial Public Offering (IPO) affirms this belief. If Facebook attains anywhere near the expected valuation, they will have a share currency which will make expansion through mergers and acquisitions easier to achieve.

Our valuation of Facebook was US$30bn and we see no trading or key performance indicators in the S-1 filing which would make us alter our valuation. This compares to various reports which indicate a valuation for Facebook of US$100bn.

Our estimates (reviewed in this report) imply a p/e of 30 at launch, which would be consistent with Facebook being considered more of a growth stock than the Google of 2011, in an environment much less bullish than that of 2004.

Though as our friend Richard Kramer, MD of Arete financial research says, “tech stock valuations are frequently irrational”, so the market may well go crazy for Facebook at IPO. However, there has to be a point where reality bites, and the pressure on Facebook to find new revenues will be intense.

Section 2: Peer Comparison

The Facebook IPO filing allows a comparison with two companies who built great businesses built upon networks: Search (as represented by Google) and Mobile (as represented by Vodafone)

Figure 1: Three major tech companies, the first nine years

Facebook google Vodafone first 9 years revenue

Source: STL Partners analysis of company records

A good start

Vodafone and Facebook show similar revenue growth over the first nine years. However, Google stands out because it is all about discovery, and for advertisers, generates potential leads. As we’ve said before, this is a huge challenge for Facebook moving forward: how can it move beyond brand advertising to lead generation, or failing that, getting users to pay for services via Facebook Credits.

Figure 2: A Dash to 45+% Margins

Facebook Google Vodafone first 9 years EBITDA

Source: STL Partners analysis of company records

Facebook has the highest profit (EBITDA) margin at this stage of development even though, as advertising-funded businesses, both Facebook and Google suffered early start-up losses while building the audience and attention that appeal to advertisers.

However, when we examine the current state in terms of absolute revenues, cash and profits, Facebook is far behind both Vodafone and Google in absolute numbers, and requires huge ongoing growth to deserve anywhere near the valuation of $100bn quoted in some quarters.

Figure 3: Comparisons: Facebook, Google, Vodafone

2011 Results

Facebook

Google

Vodafone (*)

Revenue

$1.55bn

$37.9bn

$72.6bn

Free Cash Flow

$0.470bn

$11.1bn

$11.1bn

Enterprise Value (Market Capitalisation plus/(minus) Net Debt/(Cash)

$100bn (#)

$153bn

$181bn

*Vodafone figures are for the year 2010/11 (ending Mar-2011) and converted to $’s using cable rate of 1.58.

#The IPO price of Facebook has not yet been fixed, but the press seem focussed upon a $100bn valuation

To read the note in full, including the following analysis…

  • Section 1: Introduction
  • Overview of findings
  • Section 2: Peer Comparison
  • Section 3: Exploring Growth Opportunities
  • 3.1 The challenges of continuing growth
  • 3.2 Attracting More Attention
  • 3.3 Selling More Ads
  • 3.4 Getting more from mobile
  • 3.5 Extending payments
  • 3.6 Moving into communications
  • 3.7 Facebook Web Services
  • 3.8 Possible Acquisitions
  • 4. Risks
  • 4.1 Privacy
  • 4.2 Competition
  • 4.3 The “Once Cool Nightclub Effect”
  • 5. Summary
  • Index


…and the following charts…

  • Figure 1: STL Forecast vs. Actuals from Facebook S-1
  • Figure 2: Three major tech companies, the first nine years
  • Figure 3: A Dash to 45+% Margins
  • Figure 4: Comparisons: Facebook, Google, Vodafone
  • Figure 5: Facebook Geographical Breakdown
  • Figure 6: Facebook Struggling in Asia
  • Figure 7: Tapping Out the User Pool
  • Figure 8: Leading User Engagement
  • Figure 9: Social Networks – biggest single category by user time online
  • Figure 10: Advertising Dominates Facebook’s Revenue
  • Figure 11: ARPU flat for last 12 months
  • Figure 12: Revenue-generating dominated by the USA
  • Figure 13: Consolidation in display ads may have some way to run yet
  • Figure 14: Google + Explodes Out Of The Blocks
  • Figure 15: STL Partners Facebook valuation assumptions


Members of the Telco 2.0 Executive Briefing Subscription Service and the Telco 2.0 Dealing with Disruption Stream can download the full 23 page report in PDF format here. Non-Members, please subscribe here, buy a Single User license for this report online here for £595 (+VAT for UK buyers), or for multi-user licenses or other enquiries, please email contact@telco2.net / call +44 (0) 207 247 5003.

Organisations, geographies, people and products referenced: 0.facebook.com, Amazon, Amazon Web Services (AWS), AOL, Apple, Arete, Asia, Bebo, China, Comscore, Deezer, Deutsche Telekom, Europe, Facebook, Facebook Credits, Friends Reunited, Google, Google +, Google Buzz, ITV, Japan, Korea, LiveJournal, Microsoft, MySpace, Netflix, newsfeeds, North America, Opera, Orkut, Pandora, Richard Kramer, RIM, Skype, Sponsored Stories, Spotify, Twitter, UK, US Securities Exchange Commission (SEC), USA Vodafone, WhatsApp, Yahoo!, YouTube, Zynga.

Technologies and industry terms referenced: Advertising, ARPU, Bass diffusion model, EBITDA, Facebook fatigue, gaming, Initial Public Offering (IPO), Mobile, monthly active users (MAU), music, platform, Privacy, S-1, Search, Social Networks, valuation, video.

Your Text is on Fire: OTT’s to burn 40% SMS revenue by 2015

Introduction

Background

STL Partners’ New Digital Economics Executive Brainstorm EMEA, took place from 8-10 November in London, and brought together 5 events in 1 venue, co-locating the Telco 2.0, M-Commerce, 2.0 Cloud 2.0, M2M 2.0 and Digital Entertainment 2.0 brainstorms, using a unique and widely acclaimed interactive format called ‘Mindshare’ to help clarify the important ‘next steps’ for both individual companies and industries.

Building on output from previous brainstorms and new market research and analysis from STL Partners, it focuses on new growth opportunities at the intersection of Telecoms, Media and Technology. The keynote Strategy Report Dealing with the ‘Disruptors’: Google, Apple, Facebook, Microsoft/Skype and Amazon was launched at the brainstorm, and a similar agenda will be discussed at the New Digital Economics – APAC Brainstorm, Accelerating New Growth Opportunities in Telecoms, Media and Tech, 30 November – 1 December, Capella Resort, Singapore.

This note provides an extract of key take-outs and votes on the ‘Voice and Messaging 2.0’ sessions from the EMEA brainstorm for Telco 2.0 readers and subscribers.

Brainstorm participants will also receive detailed write-ups and analysis from the event sessions they registered for, and we will be using the input from all the sessions of the EMEA, Americas and APAC brainstorms as input to new analysis across all of the topics covered in the coming months.

The telco business model challenge is getting acute in EMEA

Your text platform is on fire

Telco SMS revenue will decline on average by around 40% across the Europe and Middle East region by 2015 according to the senior execs at this month’s Telco 2.0 brainstorm in London. The main cause is competitive pressure from so-called ‘Over-The-Top’ (OTT) alternatives (Facebook, Skype, Google, BBM, etc).

Figure 1 – Predicted decline of mobile telco messaging revenues

EMEA 2011 Messaging Decline Chart 40% Telco 2.0


The cause of this predicted decline was unambiguous – the impact of so-called Over The Top (OTT) players’ messaging services like iMessage, BlackBerry Messenger, Whatsapp, Skype and Facebook.

Figure 2 – Causes of predicted mobile messaging decline

EMEA 2011 Messaging Decline Chart OTT Causes Telco 2.0

This is similar to the impact of the new services that we saw predicted in the survey conducted across 300 senior execs in the research for our latest report Dealing with the ‘Disruptors’: Google, Apple, Facebook, Microsoft/Skype and Amazon.

Indeed, KPN and some Middle-Eastern operators have reported even higher percentage declines among users of certain devices and applications.

The Voice platform is smoking too

While not as pressing as the impact on Messaging revenues, delegates had a pessimistic view of the prospects for voice revenues.

Figure 3 – Predicted decline of mobile carrier voice revenues

EMEA 2011 Voice Decline Chart 20% Telco 2.0

The causes behind the voice declines were seen as somewhat broader, with competition and regulation taking up 56% compared to 16% for Messaging, although ‘Responding to price pressures from OTT alternatives’ was still the main choice with 44% of the vote.

Figure 4 – Causes of predicted mobile voice revenue decline

EMEA 2011 Voice Decline Chart 20% reasons Telco 2.0

All in all, it looks as if the pressures on voice and messaging revenues are beginning to bite as we originally predicted in our 2008 strategy report Lessons from Internet Communications Services – Skype, Facebook, and others: how Telcos can adapt and compete – although the options for adaptation and competition have narrowed somewhat due to the success of the so-called OTT players and the relative lack of action by telcos.

Who should telcos fear most?

Delegates did not have an entirely consistent view of the threats and opportunities presented by the OTT players as shown below.

Figure 5 – Who should telcos support / fear most in voice and messaging?

EMEA 2011 Voice and Messaging Decline Chart OTT Fears Telco 2.0

This is not entirely surprising given the relative attractions and perils presented in different scenarios as we describe in Dealing with the ‘Disruptors’: Google, Apple, Facebook, Microsoft/Skype and Amazon.

However, what is consistent for operators is that:

  • There is most to gain, in the short-term at least, in supporting Microsoft as a counterweight to Apple and Google;
  • RIM / Blackberry is perceived to have the least power – and also presents a opportunity as a counterweight to Apple and Google, albeit a weakened one;
  • Facebook is indeed a ‘double-edged sword’ – as a threat in terms of its potential to enter communications and an opportunity in driving data use;
  • Apple and Google are the established players with the most current power, and hence threat.

Will RCS-e help?

At the November 2011 EMEA Brainstorm, Cenk Serdar, Director, Data & Communications Service, Vodafone, and Rainer Deutschmann, SVP Core Telco Products, DTAG, carried out a live demonstration of RCS-e, the GSMA-backed future voice & messaging solution using IMS. Morten Sorby, EVP of Strategy & Regulatory Affairs, Telenor, and Andreas Bernstrom, CEO, Rebtel, joined the vibrant subsequent debate with the audience and Simon Torrance, CEO STL Partners.

The following is an anonymised top-level summary of the resulting discussions and the votes.

Getting to market

Instant messaging, video, and file-sharing are the key features in RCS-e, and are being introduced as a refined set compared to the original specifications in order to bring applications to market as quickly as possible. This refinement was lead by the E5 Group of top European operators.

The most important item on the future roadmap is service discovery. Beyond that, contacts transfer, location sharing, and multi-device operation are on the to-do list.

Interestingly, it seems that some of the RCS-e use cases focus on supporting enterprise applications such as trying to provide a platform for better CRM and person-to-organisation applications (for example, an enhanced helpdesk for a furniture company). This has consequences for the design of APIs and business relationships facing upstream towards enterprises and developers.

Arguments for success or failure

Arguments put forward at the Brainstorm for RCS-e included:

  • While Apple’s iMessenger and RIM’s BlackBerry Messenger are impressive products, they aren’t ubiquitious or necessarily deeply integrated with other applications in the way that SMS, MMS, and telephony could be.
  • RCS-e doesn’t require the user to download any new apps – the vast majority of users aren’t already using sophisticated communications tools like smartphones.
  • RCS-e ‘is a service for mass-market users’ rather than just smartphones.
  • Seven of the major device makers are committed, and the RCS-e standard is an open standard, so nothing prevents Apple iOS or RIM BBX developers implementing it independently.
  • RCS-e is building its global footprint. Spain, France, and Germany will launch sequentially between now and the first half of 2012. South Korea is committed to deploying RCS-e, and discussions were going on with other Asian countries.

Arguments put forward against RCS-e included:

  • Smartphones will change customer behaviour and catalyse change as more people get them. Horace Dediu, Associate Analyst at STL Partners, predicts that Western Europe and North America will go 100% smartphone within 18 months – so control will be further ceded to the Smartphone OS owners.
  • Cost is the main reason users move to Skype and similar services, and RCS-e doesn’t reduce costs.
  • The feature set just isn’t that convincing compared to what else can be done using VOIP services and other smartphone apps.

Delegates were split in their views on the likely efficacy of RCS.

Figure 6 – Will RCS-e offer an attractive alternative to OTT services?

EMEA 2011 RCS-e attractive vs OTT Telco 2.0 chart

Telco 2.0’s questions

The value of RCS-e is a subject that stirs strong opinions from across the industry, and it was intriguing to see the extreme polarity of delegate views at the Brainstorm.

Figure 7 – Is RCS-e ‘too little too late’?

EMEA 2011 RCS-e too little too late Telco 2.0 chart

Telco 2.0 will be conducting an in-depth analysis of Messaging and Voice 2.0 strategies, including RCS-e and its prospects in coming months.

Our questions on RCS-e at this point are as follows.

How many Christmas 2012 handsets will have RCS-e?

An critical factor is whether the wave of cheap smartphones will support RCS-e and if so, whether they support it well or only half-heartedly. The great bulk of them will be Android devices, and therefore the key vendors will be HTC and Samsung.
HTC are signed up, but their device line-up is concentrated on the high end, and they are very much second to Samsung in terms of volume.

Samsung is shipping more Androids than any other vendor, and indeed more smartphones than any other vendor, and they have a portfolio of products from the Ace to the Galaxy S II rather than a single top-end hero product. A key question is to what extent across their handset range they will sign up to RCS-e.

Are the features really convincing?

It is notoriously difficult to accurately predict the appeal of features in advance of consumer trials. However, a challenge for operators will be that, unlike Apple, they will have limited control of the design and implementation of the end-to-end customer experience.
How quickly can RCS-e evolve?

An important issue regarding services “embedded” in the core network or the device operating system is that they are unlikely to get upgrades anywhere near as quickly as either standalone applications or Web services. Operators tend to be slow to push out OTA upgrades to device OS, even after the manufacturers release them, and software iterations in the core network are taken slowly for very good reasons. App developers and Web 2.0 players tend to have much faster development cycles, so in terms of both user experience design control and release iteration operators are at a disadvantage.

What is RCS-e realistically intended to achieve now?

Opinions vary on what RCS-e is meant to achieve for operators, though few people we’ve spoken to in private recently believe that RCS-e is a ‘silver-bullet’ to combat so-called ‘OTT’ revenue erosion. Indeed, there appears to be a growing minority who appear to have ‘given up’ on voice and messaging revenues.

A more tenable position perhaps is that RCS-e may help a little, and that extending the life of the Messaging and Voice revenue streams by only a few months would justify the business case. One argument we’ve heard is that RCS-e is about enhancing and protecting the telco services bundle of minutes, texts, and data.

In a wider sense, it is a move by operators to provide something new to consumers, and it may at least be a small step to revitalise their relevance to consumers. In our view, it is far from the only strategy that operators should explore.

Content

  • What else can be done?
  • A new strategy framework for Messaging and Voice 2.0 Strategies
  • Developing alternative sources of value


  • Figure 1 – Predicted decline of mobile telco messaging revenues
  • Figure 2 – Causes of predicted mobile messaging decline
  • Figure 3 – Predicted decline of mobile carrier voice revenues
  • Figure 4 – Causes of predicted mobile voice revenue decline
  • Figure 5 – Who should telcos support / fear most in voice and messaging?
  • Figure 6 – Will RCS-e offer an attractive alternative to OTT services?
  • Figure 7 – Is RCS-e ‘too little too late’?
  • Figure 8 – Strategic Messaging and Voice options for operators