Solution: Transforming to the Telco Cloud Service Provider (Part 2)

Introduction

Structural barriers preventing telecoms business model change

In our recent report, Problem: Telecoms technology inhibits operator business model change (Part 1), we explained how financial and operational processes that have been adopted in response to investor requirements and regulation have prevented operators from innovating.

Operator management teams make large investments over seven- or eight-year investment cycles and are responsible for deploying and managing the networks from which revenues flow.  As we show in Figure 1 below, operators therefore have much more of their costs tied up in capital expenditure than platform players or product innovators.  Furthermore, they need large quantities of operating expenditure to maintain and operate their networks.  The result is a rather small percentage of revenue – we estimate around 15% – which they devote to activities focused on innovation: marketing, sales, customer care, and product and service development (the green section of the bars).  This compares unfavourably to a platform player, such as Google, which we estimate devotes around 35% of revenue to these activities.  The difference is even more pronounced with a product innovator, such as Unilever, which minimises capital investment by outsourcing some of its manufacturing and all product distribution and so devotes nearly 70% of revenue to ‘innovation’ activities.


Figure 1: The telecoms cost structure inhibits innovation

Sources: Company accounts; STL Partners estimates and analysis

Seen in this context, how can anyone expect operators to be successful at developing new platforms, channels, or products?


  • Executive Summary
  • Introduction
  • Structural barriers preventing telecoms business model change
  • Digital service innovation is proving tough for operators
  • Structural barriers coming down?
  • Virtualisation + cloud business practices could transform the telecoms business model
  • The drive for virtualisation is underway
  • Cost reduction and a new cost structure
  • Cloud business practices are a critical component in the future telco
  • The Telco Cloud Service Provider (TCSP)
  • Two benefits from becoming a Telco Cloud Service Provider
  • Product and service creation in the Telco Cloud Service Provider
  • From incremental and slow innovation today…
  • …to radical and fast innovation in the TCSP of tomorrow


  • Figure 1: The telecoms cost structure inhibits innovation
  • Figure 2: Telcos have struggled to launch successful digital services
  • Figure 3: Cloud and virtualisation can allow a telco to transform its cost structure
  • Figure 4: Cloud business practices – key principles
  • Figure 5: Defining the Telco Cloud Service Provider
  • Figure 6: Telco Cloud can spur transformation across the entire telco business
  • Figure 7: Product development – telco today vs Telco Cloud Service Provider

MWC 2016 Overview: 5G, the Cloud, and the Internet of Things

This 8 page Telco 2.0 report gives an overview of MWC 2016 and what we took away from it, including…

  • Executive Summary
  • 5G: The Pace Picks Up
  • Networks are Software
  • The Internet of Many Fewer Things Than Expected is Here
  • Conclusion

Members of the Executive Briefing Service can also access the following additional MWC 2016 reports:

Telefónica’s NFV: An Empire Divided?

Objectives and strategic rationale

There are two main strategic drivers behind Telefónica’s NFV play. First, there is a stark operational imperative around the need to accommodate increasing demands on the network while reducing costs. In a briefing to journalists that publicly launched Telefónica’s NFV transformation, the operator’s CTO of Global Resources Enrique Blanco explained that the operator could achieve 10% to 15% efficiency savings using its existing network technology deployments, whereas it faced a 25% to 30% annual growth in traffic, much of which occurred on the fixed network but was generated by wireless devices connected to WiFi. Behind these operational factors lie financial concerns, with highly challenged margins and poor shareholder returns over a number of years.

Telefónica believes it can achieve a reduction in opex of up to 30% through NFV, while the technology will also enable new services to be introduced more rapidly and network resources to be used more efficiently. For example, according to the operator, it can take up to four months to add capacity to a traditional IMS based on a single-vendor hardware and software solution. Using a virtualized IMS, it will in theory be possible to carry out the requisite upgrades in hours or even minutes, with the possibility to add capacity through simple software upgrades or swap-outs. In addition, a key factor for Telefónica – and one that appears to be front of mind in the CTO’s office – is the ability to rationalize the network and service platforms across its multinational operations, including its global enterprise networking business and numerous Latin American subsidiaries. From this perspective, NFV should enable network resources to be shared and standardized internationally, so that some markets would no longer need their own physical network elements.2 However, the parts of Telefónica’s organization driving the open-source NFV infrastructure model appear to take a different view on this (to be discussed further below).

The second main driver behind the program – and one that corresponds to the open-standards emphasis adopted by Telefónica’s I+D (R&D) department – is the aim of adding impetus to overall industry transformation around NFV. A global player such as Telefónica throwing its weight behind NFV sends an important signal to the industry that virtualization is moving from the laboratory testing stage to commercial deployment, and that it will effect a comprehensive transformation of operators’ networks and organizations. In this sense, Telefónica’s launch of its NFV program can be seen as intended to galvanize the industry, and in particular the vendor ecosystem, into collaborating seriously with it to develop production-ready, carrier-grade implementations of NFV.

A key aim here is to ensure that vendors build their VNFs (Virtual Network Functions) and NFV platforms around genuinely open standards, rather than proprietary implementations that risk locking operators in to particular vendors. This dependency on proprietary vendor solutions, with a consequent increase in costs and decline in operational agility, is one of the main things that Telefónica and the industry at large are seeking to eliminate through NFV. But to achieve this objective requires a healthy ecosystem of vendors working around common standards and models. As things have worked out, Telefónica has tried out both a lead-vendor and multi-vendor approach to realizing its objectives – corresponding to the two strategic and technological perspectives sketched out here – and Telefónica’s NFV journey has been marked by a confusing swing between one and the other.

…to access the other 14 pages of this 15 page Telco 2.0 Report, including…

  • Executive Summary
  • Objectives and strategic rationale
  • Progress and key milestones
  • Conclusion: bringing it all together – Where’s Alierta?

…and the following report figures…

  • Figure 1: Telefónica’s initial virtualization objectives
  • Figure 2: By March 2015, Telefonica’s virtualization timetable had changed significantly

Problem: Telecoms technology inhibits operator business model change (Part 1)

Introduction

Everyone loves to moan about telcos

‘I just can’t seem to get anything done, it is like running through treacle.’

‘We gave up trying to partner with operators – they are too slow.’

‘Why are telcos unable to make the most basic improvements in their service offerings?’

‘They are called operators for a reason: they operate networks. But they can’t innovate and don’t know the first thing about marketing or customer service.’

Anyone within the telecoms industry will have heard these or similar expressions of dissatisfaction from colleagues, partners and customers.  It seems that despite providing the connectivity and communications services that have truly changed the world in the last 20 years, operators are unloved.  Everyone, and I think we are all guilty of this, feels that operators could do so much better.  There is a feeling that these huge organisations are almost wilfully seeking to be slow and inflexible – as if there is malice in the way they do business.

But the telecoms industry employs millions of people globally. It pays quite well and so attracts talent. Many, for example, have already enjoyed success in other industries. But nobody has yet, it seems, been able to make a telco, let alone the industry, fast, agile, and innovative.

Why not?

A structural problem

In this report, we argue that nobody is at fault for the perceived woes of telecoms operators.  Indeed, the difficulty the industry is facing in changing its business model is a result of financial and operational processes that have been adopted and refined over years in response to investor requirements and regulation.  In turn, investors and regulators have created such requirements as a result of technological constraints that have applied, even with ongoing improvements, to fixed and mobile telecommunications for decades. In essence, operators are constrained by the very structures that were put in place to ensure their success.

So should we give up?

If the limitations of telecoms operators is structural then it is easy to assume that change and development is impossible.  Certainly sceptics have plenty of empirical evidence for this view.  But as we outline in this report and will cover in more detail in a follow up to be published in early February 2016 (Answer: How 5G + Cloud + NFV can create the ‘agile telco’), changes in technology should have a profound impact on telecoms operators ability to become more flexible and innovative and so thrive in the fast-paced digital world.

Customer satisfaction is proving elusive in mature markets

Telecoms operators perform materially worst on customer service than other players in the US and UK

Improving customer experience has become something of a mantra within telecoms in the last few years. Many operators use Net Promoter Scores (NPS) as a way of measuring their performance, and the concept of ‘putting the customer first’ has gained in popularity as the industry has matured and new customers have become harder to find. Yet customer satisfaction remains low.

The American Customer Satisfaction Index (ACSI) publishes annual figures for customer satisfaction based on extensive consumer surveys. Telecommunications companies consistently come out towards the bottom of the range (scoring 65-70 out of 100). By contrasts internet and content players such as Amazon, Google, Apple and Netflix have much more satisfied customers and score 80+ – see Figure 1.

Figure 1: Customers are generally dissatisfied with telecoms companies


Source: American Customer Satisfaction index (http://www.theacsi.org/the-american-customer-satisfaction-index); STL Partners analysis

The story in the UK is similar.  The UK Customer Satisfaction Index, using a similar methodology to its US counterpart, places the Telecommunications and Media industry as the second-worst performer across 13 industry sectors scoring 71.7 in 2015 compared to a UK average of 76.2 and the best-performing sector, Non-food Retail, on 81.6.

Poor customer services scores are a lead indicator for poor financial performance

Most concerning for the telecoms industry is the work that ACSI has undertaken showing that customer satisfaction is linked to the financial performance of the overall economy and the performance of individual sectors and companies. The organisation states:

  • Customer satisfaction is a leading indicator of company financial performance. Stocks of companies with high ACSI scores tend to do better than those of companies with low scores.
  • Changes in customer satisfaction affect the general willingness of households to buy. As such, price-adjusted ACSI is a leading indicator of consumer spending growth and has accounted for more of the variation in future spending growth than any other single factor.

Source: American Customer Satisfaction index (http://www.theacsi.org/about-acsi/key-acsi-findings)  

In other words, consistently poor performance by all major players in the telecoms industry in the US and UK suggests aspirations of growth may be wildly optimistic. Put simply, why would customers buy more services from companies they don’t like? This bodes ill for the financial performance of telecoms operators going forward.

Senior management within telecoms knows this. They want to improve customer satisfaction by offering new and better services and customer care. But change has proved incredibly difficult and other more agile players always seem to beat operators to the punch. The next section shows why.


  • Introduction
  • Everyone loves to moan about telcos
  • A structural problem
  • So should we give up?
  • Customer satisfaction is proving elusive in mature markets
  • Telecoms operators perform materially worst on customer service than other players in the US and UK
  • Poor customer services scores are a lead indicator for poor financial performance
  • ‘One-function’ telecommunications technology stymies innovation and growth
  • Telecoms has always been an ‘infrastructure play’
  • …which means inflexibility and lack of innovation is hard-wired into the operating model
  • Why ‘Telco 2.0’ is so important for operators
  • Telco 2.0 aspirations remain thwarted
  • Technology can truly ‘change the game’ for operators


  • Figure 1: Customers are generally dissatisfied with telecoms companies
  • Figure 2: Historically, capital deployment has driven telecoms revenue
  • Figure 3: Financial & operational metrics for Infrastructure player (Vodafone) vs Platform (Google) & Product Innovator (Unilever)

The Open Source Telco: Taking Control of Destiny

Preface

This report examines the approaches to open source software – broadly, software for which the source code is freely available for use, subject to certain licensing conditions – of telecoms operators globally. Several factors have come together in recent years to make the role of open source software an important and dynamic area of debate for operators, including:

  • Technological Progress: Advances in core networking technologies, especially network functions virtualisation (NFV) and software-defined networking (SDN), are closely associated with open source software and initiatives, such as OPNFV and OpenDaylight. Many operators are actively participating in these initiatives, as well as trialling their software and, in some cases, moving them into production. This represents a fundamental shift away from the industry’s traditional, proprietary, vendor-procured model.
    • Why are we now seeing more open source activities around core communications technologies?
  • Financial Pressure: However, over-the-top (OTT) disintermediation, regulation and adverse macroeconomic conditions have led to reduced core communications revenues for operators in both developed and emerging markets alike. As a result, operators are exploring opportunities to move away from their core, infrastructure business, and compete in the more software-centric services layer.
    • How do the Internet players use open source software, and what are the lessons for operators?
  • The Need for Agility: In general, there is recognition within the telecoms industry that operators need to become more ‘agile’ if they are to succeed in the new, rapidly-changing ICT world, and greater use of open source software is seen by many as a key enabler of this transformation.
    • How can the use of open source software increase operator agility?

The answers to these questions, and more, are the topic of this report, which is sponsored by Dialogic and independently produced by STL Partners. The report draws on a series of 21 interviews conducted by STL Partners with senior technologists, strategists and product managers from telecoms operators globally.

Figure 1: Split of Interviewees by Business Area

Source: STL Partners

Introduction

Open source is less optional than it once was – even for Apple and Microsoft

From the audience’s point of view, the most important announcement at Apple’s Worldwide Developer Conference (WWDC) this year was not the new versions of iOS and OS X, or even its Spotify-challenging Apple Music service. Instead, it was the announcement that Apple’s highly popular programming language ‘Swift’ was to be made open source, where open source software is broadly defined as software for which the source code is freely available for use – subject to certain licensing conditions.

On one level, therefore, this represents a clever engagement strategy with developers. Open source software uptake has increased rapidly during the last 15 years, most famously embodied by the Linux operating system (OS), and with this developers have demonstrated a growing preference for open source tools and platforms. Since Apple has generally pushed developers towards proprietary development tools, and away from third-party ones (such as Adobe Flash), this is significant in itself.

An indication of open source’s growth can be found in OS market shares in consumer electronics devices. As Figure 2 shows below, Android (open source) had a 49% share of shipments in 2014; if we include the various other open source OS’s in ‘other’, this increases to more than 50%.

Figure 2: Share of consumer electronics shipments* by OS, 2014

Source: Gartner
* Includes smartphones, tablets, laptops and desktop PCs

However, one of the components being open sourced is Swift’s (proprietary) compiler – a program that translates written code into an executable program that a computer system understands. The implication of this is that, in theory, we could even see Swift applications running on non-Apple devices in the future. In other words, Apple believes the risk of Swift being used on Android is outweighed by the reward of engaging with the developer community through open source.

Whilst some technology companies, especially the likes of Facebook, Google and Netflix, are well known for their activities in open source, Apple is a company famous for its proprietary approach to both hardware and software. This, combined with similar activities by Microsoft (who open sourced its .NET framework in 2014), suggest that open source is now less optional than it once was.

Open source is both an old and a new concept for operators

At first glance, open source also appears to now be less optional for telecoms operators, who traditionally procure proprietary software (and hardware) from third-party vendors. Whilst many (but not all) operators have been using open source software for some time, such as Linux and various open source databases in the IT domain (e.g. MySQL), we have in the last 2-3 years seen a step-change in operator interest in open source across multiple domains. The following quote, taken directly from the interviews, summarises the situation nicely:

“Open source is both an old and a new project for many operators: old in the sense that we have been using Linux, FreeBSD, and others for a number of years; new in the sense that open source is moving out of the IT domain and towards new areas of the industry.” 

AT&T, for example, has been speaking widely about its ‘Domain 2.0’ programme. Domain 2.0 has the objectives to transform AT&T’s technical infrastructure to incorporate network functions virtualisation (NFV) and software-defined networking (SDN), to mandate a higher degree of interoperability, and to broaden the range of alternative suppliers available across its core business. By 2020, AT&T hopes to virtualise 75% of its network functions, and it sees open source as accounting for up to 50% of this. AT&T, like many other operators, is also a member of various recently-formed initiatives and foundations around NFV and SDN, such as OPNFV – Figure 3 lists some below.

Figure 3: OPNFV Platinum Members

Source: OPNFV website

However, based on publicly-available information, other operators might appear to have lesser ambitions in this space. As ever, the situation is more complex than it first appears: other operators do have significant ambitions in open source and, despite the headlines NFV and SDN draw, there are many other business areas in which open source is playing (or will play) an important role. Figure 4 below includes three quotes from the interviews which highlight this broad spectrum of opinion:

Figure 4: Different attitudes of operators to open source – selected interview quotes

Source: STL Partners interviews

Key Questions to be Addressed

We therefore have many questions which need to be addressed concerning operator attitudes to open source software, adoption (by area of business), and more:

  1. What is open source software, what are its major initiatives, and who uses it most widely today?
  2. What are the most important advantages and disadvantages of open source software? 
  3. To what extent are telecoms operators using open source software today? Why, and where?
  4. What are the key barriers to operator adoption of open source software?
  5. Prospects: How will this situation change?

These are now addressed in turn.

  • Preface
  • Executive Summary
  • Introduction
  • Open source is less optional than it once was – even for Apple and Microsoft
  • Open source is both an old and a new concept for operators
  • Key Questions to be Addressed
  • Understanding Open Source Software
  • The Theory: Freely available, licensed source code
  • The Industry: Dominated by key initiatives and contributors
  • Research Findings: Evaluating Open Source
  • Open source has both advantages and disadvantages
  • Debunking Myths: Open source’s performance and security
  • Where are telcos using open source today?
  • Transformation of telcos’ service portfolios is making open source more relevant than ever…
  • … and three key factors determine where operators are using open source software today
  • Open Source Adoption: Business Critical vs. Service Area
  • Barriers to Telco Adoption of Open Source
  • Two ‘external’ barriers by the industry’s nature
  • Three ‘internal’ barriers which can (and must) change
  • Prospects and Recommendations
  • Prospects: An open source evolution, not revolution
  • Open Source, Transformation, and Six Key Recommendations
  • About STL Partners and Telco 2.0
  • About Dialogic


  • Figure 1: Split of Interviewees by Business Area
  • Figure 2: Share of consumer electronics shipments* by OS, 2014
  • Figure 3: OPNFV Platinum Members
  • Figure 4: Different attitudes of operators to open source – selected interview quotes
  • Figure 5: The Open IT Ecosystem (incl. key industry bodies)
  • Figure 6: Three Forms of Governance in Open Source Software Projects
  • Figure 7: Three Classes of Open Source Software License
  • Figure 8: Web Server Share of Active Sites by Developer, 2000-2015
  • Figure 9: Leading software companies vs. Red Hat, market capitalisation, Oct. 2015
  • Figure 10: The Key Advantages and Disadvantages of Open Source Software
  • Figure 11: How Google Works – Failing Well
  • Figure 12: Performance gains from an open source activation (OSS) platform
  • Figure 13: Intel Hardware Performance, 2010-13
  • Figure 14: Open source is more likely to be found today in areas which are…
  • Figure 15: Framework mapping current telco uptake of open source software
  • Figure 16: Five key barriers to telco adoption of open source software
  • Figure 17: % of employees with ‘software’ in their LinkedIn job title, Oct. 2015
  • Figure 18: ‘Waterfall’ and ‘Agile’ Software Development Methodologies Compared
  • Figure 19: Four key cultural attributes for successful telco transformation

Strategic Overview: Time for a New Telco 2.0 Vision

Introduction

Telecoms operators worldwide are pursuing strategies to achieve four general goals:

  • Core Competitiveness – to enhance and grow their success in established telecoms markets
  • Achieving Transformation – to lower costs and enable greater agility in their core business
  • Implementing Innovation – to employ key innovations in the core business and grow new types of revenues
  • Disruption – addressing disruptive threats and opportunities arising from and in adjacent markets and industries

The following is a summary of highlights of our recent analysis and an outline of further research planned against each of these themes. It is intended to provide readers with a summary, starting point and guide to our research as they address the themes, and includes a preamble for our latest vision of ‘Telco 2.0’ – the shape of future telcos.

Theme #1: Core Competitiveness – Telecoms Markets and Competitive Strategies

Background

STL Partners has covered the changing context of global telecoms markets for the last nine years. The broad story is that voice and messaging revenues are in decline, and that while data revenues are generally growing, they aren’t growing fast enough to replace the lost revenues.

Figure 1 – The pressure to defend existing telecoms revenues and build new ones

Source: STL Partners

Core Competitiveness: Research Highlights

In addition to slowing the decline in voice and messaging, operators need the best strategies to grow data, as well as new approaches to manage costs and deliver new value (covered in the subsequent sections of this paper). On this front:

Next Steps on Core Competitiveness

STL Partners is planning analysis including:

  • The impact of digital customer experience on customer behaviours and value creation
  • What strategies have demonstrably added value to telecoms operators?

Theme #2: Achieving Transformation – Re-organising the Core and Building Innovative Businesses

Background

Following on from our work on the Telco 2.0 Transformation Index, benchmarking the strategies of five major operators, in 2015 STL Partners has researched ‘Agility’, a key objective of change in the core business, and how to build innovative new businesses.

Figure 2 – The Telco 2.0 Agility Framework

Source: STL Partners, Agility Report

Transformation: Research Highlights

Next Steps on Telco 2.0 Transformation

STL Partners is planning analysis including:

  • What does ‘Telco 2.0’ mean today – what should a future telco look like?
  • How do recent developments in the application of new business models, technology, and organisational change unlock faster transition to new Telco 2.0 businesses?

Theme #3: Implementing Innovation in the Core – IoT, 5G and the Cloud, NFV and Future Networks

Background

IoT (the Internet of Things), 5G, and NFV (Network Functions Virtualisation) are three acronyms that at first glance seem unrelated. Yet underlying all three is that the boundaries between IT and network technologies in telecoms are starting to blur at an increasing rate. This is a highly significant trend in the industry.

Figure 3 – Improvements in the performance of generic hardware and software are starting to blur the IT/Network boundary

Source: Intel, STL Partners NFV Report

Core Innovation: Research Highlights

All in all, we see this underlying change as highly significant in terms of the structure and strategy of the telecoms industry. It will both more effectively enable new business models for telcos, enable new competition for them, and disrupt existing industry structures among telcos. It will also disrupt technology and software players partnering with telcos. It is therefore a critical strategic need to understand how this is likely to play out, and the strategies most likely to lead to success in this new world.

Next Steps on IoT, Cloud and the Future of the Network

STL Partners is planning analysis including:

  • The role of Cellular networks in the IoT
  • How the network revolution will unlock business model change
  • The impact of new software-based approaches on future of telecoms 

Theme #4: Disruption – Addressing Adjacent Threats and Opportunities

Background

Regular readers of our research are likely to be familiar with our original and market leading analysis of the internet players and major disruptors of the telecoms market, such as Dealing with the Disruptors: Google, Apple, Facebook, Amazon and Microsoft (2011) and our ongoing Dealing With Disruption in-depth research stream.

Research Highlights: Disruption

Although our article on the implications of Google’s MVNO attracted significant interest among our readers, disruption is no longer perceived as solely a threat to telcos, as evidenced by interest in analysis on:

Next Steps on Disruption

STL Partners is planning analysis including:

  • Further detailed case studies on leading telcos acting as disruptors, including new success stories in advertising and location services
  • China’s other disruptors (e.g.s Baidu, Xiaomi) and rising stars
  • Ongoing analysis of the strategies of Microsoft, Google, Apple, Amazon and Facebook

Conclusion: time for a new ‘Telco 2.0’ vision

STL Partners believes that three major practical outcomes resulting from progress across these themes are now combining to create a unique opportunity for telcos to evolve and take advantage of new markets.

New business models are starting to deliver

It is increasingly clear which new business models can be successful for telcos, and the pressure on the existing business model is no longer theoretical, it is a matter of substantial reality for most if not all telcos. The most advanced telcos have been trying out new models and some winning examples are emerging in the areas of content, enterprise ICT and B2B2C enablers.

A new virtualised technological platform will enable new ways of working

The emergence of SDN and NFV is creating a technological platform that is much more capable of delivering and supporting the agility required to deliver and sustain new businesses and new network propositions at speed than the traditional network/IT split. This will radically change both the operator and vendor industry landscape over the next few years.

In addition, and combined with the likely shape of 5G as a technology to further reduce mobile network latency, the future technological ‘shape’ of telcos looks like a highly distributed ICT infrastructure placing huge and computing resources very close to most customers. This will create many different business opportunities for telcos and not least in the delivery of content, enterprise ICT, and digital commerce.

It is becoming clearer how to organise and manage the change

The management and organisational techniques to create and sustain digital businesses are no longer a complete mystery, even though they are still evolving. And there is an increasing body, if not yet a ‘critical mass’, of people in the telecoms industry willing and able to embrace these approaches.

Time for a new ‘Telco 2.0’ vision

We believe that telcos (and their partners) that harness these insights will be best placed to maximise value creation in the future, and our research and consulting services are designed to help telecoms industry clients achieve success faster and more effectively in this future. To this end, we will shortly be setting out a new vision for ‘Telco 2.0’ – what a telecoms operator should be to create maximum value in the future, and how to get there.

Digital Services: What is Your Digital Business Worth?

Introduction

When Hewlett Packard’s then-CEO (Carly Fiorina) defended HP’s infamous acquisition of Compaq in 2002, she offered a number of arguments as to why the deal made sense. Firstly, the combined entity would now be able to meet the demands of customers for “solutions on a truly global basis.” Secondly, she claimed that the firm would be able to offer products “from top to bottom, from low-end to high-end.” Lastly, but perhaps most importantly, the merger would generate “synergies that are compelling.”

‘Synergy’ is a straightforward concept: the interaction of two or more entities to produce a combined effect greater than the sum of their parts. Synergistic phenomena are ubiquitous in the natural world, ranging from physics (e.g. the building blocks of atoms), to genetics (e.g. the cooperative interactions among genes in genomes) and the synergies produced by socially-organised groups (e.g. the division of labour).

In the business world, ‘synergy’ refers to the value that is generated by combining two organisations to create a new, more valuable entity. Synergies here can be ‘operational’, such as the combination of functional strengths, or ‘financial’, such as tax benefits or diversification. Traditionally, however, investors have been deeply sceptical of synergies, in terms of both their existence and the ability of M&A activity to deliver them. This was the case with the HP-Compaq merger: the day the merger was announced HP’s stock closed at $18.87, down sharply from $23.21 the previous day.

Recently, ‘synergy’ has also become an increasingly familiar term within the telecommunications industry, owing to activities in two distinct areas. These are now discussed in turn.

Fixed-Mobile Convergence: How tangible are the synergies?

Fixed-mobile convergence (FMC) is a hot topic, and numerous substantial M&A transactions have occurred in this space in recent years (especially in Europe). Figure 1 charts some of these transactions, including publicly available synergy estimates (reflecting cost savings, revenue benefits, or both), below:

Figure 1: Fixed-mobile convergence driven by synergy value


Source: Vodafone, Analysys Mason, STL Partners
* Synergy run-rate by 2016; ** Revenue synergies only

With synergies estimated to account for over 10% of each of these transactions’ valuations, and in the case of Vodafone/KDG nearly 30%, they are clearly perceived as an important driver of value. However, there are two key qualifications to be made here:

  1. Discounted Cash Flow, or ‘DCF’, is theoretically sound but less credible in practice: Each of the estimates of ‘synergy value’ in Figure 1 were constructed using DCF techniques, which attempt to forecast future cash flows and ‘discount’ these to their overall value today (e.g. because one can save cash and earn interest) . Although theoretically sound, there are several problems with DCF in practice.
  2. Certain FMC synergies are more tangible than others: Whilst cost-centric synergies, such as economies of scale (e.g. combined call centres) and access to mobile backhaul, are tangible and easier to quantify, revenue-centric synergies (e.g. quad-play and upselling) are less tangible and more challenging to quantify

These qualifications mirror those raised in the ‘Valuing Digital: A Contentious Yet Vital Business’ Executive Briefing, which discusses the challenges telecoms operators are facing when seeking to generate formal valuations of their digital businesses.

Recap: Digital businesses are especially challenging to value

As telecoms operators’ ambitions in digital services continue to grow, they are increasingly asking what the value of their specific digital initiatives are. Without understanding the value of their digital businesses, telcos cannot effectively govern their individual digital activities: prioritisation, budget allocation and knowing when to close initiatives (‘fast failure’) within digital is challenging without a clear idea of the return on investment different verticals and initiatives are generating. However, telcos face significant challenges across three areas when attempting to value their businesses:

  1. There are challenges in valuing any business (analogue or digital): Although DCF has its drawbacks (see above), any quantitative ‘model’ is necessarily a simplification of reality
  2. Traditional approaches to valuation (e.g. DCF) are inadequate for digital businesses: DCF is especially inappropriate when valuing early-stage digital businesses due to their unique characteristics
  3. The potential for digital services to generate ‘synergy value’ presents further challenges for valuation: Synergy value presents additional conceptual and practical challenges when digital businesses are held within telecoms operators. Figure 2 outlines these below:

Figure 2: Conceptual and practical challenges caused by synergy value


Source: STL Partners

Therefore, telcos (but also the broader technology ecosystem in general) need a new set of tools to answer questions in two key areas. For example:

  1. How should telcos model the market value of their digital businesses?
    • Introducing ‘proxy models’
    • What are the advantages and disadvantages of proxy models?
    • How can a proxy be built to account for issues around limited data availability?
    • Case studies: example valuations of high-profile but privately-held initiatives
  2. How should telcos think about the ‘synergy value’ generated by their digital businesses?
    • What is a useful framework for thinking about synergy value?
    • How are some telcos using clinical trials to assist in the ‘measurement’ of synergies?


  • Executive Summary
  • Introduction
  • Fixed-Mobile Convergence: How tangible are the synergies?
  • Recap: Digital businesses are especially challenging to value
  • A Digital Valuation Framework
  • ‘Net synergy’ has four components: benefits and costs, to and from the core
  • Benchmark data theoretically leads to conservative valuations
  • How to Build a Proxy Model
  • What is a ‘Proxy Model’?
  • Proxy models have several advantages over DCF, but they also have data availability challenges
  • Case Study: SK Telecom’s MelOn could be worth $1bn+
  • How to Measure Synergies
  • The Theory: Clinical trials reduce the synergy problem
  • Case Study: A leading European MNO works with its OpCos to run clinical trials
  • Conclusions and Next Steps
  • STL Partners and Telco 2.0: Change the Game


  • Figure 1: Fixed-mobile convergence driven by synergy value
  • Figure 2: Conceptual and practical challenges caused by synergy value
  • Figure 3: MTN Mobile Money Uganda, Gross Profit Contribution, 2009-12
  • Figure 4: ‘Net synergy’ across four categories
  • Figure 5: ‘Net synergy’ as a component of digital business value
  • Figure 6: Facebook monthly active users vs. valuation, Q1 2010-Present
  • Figure 7: Proxy model output – SME SaaS providers (financial driver)
  • Figure 8: Total VC Investment by Geography, 2010-13
  • Figure 9: Example operational and financial ‘Emerging Market Discounts’
  • Figure 10: Proxy model output – Digital Music (operational driver; South Korea)
  • Figure 11: Correlation vs. Causation


The Digital Dashboard: How new metrics drive success in telco digital initiatives

Introduction

As core services revenues, margins and cash generation decline quickly, Communications Service Providers (CSPs) are seeking to invest in and grow new (digital) services. STL Partners estimates that digital business should represent 25+% of Telco revenue by 2020 to avoid long-term industry decline. The move to digital is challenging for CSPs.  It will require large established organisations to define and implement new sustainable business models with new services delivered to existing and new customers via new channels and partners underpinned by new technology and supported by new operating, revenue and cost models. This requires a fundamental shift from a traditional infrastructure-based business to a complex amalgam of infrastructure, platform and product innovation businesses:

  • Historically, the telecoms industry has been an infrastructure business. It has invested large amounts of capital on things such as spectrum purchases, fibre and tower deployments. The result has been three largely undifferentiated services and revenue streams that have been ‘bundled in’ with the networks – voice, messaging and data. In the past, being a good communications service provider involved:
    • Making effective capital investment decisions, and then
    • Operating the network efficiently and affectively.
  • The Internet has changed everything by fracturing the integration between the network and services so that voice and messaging are no longer the sole domain of CSPs. CSPs now need to continue to hone their infrastructure business skills (in a world where every dollar of revenue is competed for hard by other operators and by ‘OTT’ players), and must also develop a range of new skills, assets, partnerships, customer relationships and operating and financial models if they are to compete in the new digital service areas.

In our recent survey (see Reality Check: Are operators’ lofty digital ambitions unrealistic given slow progress to date?), Telco practitioners were asked to comment on the importance of nine things that needed to be addressed to complete their digital business model transformation and the progress made to tackle them (see Figure 1).

Figure 1: Digital metrics should be driving change at CSPs but are themselves proving difficult to implement


Source: STL Partners/Telco 2.0 Operator Survey, November 2014

Measurement using new digital operational/financial metrics was highlighted in the global survey as one of the ‘big 6’ challenges that need to be addressed for CSPs to be successful in future. However, to date, it has often been neglected by CSPs (metrics are often an after-thought and not an integral part of the digital transformation process).

In this report, we argue that the reverse is true: effective metrics lie at the heart of change. Without measurement, it is impossible to make decisions and engender change: an organisation continues on its existing path even if that ultimately leads to decline. We will:

  1. Look at why it is important to capture, synthesise and act upon appropriate metrics.
  2. Examine traditional and new approaches to the use of performance metrics and identify the factors that contribute to success and failure.
  3. Highlight ‘telco best-practice’ via a case-study from a leading Asian CSP, Telkom Indonesia.

Why metrics matter

There is a common misconception that start-ups and digital companies do not – and do not need to – measure and report the performance of their businesses and initiatives. Digital start-ups are often portrayed as small creative teams working on ‘exciting stuff’ with no sense of business rigour or control. This could not be further from the truth. Most start-ups follow a LEAN & agile approach to product ideation and development are steered by one motto… “What you cannot measure, you cannot manage”.  This is even more true if they are VC-backed and therefore reliant on hitting specific targets to receive their next round of funding.

Start-ups rely on operational and actionable metrics to measure progress, identify when to pivot as an organisation and translate strategic objectives into daily activities. By applying the “Build – Measure – Learn” concept (see Figure 2), innovators create something (Build), evaluate how well it is received (Measure), and adjust it in response to the feedback they receive (Learn).

Figure 2: “Build – Measure – Learn” concept

Source: LEAN Analytics – Use Data to Build a Better Startup Faster

Metrics evolve over time. Start-ups are continuously searching for the ‘right’ metrics at any given stage of their development because their businesses are constantly evolving – either because they have just started on their journey or because they may have recently changed direction (or ‘pivoted’ from their original value proposition). Metrics are perceived as an operational toolset to quickly iterate to the right product and market before the money runs out. This ‘sword of Damocles’ hanging over entrepreneurs’ heads is a world away from the world inhabited by telcos’ employees.

Indeed, CSPs’ current approach to business targets & funding allocation is unlikely to create a sense of urgency that will drive and stimulate the success of digital initiatives. Based on extensive interviews with CSPs, digital start-ups and VCs, STL Partners concludes that CSPs should focus on:

  • Removing the Telco ‘safety net’. To succeed in creating truly compelling customer experiences CSPs need to mimic a VC-like environment and create a culture of higher-reward in return for higher risk by targeting employees more tightly on their digital initiative’s performance:

    • Reward success more heavily: this could be ‘shadow’ share options in the venture which yield value in the form of shares or cash bonus for hitting targets which would takes an employee’s overall package way beyond what could be earned in the core business.

    • Create risk for individuals: the quid pro quo of a big upside could be a reduced salary to, say, 60% of normal Telco pay (i.e. similar to what might be earned in a typical start-up) or offer contracts that only renew if an initiative hits its targets – if you fall short, you leave the business and are not simply moved elsewhere in the organisation.

  • Adopting ‘start-up culture’ and ways of thinking. For example, when negotiating for funds, employees should be negotiating for their survival, not for a budget or a budget increase. Also, Telcos should start using the vocabulary / parlance commonly used in the digital space as such burn rate, time before cash runs out, cash break-even date, etc.

  • Establishing new processes to manage KPIs and performance metrics. In the fast-paced digital environment, it usually does not make sense to use 18-24 month targets derived from a detailed business case backed by financial metrics (such as revenue, EBITDA, etc.) – particularly for early-stage start-ups.  Google actually identified a move away from this approach to one focused on a stable strategic foundation (make sure the initial proposition is viable by defining a clear problem we are trying to solve and how the solution will differentiate from alternative solutions) + fluid plans as one of the pillars of its success (see Figure 3
    08D0C9EA79F9BACE118C8200AA004BA90B02000000080000000E0000005F005200650066003400310032003500330036003000380034000000

    08D0C9EA79F9BACE118C8200AA004BA90B02000000080000000E0000005F005200650066003400300039003500320034003300340038000000
    )

Figure 3: Business plan and financial metrics are out-of-date in a digital world

Source: How Google works, Eric Schmidt, Jonathan Rosenberg and Alan Eagle

Metrics are a powerful tool that CSPs should use to foster sustainable commercial growth through validated learning. Unfortunately, metrics are often an “after-thought” and very few CSPs have implemented a consistent approach to metrics.  From a series of interviews, undertaken by STL for this research, it became apparent that most initiatives failed to develop regular reporting that engages (or is even understood by) other stakeholders. At best, operators are inconsistent in tracking digital innovation, at worst, negligent.


  • Executive Summary
  • Introduction
  • Why metrics matter
  • Metrics make a difference: 3 case studies from telecoms operators
  • 3 additional reasons why Telcos need digital metrics
  • Alternative approaches to digital metrics for telecoms operators
  • Introduction
  • The corporate approach – the Balanced Scorecard
  • The start-up approach – LEAN & AARRR methodology
  • Telkom Indonesia’s approach to digital metrics
  • Background
  • Telkom’s current digital strengths
  • Telkom Indonesia’s digital metrics system
  • Benefits of the digital metrics system to Telkom Indonesia
  • Conclusions
  • STL Partners and Telco 2.0: Change the Game


  • Figure 1: Digital metrics should be driving change at CSPs but are themselves proving difficult to implement

  • Figure 2: “Build – Measure – Learn” concept

  • Figure 3: Business plan and financial metrics are out-of-date in a digital world

  • Figure 4: Near perfect correlation between number of agents and number of M-Pesa subscribers, R2 = 0.96

  • Figure 5: Metrics reporting by M-Pesa, December 2012

  • Figure 6: Turkcell’s Mobile Marketing Platform Overview

  • Figure 7: Turkcell’s continuous development of it Mobile Marketing portfolio

  • Figure 8: Libon single roadmap enables rapid evolution and rich features

  • Figure 9: Libon – Cost per Monthly Active Users (M)

  • Figure 10: Illustrative Net Synergy Make up (Hypothetical case)

  • Figure 11: Facebook vs. Yield Businesses: Revenue and Enterprise Value (EV)

  • Figure 12: Facebook: Monthly Active Users vs. Valuation

  • Figure 13: Different players’ metrics requirements

  • Figure 14: Balance Scorecard concept

  • Figure 15: AARRR model

  • Figure 16: Pros & Cons – Summary table

  • Figure 17: Telkom Indonesia’s Metrics Approach – Characteristics

  • Figure 18: Telkom Indonesia’s digital strengths

  • Figure 19: Telcos – slow by design?

  • Figure 20: Telkom Indonesia’s TIMES service portfolio

  • Figure 21: LEAN start-up approach

  • Figure 22: Delivering Innovation – Telkom’s internal organisation

  • Figure 23: Telco 2.0 Domain Framework

  • Figure 24: Metrics Prioritisation & Outcomes Example

  • Figure 25: Governance process – Phase 1 & 2

  • Figure 26: Innovation Governance – Case studies examples

Reality Check: Are operators’ lofty digital ambitions unrealistic given slow progress to date?

Growing telco ambitions in new (digital) business models

Telco execs are bullish about long-term prospects for new digital business models

Respondents believe new business model revenues should reach nearly 25% of total telecom revenue by 2020

Despite recent evidence in Europe of material revenue decline from telecoms operators, the executives that STL Partners canvassed in its recent global survey  were relatively optimistic about the opportunities for revenue growth from new business models.  On average, executives felt that revenue from new digital business models  should reach 9% of total revenue in 2015 and this should rise to 24% by 2020 (see Figure 1).

In the case of 2015, 9% is way beyond what will be achieved by most players and probably represents respondents’ theoretical target that their organisation should have achieved by the end of this year if management had invested more effort in building new revenue sources earlier: it is where their organisation should be in an ideal world.   One of the few operators in the world that is at this level of digital revenues is NTT DoCoMo.  We explore its digital activities later in this report.

24% of telecoms revenue coming from new business models in 2020 is also ambitious but STL Partners considers this a realistic target and one which would probably result in the overall telecoms market being no bigger than it was in 2013 – see the forecast on page 15.

Two drivers of digital business model importance to operators: digital revenue growth and core business revenue decline

A key question for the industry is whether the 2020 target can be achieved by growing material new business model revenues in tandem with limited voice, messaging and connectivity decline or whether it could result from an implosion of these Telco 1.0 revenues.  In other words, modest new business model revenue could be 24% of a very much smaller overall telecoms market if voice, messaging and connectivity revenues suffer a precipitous decline.

Figure 2 charts the quarterly revenue for six European markets and illustrates a range of trajectories for telecoms revenues.  At one extreme is Denmark where telecoms revenue in Q3 2014 was nearly 40% lower than Q1 2008.  At the other extreme are the UK and French markets where the figure is 3% and 7% lower respectively.  Clearly, if most telecoms markets follow the Danish route then the opportunity for modest digital revenues to become important to operators grows substantially.  Interestingly, in most of the six markets, 2013 and 2014 has seen revenues stabilising (at least among operators that publish accounts which split out those markets over the time period) and in some cases, such as the UK and Netherlands, growth has been achieved from the lows of 2012.

STL Partners’ global forecast lies somewhere between the two extremes outlined in Figure 2: we believe that core telecoms revenues will decline by around 25% between 2013 and 2020.  If this is indeed the case then for digital revenues to represent 24% of telecoms revenue, they will need to be very material – around $250 billion for mobile telecoms alone!

Figure 1: Digital business model revenue ambition, 2015 and 2020

Source: STL Partners/Telco 2.0 Operator Survey, November 2014, n=55

Figure 2: Telecoms quarterly revenue in 6 European markets

Source: Telecoms company accounts, STL Partners analysis
Note: Revenue is for operators reporting quarterly figures for each market. As a result, not all market revenue is captured.

Belief in the importance of future telecoms business models varies greatly by business function and by geography

Respondents from Network functions were most bullish; IT respondents most pessimistic

Where there were 10 or more respondents in a functional or geographic group, we examined the responses for that group.  As Figure 3 shows, there were wide differences in ambition for digital services by functional area with respondents from Network being far more bullish than those in IT:  the former suggesting 30% of 2020 revenue should come from digital services compared with only 14% from IT.

North American respondents seem to anticipate unrealistic digital business growth

There was a consistency among functional groups in their ambitions for digital services: those that were more bullish for 2015 remained more so for 2020.  This contrasted with the regional split in which North American respondents believed the ‘correct’ proportion of revenue from digital services in 2015 is 7% (compared with 10% for Europe and Asia) rising to a formidable 26% in 2020.  This suggests that North American executives remain confident that their organisations can compete effectively in consumer and enterprise digital markets despite the US, in particular, being the home market of many formidable digital players: Google, Facebook, Amazon, Microsoft, Salesforce, Twitter, and so forth.

To put the North American perspective in perspective: if STL Partners’ global forecast for core telecoms services holds true in the US then a $120bn revenue telecoms company, such as Verizon, will lose around $30 billion in core service revenues by 2020.  In this scenario, for Verizon to end up the same size as it is now in 2020, it will have to replace this $30 billion with new digital business revenues (which would equate roughly to the 26% proposed by North American respondents).  In our deep-dive analysis of Verizon for the Telco 2.0 Transformation Index, STL Partners estimated that Verizon generated around $2.9 billion in Telco 2.0 digital business model revenues (around 2.4% of total revenue) in 2013.  For that $2.9 billion to grow to $30 billion by 2020 requires compound annual growth of a whopping 40% per year: a tall order indeed and one that is almost certainly unrealistic.

Middle Eastern respondents least ambitious: signs of complacency?

Unsurprisingly, the Middle Eastern respondents whose companies are enjoying continued growth in core telecoms services and, in many countries advantageous regulatory environments, were least bullish about digital services in the near and longer term.  The danger for this region is complacency: operators are in a similar position to those in Europe in 2007.  European operators failed to prepare early enough for core service decline – most digital activities were not kicked off until 2012 by which time aggregate revenue from voice, messaging and connectivity was either flat or in decline in most markets.

Figure 3: Average digital business model revenue ambition, 2015 and 2020 by function and geography

Source: STL Partners/Telco 2.0 Operator Survey, November 2014, n=55


  • Executive Summary
  • Growing telco ambitions in new (digital) business models
  • Telco execs are bullish about long-term prospects for new digital business models
  • Belief in the importance of future telecoms business models varies greatly by business function and by geography
  • Telco execs’ views on digital business Opex and Capex investment are closely correlated with their views on revenue growth
  • Calculating a telecoms digital business P&L:  Moving from investment in 2015 to (unrealistically?) strong returns in 2020
  • STL Partners’ forecast suggests that new digital business should be 25+% of revenue by 2020 to avoid long-term industry decline
  • The outlook for Telco 1.0 business models is not positive and Telco 2.0 business models are required to fill the gap
  • Investment in new business models is increasing but results from the Telco 2.0 Transformation Index suggest it is still inadequate to engender success
  • Scale of NTT DoCoMo’s ‘new digital business’ suggests bold vision is realistic for some players
  • Long-term downward trend in Telco 1.0 core services in Japan with digital services a ‘gap-filler’
  • Smart Life: A cloud-based (OTT) consumer-centric approach to digital services
  • A digital business has fundamentally different characteristics to a telecoms business
  • 9 challenges to overcome and all are important
  • Overall, operator progress on all 9 challenges remains slow
  • Too little progress on core challenges from most operators
  • What next?  Forthcoming STL Partners’ Telco 2.0 research supporting telecoms transformation
  • Appendix 1: Survey details
  • Appendix 2: Telco 2.0 Transformation Index overview


  • Figure 1: Digital business model revenue ambition, 2015 and 2020
  • Figure 2: Telecoms quarterly revenue in 6 European markets
  • Figure 3: Average digital business model revenue ambition, 2015 and 2020 by function and geography
  • Figure 4: Average required Digital Business Opex and Capex, 2015 & 2020
  • Figure 5: Digital Business P&L for a $100 billion revenue telecoms operator, 2015 vs 2020, $ Billions
  • Figure 6: STL Partners’ global mobile telecoms forecast by opportunity area
  • Figure 7: STL Partners Telco 2.0 Transformation Index summary results, December 2014
  • Figure 8: NTT DoCoMo quarterly voice, data and ‘other’ revenue, Mar 2007-Sep 2014
  • Figure 9: Smart Life – NTT DoCoMo’s customer-centric approach to transformation
  • Figure 10: Different companies…different business models – the change that telecoms operators are trying to make
  • Figure 11: 9 challenges scored by ‘importance for operator digital transformation and future success’
  • Figure 12: The degree to which operators have addressed the 9 challenges
  • Figure 13: Strategists are much more bullish than other functions about their organisation’s transformation progress
  • Figure 14: Lots to change…and its taking too long
  • Figure 15: Operators appear to be at very different stages of resolving the ‘Big 6’ challenges
  • Figure 16: Defining Digital Services


Winning Strategies: Differentiated Mobile Data Services

Introduction

Verizon’s performance in the US

Our work on the US cellular market – for example, in the Disruptive Strategy: “Uncarrier” T-Mobile vs VZW, AT&T, and Free.fr  and Free-T-Mobile: Disruptive Revolution or a Bridge Too Far?  Executive Briefings – has identified that US carrier strategies are diverging. The signature of a price-disruption event we identified with regard to France was that industry-wide ARPU was falling, subscriber growth was unexpectedly strong (amounting to a substantial increase in penetration), and there was a shakeout of minor operators and MVNOs.

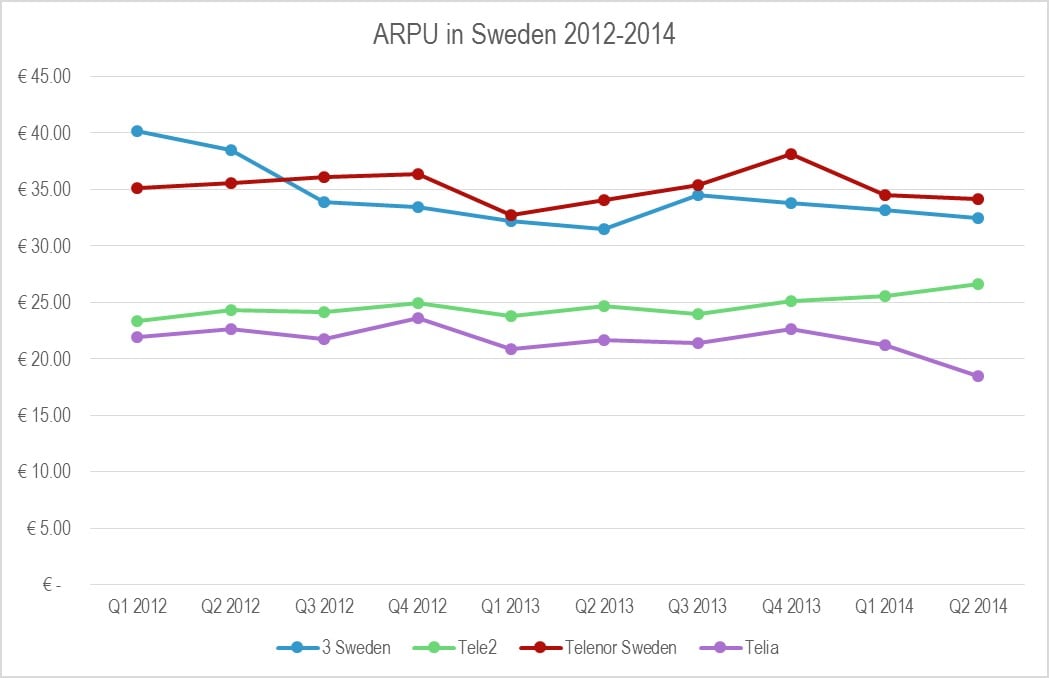
Although there are strong signs of a price war – for example, falling ARPU industry-wide, resumed subscriber growth, minor operators exiting, and subscriber-acquisition initiatives such as those at T-Mobile USA, worth as much as $400-600 in handset subsidy and service credit – it seems that Verizon Wireless is succeeding while staying out of the mire, while T-Mobile, Sprint, and minor operators are plunged into it, and AT&T may be going that way too. Figure 1 shows monthly ARPU, converted to Euros for comparison purposes.

Figure 1: Strategic divergence in the US

Figure 1 Strategic Divergence in the US
Source: STL Partners, themobileworld.com

We can also look at this in terms of subscribers and in terms of profitability, bringing in the cost side. The following chart, Figure 2, plots margins against subscriber growth, with the bubbles set proportional to ARPU. The base year 2011 is set to 100 and the axes are set to the average values. We’ve named the four quadrants that result appropriately.

Figure 2: Four carriers, four fates

Figure 2 Four carriers four fate
Source: STL Partners

Clearly, you’d want to be in the top-right, top-performer quadrant, showing subscriber growth and growing profitability. Ideally, you’d also want to be growing ARPU. Verizon Wireless is achieving all three, moving steadily north-west and climbing the ARPU curve.

At the same time, AT&T is gradually being drawn into the price war, getting closer to the lower-right “volume first” quadrant. Deep within that one, we find T-Mobile, which slid from a defensive crouch in the upper-left into the hopeless lower-left zone and then escaped via its price-slashing strategy. (Note that the last lot of T-Mobile USA results were artificially improved by a one-off spectrum swap.) And Sprint is thrashing around, losing profitability and going nowhere fast.

The usual description for VZW’s success is “network differentiation”. They’re just better than the rest, and as a result they’re reaping the benefits. (ABI, for example, reckons that they’re the world’s second most profitable operator on a per-subscriber basis  and the world’s most profitable in absolute terms.) We can restate this in economic terms, saying that they are the most efficient producer of mobile service capacity. This productive capacity can be used either to cut prices and gain share, or to increase quality (for example, data rates, geographic coverage, and voice mean-opinion score) at higher prices. This leads us to an important conclusion: network differentiation is primarily a cost concept, not a price concept.

If there are technical or operational choices that make network differentiation possible, they can be deployed anywhere. It’s also possible, though, that VZW is benefiting from structural factors, perhaps its ex-incumbent status, or its strong position in the market for backbone and backhaul fibre, or perhaps just its scale (although in that case, why is AT&T doing so much worse?). And another possibility often mooted is that the US is somehow a better kind of mobile market. Less competitive (although this doesn’t necessarily show up in metrics like the Herfindahl index of concentration), supposedly less regulated, and undoubtedly more profitable, it’s often held up by European operators as an example. Give us the terms, they argue, and we will catch up to the US in LTE deployment.

As a result, it is often argued in lobbying circles that European markets are “too competitive” or in need of “market repair”, and therefore, the argument runs, the regulator ought to turn a blind eye to more consolidation or at least accept a hollowing out of national operating companies. More formally, the prices (i.e. ARPUs) prevailing do not provide a sufficient margin over operators’ fixed costs to fund discretionary investment. If this was true, we would expect to find little scope for successful differentiation in Europe.

Further, if the “incumbent advantage” story was true of VZW over and above the strategic moves that it has made, we might expect to find that ex-incumbent, converged operators were pulling into the lead across Europe, benefiting from their wealth of access and backhaul assets. In this note, we will try to test these statements, and then assess what the answer might be.

How do European Operators compare?

We selected a clutch of European mobile operators and applied the same screen to identify what might be happening. In doing so we chose to review the UK, German, French, Swedish, and Italian markets jointly with the US, in an effort to avoid a purely European crisis-driven comparison.

Figure 3: Applying the screen to European carriers

Figure 3 Applying the screen to European carriers

Source: STL Partners

Our first observation is that the difference between European and American carriers has been more about subscriber growth than about profitability. The axes are set to the same values as in Figure 2, and the data points are concentrated to their left (showing less subscriber growth in Europe) not below them (less profitability growth).

Our second observation is that yes, there certainly are operators who are delivering differentiated performance in the EU. But they’re not the ones you might expect. Although the big converged incumbents, like T-Mobile Germany, have strong margins, they’re not increasing them and on the whole their performance is average only. Nor is scale a panacea, which brings us to our next observation.

Our third observation is that something is visible at this level that isn’t in the US: major opcos that are shrinking. Vodafone, not a company that is short of scale, gets no fewer than three of its OpCos into the lower-left quadrant. We might say that Vodafone Italy was bound to suffer in the context of the Italian macro-economy, as was TIM, but Vodafone UK is in there, and Vodafone Germany is moving steadily further left and down.

And our fourth observation is the opposite, significant growth. Hutchison OpCo 3UK shows strong performance growth, despite being a fourth operator with no fixed assets and starting with LTE after first-mover EE. Their sibling 3 Sweden is also doing well, while even 3 Italy was climbing up until the last quarter and it remains a valid price warrior. They are joined in the power quadrant with VZW by Telenor’s Swedish OpCo, Telia Mobile, and O2 UK (in the last two cases, only marginally). EE, for its part, has only marginally gained subscribers, but it has strongly increased its margins, and it may yet make it.

But if you want really dramatic success, or if you doubt that Hutchison could do it, what about Free? The answer is that they’re literally off the chart. In Figure 4, we add Free Mobile, but we can only plot the first few quarters. (Interestingly, since then, Free seems to be targeting a mobile EBITDA margin of exactly 9%.)

The distinction here is between the pure-play, T-Mobile-like price warriors in the lower right quadrant, who are sacrificing profitability for growth, and the group we’ve identified, who are improving their margins even as they gain subscribers. This is the signature of significant operational improvement, an operator that can move traffic more efficiently than its competitors. Because the data traffic keeps coming, ever growing at the typical 40% annual clip, it is necessary for any operator to keep improving in order to survive. Therefore, the pace of improvement marks operational excellence, not just improvement.

Figure 4: Free Mobile, a disruptive force that’s literally off the charts

Figure 4 Free Mobile a disruptive force thats literally off the charts

Source: STL Partners

We can also look at this at the level of the major multinational groups. Again, Free’s very success presents a problem to clarity in this analysis – even as part of a virtual group of independents, the ‘Indies’ in Figure 5, it’s difficult to visualise. T-Mobile USA’s savage price cutting, though, gets averaged out and the inclusion of EE boosts the result for Orange and DTAG. It also becomes apparent that the “market repair” story has a problem in that there isn’t a major group committed to hard discounting. But Hutchison, Telenor, and Free’s excellence, and Vodafone’s pain, stand out.

Figure 5: The differences are if anything more pronounced within Europe at the level of the major multinationals

Figure 5 The differences are if anything more pronounced within Europe at the level of the major multinationals

Source: STL Partners

In the rest of this report we analyse why and how these operators (3UK, Telenor Sweden and Free Mobile) are managing to achieve such differentiated performance, identify the common themes in their strategic approaches and the lessons from comparison to their peers, and the important wider consequences for the market.


  • Executive Summary
  • Introduction
  • Applying the Screen to European Mobile
  • Case study 1: Vodafone vs. 3UK
  • 3UK has substantially more spectrum per subscriber than Vodafone
  • 3UK has much more fibre-optic backhaul than Vodafone
  • How 3UK prices its service
  • Case study 2: Sweden – Telenor and its competitors
  • The network sharing issue
  • Telenor Sweden: heavy on the 1800MHz
  • Telenor Sweden was an early adopter of Gigabit Ethernet backhaul
  • How Telenor prices its service
  • Case study 3: Free Mobile
  • Free: a narrow sliver of spectrum, or is it?
  • Free Mobile: backhaul excellence through extreme fixed-mobile integration
  • Free: the ultimate in simple pricing
  • Discussion
  • IP networking metrics: not yet predictive of operator performance
  • Network sharing does not obviate differentiation
  • What is Vodafone’s strategy for fibre in the backhaul?
  • Conclusions


  • Figure 1: Strategic divergence in the US
  • Figure 2: Four carriers, four fates
  • Figure 3: Applying the screen to European carriers
  • Figure 4: Free Mobile, a disruptive force that’s literally off the charts
  • Figure 5: The differences are if anything more pronounced within Europe at the level of the major multinationals
  • Figure 6: Although Vodafone UK and O2 UK share a physical network, O2 is heading for VZW-like territory while VF UK is going nowhere fast
  • Figure 7: Strategic divergence in the UK
  • Figure 8: 3UK, also something of an ARPU star
  • Figure 9: 3UK is very different from Hutchison in Italy or even Sweden
  • Figure 10: 3UK has more spectrum on a per-subscriber basis than Vodafone
  • Figure 11: Vodafone’s backhaul upgrades are essentially microwave; 3UK’s are fibre
  • Figure 12: 3 Europe is more than coping with surging data traffic
  • Figure 13: 3UK service pricing
  • Figure 14: The Swedish market shows a clear winner…
  • Figure 15: Telenor.se is leading on all measures
  • Figure 16: How Swedish network sharing works
  • Figure 17: Network sharing does not equal identical performance in the UK
  • Figure 18: Although extensive network sharing complicates the picture, Telenor Sweden has a strong position, especially in the key 1800MHz band
  • Figure 19: If the customers want more data, why not sell them more data?
  • Figure 20: Free Mobile, network differentiator?
  • Figure 21: Free Mobile, the price leader as always
  • Figure 22: Free Mobile succeeds with remarkably little spectrum, until you look at the allocations that are actually relevant to its network
  • Figure 23: Free’s fixed-line network plans
  • Figure 24: Free leverages its FTTH for outstanding backhaul density
  • Figure 25: Free: value on 3G, bumper bundler on 4G
  • Figure 26: The carrier with the most IPv4 addresses per subscriber is…
  • Figure 27: AS_PATH length – not particularly predictive either
  • Figure 28: The buzzword count. “Fibre” beats “backhaul” as a concern
  • Figure 29: Are Project Spring’s targets slipping?


Apple Pay & Weve Fail: A Wake Up Call

Mobile payments: Now is the time

After many years of trials, pilots and uncertainty, the mobile industry is now making a major push to enable consumers to use their mobile phones to complete transactions in stores and other merchant venues. This year is shaping up to be a pivotal year with a number of major launches of commercial mobile payment services involving device makers, mobile operators, the payment networks and retailers.

Crucially, Apple’s move to add Near Field Communications (NFC) – a short-range communications technology – to iPhone 6 has vindicated the telecoms industry’s ongoing push to make NFC a de facto standard for mobile proximity payments. Although sceptics (including Apple executives) have previously derided the cost and complexity of the technology, Vodafone, Orange, China Mobile and other major telcos have continued to develop digital commerce propositions based on the technology.

Apple’s U-turn on NFC has changed the sentiment around the technology dramatically and given the industry a clear sense of direction. Just a year ago, research firms, such as Gartner and Juniper, scaled back their forecasts for the use of mobile handsets to complete transactions in-store, primarily because Apple didn’t include a NFC chip in the iPhone 5.

The widespread use of NFC in stores will add fuel to the mobile payments market which is already growing rapidly.  Some analysts are predicting mobile phones will be used to make transactions totalling more than US$721 billion worldwide by 2017 up from US$235 billion in 2013 (see Figure 1). Note, these figures include both remote/online and proximity/in-store transactions.

Figure 1: Global mobile payment transaction forecasts

Figure 1 - Global mobile payment transaction forecasts

Source: Gartner; Goldman Sachs (via Statista)

Although most consumers are happy paying in store using either cash or payment cards, there are two major reasons why mobile payments are gaining momentum in an increasingly digital economy:

  • Consumers will want to be able to receive and redeem offers, vouchers and loyalty points using their smartphones. A mobile payment service would enable them to do this in a straightforward way.
  • Mobile payments will generate valuable transaction data that could and should (with the consumer’s permission) be used to make highly personalised recommendations and offers.

In other words, mobile payments are an essential element of a compelling integrated digital commerce proposition.

The role of telcos

Although the big picture for mobile payments is improving, telcos are in danger of being side-lined in developed countries in this strategically important sector. (NB See the STL Partners Strategy Report, Digital Commerce 2.0: New $50bn Disruptive Opportunities for Telcos, Banks and Technology Players for a detailed study of how telcos could disrupt the key digital commerce brokers: Amazon, Google, Apple and Facebook.) In recent weeks, telcos’ efforts to lead the development of the mobile payments market suffered two major setbacks. Firstly, Apple’s fully formed mobile payments solution, called Apple Pay, effectively cuts telcos out of the mobile payments business in the Apple ecosystem.

Secondly, it emerged that Weve, the ground-breaking mobile commerce joint venture between U.K. mobile operators, has pulled back from plans to facilitate payments (in addition to its existing role of delivering targeted offers to UK mobile users).  As a rare example of a well thought through collaborative venture between mobile operators, Weve had been a promising initiative that could provide a playbook for collaboration among mobile operators in other developed markets. But Weve’s change of course suggests that mobile operators are still struggling to collaborate effectively in the digital commerce market.

Rewriting the Mobile Payments Playbook

The Apple Pay proposition

Unveiled along with the iPhone 6 and the Apple Watch in September, Apple Pay is an end-to-end mobile payments proposition developed by Apple. On the device side, the basic technical architecture is similar to that advocated by major telcos via the industry group the GSMA – the short-range wireless technology Near Field Communications (NFC) is used to transfer payment data from the device to the point of sale terminal, while a secure element (a segregated memory chip) is used to protect sensitive information from being hacked or corrupted by third-party apps. However, rather than using telcos’ SIM cards as a secure element, Apple has added its own dedicated piece of hardware to the iPhone 6 and bolstered security further with a fingerprint scanner.

Already used to organise boarding passes, tickets, coupons and other collateral, Apple’s Passbook acts as the primary interface for the Apple Pay service. In other words, Passbook is now a fully-fledged mobile wallet. Thanks to its iTunes service, Apple already has hundreds of millions of consumers’ credit and debit card details on file. These consumers can add a compatible payment card stored on iTunes to Passbook simply by entering the card security code. Alternatively, they can use the iPhone camera to scan a payment card into a handset or type in the details manually. If the consumer stores more than one card, Passbook allows them to change the default payment card that appears when they are about to make a transaction.


Figure 2: Apple has made it easy to add payment cards to Passbook

Figure 2 - Apple has made it easy to add payment cards to Passbook

Source: Apple

To make a payment in a store, the consumer simply holds their iPhone next to a NFC-enabled reader (attached to a point of sale terminal) with their finger on the handset’s Touch ID – the fingerprint reader embedded into the latest iPhones (see Figure 3). Unlike some mobile payment solutions, the consumer doesn’t need to open an app or enter a PIN code. The iPhone vibrates and beeps once the payment information has been sent. In this case, the payment information is protected by three layers of security: More than any existing mainstream mobile payments solution, including the SIM-secured NFC payments touted by telcos. These three layers are

  • Rather than transferring actual payment card details, Apple Pay transfers so-called tokens: a device-specific account number, together with a one-time security code.
  • These tokens are encrypted and stored on a secure element inside the iPhone – memory that is ring-fenced from access by any app other than Passbook. They aren’t stored on Apple’s servers, so are protected from online hacking.
  • The payment only happens if the Touch ID system recognises the consumer’s fingerprint, proving the consumer’s was in the store.

Figure 3: The consumer is authenticated via iPhone’s fingerprint scanner

Figure 3: The consumer is authenticated via the iPhone's fingerprint scanner

Source: Apple

If the consumer is using an Apple Watch, which also has a NFC chip and a secure element, they hold the face of the watch near the reader and double-click a button on the side of the watch. As the range of NFC is just a few centimetres, consumers will have to hold the face of their watch against the reader. This step doesn’t sound very intuitive and may cause confusion in stores.

Again, a vibration and beep confirm the transfer of the payment information. Note, the watch needs to have been linked to an iPhone with a compatible payment card stored in a Passbook app. Although Apple Watch isn’t equipped with the Touch ID fingerprint scanner in the iPhone, it does have alternative security mechanisms built in. Apple Watch is equipped with a biosensor that can detect when the watch is taken off and lock its payment function, according to a report by NFC World. Apparently, consumers will have to enter a code to re-enable the payment function when they put the handset back on.  These extra steps suggest making payments using Apple Watch will be more cumbersome and potentially less secure than using an iPhone 6 to make a payment.


Figure 4: You double-click a button to confirm a payment with Apple Watch

Figure 4 - You double-click a button to confirm a payment with Apple Watch

Source: Apple

Apple Pay can also be used to make online payments in compatible apps and this is how many consumers are likely to try the service initially. Apple said that several merchants, including Disney, Starbucks, Target and Uber, have adapted their apps to accept Apple Pay transactions (see Figure 5). In this case, the consumer selects Apple Pay and then places their finger on the Touch ID interface. Note, enabling online payments is an area that has been neglected by many telcos in developed countries targeting this market, but support for remote payments is an essential component of any holistic digital commerce solution  – consumers won’t want to use different digital wallets online and offline.


Figure 4: Various apps allow consumers to make payments via Apple Pay


Figure 5 - Various apps allow consumers to make payments via Apple Pay

 Source: Apple

If a consumer loses their iPhone, then they can use the Find My iPhone service to put their device into “lost mode” or they can opt to wipe the handset. The next time the iPhone goes online, it will be frozen or wiped, depending on the option the consumer selected. Note, this feature negates one of the advantages of using a SIM card, which can also be wiped remotely by a telco, as a secure element.

Although the consumer’s most recent purchases will be viewable in Passbook, Apple says it won’t save consumer’s transaction information. This is in stark contrast to the approach taken by Apple’s own iTunes service and Amazon, for example, which uses a consumer’s transaction history to make personalised product and service recommendations. With Apple Pay, it seems a consumer will only be able to check historic transactions by looking at their bank statements.

The big guns in the U.S. financial services industry are supporting Apple Pay – consumers can use credit and debit cards from the three major payment networks, American Express, MasterCard and Visa, issued by a range of leading banks, including Bank of America, Capital One Bank, Chase, Citi and Wells Fargo, representing 83% of credit card purchase volume in the US, according to Apple, which says additional banks, including Barclaycard, Navy Federal Credit Union, PNC Bank, USAA and U.S. Bank, are also planning to sign up. This is a much greater level of participation than that achieved by Softcard (formerly known as Isis), the mobile commerce joint venture between U.S. telcos AT&T Mobile, Verizon Wireless and T-Mobile USA (see next section for more on Softcard).

Apple says that more than 220,000 bricks and mortar stores will accept Apple Pay transactions. Some of the participating retailers include leading brands, such as McDonalds, Stables, Subway, ToysRUs and Walgreens. However, the retailers in the Merchant Customer Exchange (MCX) consortium, which is developing its own mobile commerce proposition, have not signed up to accept Apple Pay. These retailers include major players, such as WalMart, Best-Buy, 7-11, Gap and Sears. (See next section for more on MCX). Although only a handful of apps are supporting Apple Pay today, that number is likely to grow rapidly, as many consumers will find it easier to press the Touch ID than to type in a password.

To access the rest of this 28 page Telco 2.0 Report in full, including…

  • Introduction
  • Executive Summary
  • Mobile payments: Now is the time
  • Rewriting the Mobile Payments Playbook
  • The Apple Pay proposition
  • Will Apple Pay be a success? 
  • The implications of Apple Pay for telcos
  • The Weve U-Turn
  • How Weve broke new ground
  • Weve’s shareholders break ranks
  • Weve pulls back
  • Conclusions and recommendations

…and the following report figures…

  • Figure 1: Forecasts for the value of mobile proximity payments in the U.S 
  • Figure 2: Apple has made it easy to add payment cards to Passbook
  • Figure 3: The consumer is authenticated via the iPhone’s fingerprint scanner
  • Figure 4: You double-click a button to confirm a payment with Apple Watch
  • Figure 5: Various apps allow consumers to make payments via Apple Pay
  • Figure 6: MCX’s approach to security
  • Figure 7: Apple’s shrinking share of the global smartphone market
  • Figure 8: The Softcard wallet enables consumers to filter offers by their location
  • Figure 9: The virtuous circle Weve was aiming to create
  • Figure 10: Everything Everywhere’s Cash on Tap app is clunky to use


Connected Car: Key Trends, Players and Battlegrounds

Introduction: Putting the Car in Context

A growing mythology around M2M and the Internet of Things

The ‘Internet of Things’, which is sometimes used interchangeably with ‘machine-to-machine’ communication (M2M), is not a new idea: as a term, it was coined by Kevin Ashton as early as 1999. Although initially focused on industrial applications, such as the use of RFID for tagging items in the supply chain, usage of the term has now evolved to more broadly describe the embedding of sensors, connectivity and (to varying degrees) intelligence into traditionally ‘dumb’ environments. Figure 1 below outlines some of the service areas potentially disrupted, enabled or enhanced by the Internet of Things (IoT):

Figure 1: Selected Internet of Things service areas

Source: STL Partners

To put the IoT in context, one can conceive of the Internet as having experienced three key generations to date. The first generation dates back to the 1970s, which involved ARPANET and the interconnection of various military, government and educational institutions around the United States. The second, beginning in the 1990s, can be thought of as the ‘AOL phase’, with email and web browsing becoming mainstream. Today’s generation is dominated by ‘mobile’ and ‘social’, with the two inextricably linked. The fourth generation will be signified by the arrival of the Internet of Things, in which the majority of internet traffic is generated by ‘things’ rather than humans.

The enormous growth of networks, cheaper connectivity, proliferation of smart devices, more efficient wireless protocols (e.g. ZigBee) and various government incentives/regulations have led many to confidently predict that the fourth generation of the Internet – the Internet of Things – will soon be upon us. Visions include the “Internet of Everything” (Cisco) or a “connected future” with 50 billion connected devices by 2020 (Ericsson). Similarly rapid growth is also forecasted by the MIT Technology Review, as detailed below:

Figure 2: Representative connected devices forecast, 2010-20

Source: MIT Technology Review

This optimism is reflected in broader market excitement, which has been intensified by such headline-grabbing announcements as Google’s $3.2bn acquisition of Nest Labs (discussed in depth in the Connected Home EB) and Apple’s recently announced Watch. Data extracted from Google Trends (Figure 3) shows that the popularity of ‘Internet of Things’ as a search term has increased fivefold since 2012:

Figure 3: The popularity of ‘Internet of Things’ as a search term on Google since 2004

Source: Google Trends

However, the IoT to date has predominantly been a case study in hype vs. reality. Technologists have argued for more than a decade about when the army of connected devices will arrive, as well as what we should be calling this phenomenon, and with this a mythology has grown around the Internet of Things: widespread disruption was promised, but it has not yet materialised. To many consumers the IoT can sound all too far-fetched: do I really need a refrigerator with a web browser?

Yet for every ‘killer app’ that wasn’t we are now seeing inroads being made elsewhere. Smart meters are being deployed in large numbers around the world, wearable technology is rapidly increasing in popularity, and many are hailing the connected car as the ‘next big thing’. Looking at the connected car, for example, 2013 saw a dramatic increase in the amount of VC funding it received:

Figure 4: Connected car VC activity, 2010-13

Source: CB Insights Venture Capital Database

The Internet of Things is potentially an important phenomenon for all, but it is of particular relevance to mobile network operators (MNOs) and network equipment providers. Beyond providing cellular connectivity to many of these devices, the theory is that MNOs can expand across the value chain and generate material and sustainable new revenues as their core business continues to decline (for more, see the ‘M2M 2.0: New Approaches Needed’ Executive Briefing).

Nevertheless, the temptation is always to focus on the grandiose but less well-defined opportunities of the future (e.g. smart grids, smart cities) rather than the less expansive but more easily monetised ones of today. It is easy to forget that MNOs have been active to varying degrees in this space for some time: for example, O2 UK had a surprisingly large business serving fleet operators with the 9.6Kbps Mobitex data network for much of the 2000s. To further substantiate this context, we will address three initial questions:

  1. Is there a difference between M2M and the Internet of Things?
  2. Which geographies are currently seeing the most traction?
  3. Which verticals are currently seeing the most traction?

These are now addressed in turn…


  • Executive Summary
  • Introduction: Putting the Car in Context
  • A growing mythology around M2M and the Internet of Things
  • The Internet of Things: a vision of what M2M can become
  • M2M today: driven by specific geographies and verticals
  • Background: History and Growth Drivers
  • History: from luxury models to mass market deployment
  • Growth drivers: macroeconomics, regulation, technology and the ‘connected consumer’
  • Ecosystem: Services and Value Chain
  • Service areas: data flows vs. consumer value proposition
  • Value chain: increasingly complex with two key battlegrounds
  • Markets: Key Geographies Today
  • Conclusions


  • Figure 1: Selected Internet of Things service areas
  • Figure 2: Representative connected devices forecast, 2010-20
  • Figure 3: The popularity of ‘Internet of Things’ as a search term on Google since 2004
  • Figure 4: Connected car VC activity, 2010-13
  • Figure 5: Candidate differences between M2M and the Internet of Things
  • Figure 6: Selected leading MNOs by M2M connections globally
  • Figure 7: M2M market maturity vs. growth by geographic region
  • Figure 8: Global M2M connections by vertical, 2013-20
  • Figure 9: Global passenger car profit by geography, 2007-12
  • Figure 10: A connected car services framework
  • Figure 11: Ericsson’s vision of the connected car’s integration with the IoT
  • Figure 12: The emerging connected car value chain
  • Figure 13: Different sources of in-car connectivity
  • Figure 14: New passenger car sales vs. consumer electronics spending by market
  • Figure 15: Index of digital content spending (aggregate and per capita), 2013
  • Figure 16: OEM embedded modem shipments by region, 2014-20
  • Figure 17: Telco 2.0™ ‘two-sided’ telecoms business model

Launchers: a new relevance point for telcos?

Introduction

Improving engagement has many benefits for an operator. It can help change customers’ perceptions which in turn can reduce churn and increase customer acquisition as well as opening up new avenues for telcos to offer additional services.

In this note, we analyse the opportunity for mobile operators within a new control point in the digital ecosystem – the ‘launcher’ application for Android devices. We present an overview of the opportunity, assessing what the product is and what’s at stake as well as providing an overview of the key players in this space. The report then focuses on how telcos may choose to play in this area, analysing the different strategies and their suitability to different types of operators.

The Telco Dilemma

Telcos’ engagement with and knowledge of their customers has been marginalized in the smartphone world. Whilst telcos still understand how customers use the traditional components of their mobile device (voice calls; messaging; data usage), the main digital disruptors now determine how users primarily engage with their devices – they control:

  • App portals (Apple; Android)
  • Search (Google)
  • E/M-commerce (Amazon; eBay; PayPal)
  • Content services (YouTube; Yahoo)
  • OTT comms (Facebook; WhatsApp; Twitter)

For more analysis on how telcos can understand and deal with these disruptors please read Telco 2.0’s analysis on this topic (Digital Commerce 2.0: Disrupting the Californian Giants [Oct 2013]; Dealing with the ‘Disruptors’ [Nov 2011]).

Engagement in the digital ecosystem is clearly worth a significant amount of money, both in terms of direct revenue as well as the indirect revenue associated with additional customer insight and knowledge. The valuations of companies such as Facebook and WhatsApp show the value premium that user engagement attracts. As mobile devices become even more prevalent and important in consumers’ lives, this engagement will become even more valuable.

In order for telcos to capitalize on this, they need to change their engagement strategy and gain more visibility and understanding of their customers. The industry largely understands this concept and a number or attempts have been made by telcos to wrestle back control of the device. Operators with bold ambitions have tried to compete head on, offering competing platforms to the OTT players (e.g. Vodafone 360) whilst others have attempted to position themselves within a segment of the digital ecosystem. Despite best efforts, these initiatives have so far met with mixed success.

One new area of opportunity for those looking to regain relevance on the mobile device (and one that is proving very popular right now) is the Android launcher.

The Opportunity

What is a launcher?

A launcher is a customizable home screen for your Android device. It allows a user to arrange their apps in more creative ways, resulting in a more personalized, engaging mobile experience.

Launchers can range from sophisticated 3D menus, to themed displays, to simplified app categorization/ grouping. For example, Yahoo’s Aviate launcher changes the apps it displays based on the time of day and the location of the user (e.g. at work, on the go, at home) – meaning that the user can more easily access the right apps to match their current situation.

Figure 1: Popular launchers in the marketplace

Figure 1 Popular launchers - Telco

Left: The Next Launcher’s 3D display – Source: Google Play; Middle: Buzz’s multi-themed launcher – Source: Drippler; Right: Aviate’s app re-categorization launcher – Source: Android Community


Launchers are more than just new ‘skins’ for the device. They alter how users interact with their device through app organization as well as through additional tools & services, including:

  • Relevant content on nearby places (e.g. Aviate incorporates Foursquare)
  • Helpful information, including travel & traffic advice (e.g. Google Now)
  • Inbuilt app & content recommendation engines (e.g. EverythingMe)

This combination of customizable app organization and easily accessible additional services is proving to be a compelling proposition for Android users.

Will launchers really take off?

The concept of a customizable home screen is not new but with advancements in smartphone operating systems and device displays this customization is starting to take off. A recent report by Flurry found that there were over 4,500 of these launcher-type apps and that launcher usage in Q1 2014 was greater than the total for all of 2013.

Figure 2: Number of Launcher Application Sessions (Quarterly data)

Number of launcher application sessions

Source: Flurry Analytics

The evidence shows that launchers are beginning to take off. They are offering value to the customer, through customization and additional services, as well as providing a new tool for companies to engage with and understand the behavior of the user.

What’s at stake?

Launchers represent a new control point in the digital ecosystem, shaping how (and potentially what) information is presented to the user. Gaining insight into how a customer uses their phone combined with a contextual understanding of their situation has the potential to create significant value.

Different launcher applications provide different functionality, with some focusing more on themes and customization and others focusing more on developing customer insight to simplify display and discovery on the mobile device. These models have different methods of monetization, including:

  • Freemium models – where a more basic version is free and the premium version is a paid for download
  • App discovery – where apps are recommended to the user (and the recommendation may be paid for)
  • Sponsored search – where the first result(s) are paid for

Of these models and monetization methods we believe contextual search and discovery are the most interesting. Mobile has revolutionized how people find information and use digital services – however, mobile usage is built around apps (86% of time spent on mobile devices is spent inside applications – Source: Techcrunch). The difficulty with (discovering) apps is that they are largely standalone services – they cannot be crawled or indexed easily and there is little cross-app integration. This makes relevant apps (and the content within them) harder to find through search alone.

Launchers can attempt to organize apps in a similar way that search engines organize the web, providing a more user-friendly app discovery mechanism. Launchers can gain significant insight into user behaviour (e.g. the type of apps downloaded and time spent using apps) – this information can be used to recommend apps and other content and services to the user in an integrated way, allowing launchers to circumvent search within app portals and to make recommendations (for apps and content) to a user when they have demonstrated a preference for it. Indeed, EverythingMe, an innovative launcher company, have suggested that “users are searching less and less, but still expect results and discovery. We felt the best solution would be a contextual search product in the form of an Android launcher.”

As the mobile device becomes more important and central to the user’s life, controlling this interface and engagement has the potential to generate very valuable insight. This personalized discovery tool, as long it remains transparent and offers a tangible benefit to the customer, could revolutionize how value is derived from mobile applications.

The Players

This potential opportunity has not gone unnoticed with a number of the big digital players recently entering this space. However, as this technology and engagement strategy is in its infancy, no-one has taken a clear lead in the race.

Facebook

Facebook, in April of last year, released Facebook Home, a launcher dedicated to putting social communication above all other applications on the mobile device (through cover feed, always-on chat heads and improved notifications). Despite a lot of initial fanfare, its performance has not been overly strong (only 0.5% of Facebook’s 1 billion monthly active users have installed it and it has received negative user feedback). Notwithstanding this slow start the company still sees this platform as a critical opportunity, with Facebook’s engineering Director, Jocelyn Goldfein, saying earlier this year in an interview with Venturebeat, “we’re still very bullish on Home…we’re believers in Home; we believe it’s going to be valuable for users”. Facebook’s continued resilience and flexibility when adapting to mobile could lead to a redesigned launcher that (social media) users’ value.

We believe that the relative failure of Facebook Home shows an important lesson for would be Launcher owners: the goal should be to optimize the customer experience and not maximize the placement of services for your own or others’ brands. After all, who wants the first screen on their phone to be in someone else’s control? This represents an opportunity for telcos, who don’t necessarily have the imperative to dominate the home screen with ads or today’s feed, and can therefore entertain a more intuitive and customer-oriented design. [NB It is also important that telcos attempt to learn from their own past errors: the ‘walled garden’ is not a successful model for most.]

For a more detailed assessment of Facebook Home’s service please see Facebook Home: what is the impact? [April 2013]


  • Executive Summary
  • Introduction
  • The Telco Dilemma
  • The Opportunity
  • What is a launcher?
  • Will launchers really take off?
  • What’s at stake?
  • The Players
  • Facebook
  • Google
  • Yahoo
  • Twitter
  • Other Popular Launchers
  • The Answer (for Telcos)?
  • Why should Telco’s play?
  • How can Telco’s play?
  • Conclusion


  • Figure 1: Popular launchers in the marketplace
  • Figure 2: Number of Launcher Application Sessions (Quarterly data)
  • Figure 3: Assessing Telcos’ options to enter the launcher market

Faster than Facebook: how to speed up digital transformation and disruptive innovation

Introduction

The OnFuture EMEA 2014 Executive Brainstorm took place from 11-12 June in London. The Brainstorm brought together 150 senior executives from across telecoms, technology, media, retail, financial services, and other sectors. It covered:

  • Digital Innovation, Transformation and Disruption
  • Future Communications and Enterprise Mobility
  • The Internet of Things and In-Store Retail
  • Accelerating Innovation in the Telecoms and Technology Sectors
  • Eight Innovation Showcases
  • Mobile Brand Engagement and Mobile Music and Video
  • Digital Identity and Mobile Data Analytics
  • The Future of Mobile Marketing

This document is a high-level summary of our main take-outs from the events, and includes some headline outcomes from the participants’ votes. Full details of votes and presentations are available to participants and subscribers to the Telco 2.0 Executive Briefing Service

Our thanks to our event sponsors:

EMEA 2014 Sponsors

A growing sense of urgency and activity

Whereas even 2 years ago, we felt as if we were still talking to a telecoms industry largely seeming in denial of the massive threat to its existing business, at the OnFuture EMEA 2014 Brainstorm there was a clear shift towards people and companies working on real activities to change their businesses, innovate, and find new sources of growth.

Urgency: but as a result of lateness?

Nonetheless, following a string of painful results announcements from European telcos (see Telco 1.0: Death Slide Starts in Europe), it was perhaps unsurprising to see that most of the execs felt that their companies were generally significantly ‘behind the curve’ of adapting to the digital era (see Figure 1).

Figure 1: 78% said their companies were ‘behind the curve’ – or worse

EMEA 2014 Existing Business remains the biggest obstacle to innovation

Source: Participant Vote, OnFuture EMEA 2014 Executive Brainstorm

Some positive signs

On a slightly more optimistic note, we were pleasantly surprised by the number of participants saying their companies had specific programmes to drive change and innovation, and our research and indeed discussions with the audience showed that this included a number of major European telcos (see Figure 2).

Figure 2: Some progress on specific actions on disruptive innovation

Some progress on specific actions on disruptive innovation 

Source: Participant Vote, OnFuture EMEA 2014 Executive Brainstorm

However, as we’ve seen in detail in the Telco 2.0 Transformation Index research, the degree of progress that has been made even by some of the leading telcos still lags what we would prescribe (see Figure 3).

Figure 3: Analysis of transformation progress of leading telcos

Telco 2 Transformation Index - Analysis of transformation progress of leading telcos

Source: Telco 2.0 Transformation Index and STL Partners’ presentation to OnFuture EMEA 2014

The enemy within

On a day that London’s black cab drivers went on strike against the entry of the Uber app in the UK, it wasn’t a huge surprise to see that ‘existing business’ was cited as the biggest obstacle to change (see Figure 4)

Figure 4: ‘Existing Business’ remains the biggest obstacle to innovation

EMEA 2014 Existing Business remains the biggest obstacle to innovation

Source: Participant Vote, OnFuture EMEA 2014 Executive Brainstorm

In the brainstorming session following the initial presentations (and including these votes), participants chose an industry to consider, and then brainstormed the key issues they faced, and the priority actions to resolve them. A slight majority of the tables chose the telecoms industry, or a telco within it, and the others chose Retail, Airlines, Taxis, Netflix, and Insurance.

A common theme was addressing how to create a culture and environment for change. The use of appropriate management incentives, KPIs and metrics were discussed at some length (for more on this, see What can be learned and done? page 11).

Other issues discussed included achieving a balance between creating innovation and running the core business, building successful partnerships, and how to ‘compete against free’ in content oriented industries such as Pay TV.


  • Executive Summary
  • Introduction
  • A growing sense of urgency and activity
  • Urgency: but as a result of lateness?
  • Some positive signs
  • The enemy within
  • Facebook’s internal recipe for speed
  • What can be learned and done?
  • How to be a bit more Facebook
  • How to be a bit more Telco 2.0
  • Key lesson from Cisco: integration is critical
  • Highlights from other votes
  • Software Defined Networking (SDN)
  • Future Communications Services
  • Enterprise Mobility
  • Connected Homes
  • Mobile Payments / Commerce
  • Mobile Brand Engagement
  • Digital / Mobile Entertainment
  • Data and Identity Services


  • Figure 1: 78% said their companies were ‘behind the curve’ – or worse
  • Figure 2: Some progress on specific actions on disruptive innovation
  • Figure 3: Analysis of transformation progress of leading telcos
  • Figure 4: ‘Existing Business’ remains the biggest obstacle to innovation
  • Figure 5: Facebook’s impressive mobile transformation
  • Figure 6: How to (realistically) be more Facebook-ish
  • Figure 7: STL Partners’ recommendations to accelerate transformation
  • Figure 8: Cisco regards integration ‘as important as the deal itself’

New Mobile & Digital Transformation Strategies: OnFuture EMEA Executive Brainstorm 2014, Day One (Wednesday 11 June)

New Mobile & Digital Transformation Strategies. Presentations and Voting Slides from the New Mobile & Digital Transformation Strategies stream of the OnFuture EMEA Executive Brainstorm, 11th June 2014, in London.

0845 Event Start: Welcome, Agenda, Introductions & Warm Up

Andrew Collinson, COO & Research Director, STL Partners/Telco 2.0 Initiative (download here)

0900 Managing Disruptive Innovation in the Digital World

Chris Barraclough, MD & Chief Strategist, STL Partners/Telco 2.0 Initiative (download here)

Peter Briscoe, Head of Innovation, Ericsson (download here)

Paolo Campoli, Service Provider CTO, Cisco (download here)


In the afternoon there were two parallel streams – Communications Services and In-Home and In-Store Services:

Stream A Workshops: Communications Services – Innovation for the Consumer and the Enterprise

1345 Future Communications: Radical innovation in voice, messaging and data services

Bob Brace, Senior Analyst, STL Partners/Telco 2.0 Initiative (download here)

Rainer Deutschmann, SVP Core Product Innovation, Deutsche Telekom (download here)

Giles Corbett, Head of Libon, Orange (download here)

Dean Elwood, CEO and Founder, Voxygen (Panel Only)

Chris Barraclough, MD & Chief Strategist, STL Partners/Telco 2.0 Initiative (Moderator)


1430 Enterprise Mobility: A strategic approach to creating competitive advantage

Bob Brace, Senior Analyst, STL Partners/Telco 2.0 Initiative (download here)

Albane Coeurquetin, Consultant, STL Partners/Telco 2.0 Initiative (download here)

Michael Crossey, Director Product Marketing, Intel (Unavailable)

Alessandro Vigilante, VP Business Development & Strategy, Colt (download here)

Philip Laidler, Director of Consulting, STL Partners/Telco 2.0 Initiative (Moderator)


Stream B: In-Home and In-Store Services: the ‘Internet of Things…and of People’

1315 The ‘Internet of Things’ in the Digital Home: Towards a new ecosystem

Matt Jones, Consultant, STL Partners/Telco 2.0 Initiative (download here)

Martin Harriman, Director of Digital Home, Telefonica (download here)

Kevin Petersen, SVP, AT&T Digital Home (download here)

Pilgrim Beart, Founder, AlertMe (download here)

Philip Laidler, Director of Consulting, STL Partners/Telco 2.0 Initiative (Moderator)


1430 In-Store Retail: How mobile technology can revive the high street, not kill it

Owen McCabe, Director, Kantar Retail (download here)

Omaid Hiwaizi, Chief Strategy Officer, Geometry Global/WPP (download here)

Graham Cove, Director of Wi-Fi, Everything Everywhere (EE) (download here)

Chris Barraclough, MD & Chief Strategist, STL Partners/Telco 2.0 Initiative (Moderator)


Final plenary session:

1615 Mobile Payments: Creating a viable ecosystem that enables true ‘mobile commerce’

Andrew Collinson, STL Partners/Telco 2.0 Initiative (Moderator)

Holger Rambach, VP Products & Innovation, Deutsche Telekom (download here)

David Pringle, Senior Associate, STL Partners/Telco 2.0 Initiative (Panel Only)

Phil Laidler, Director of Consulting, STL Partners/Telco 2.0 Initiative (Panel Only)


Voting slides from Day 1: New Mobile & Digital Transformation Strategies


Click here for Day 2 presentations – Next Generation Mobile Marketing & Commerce
Click here to go back to the main OnFuture EMEA London page

Triple-Play in the USA: Infrastructure Pays Off

Introduction

In this note, we compare the recent performance of three US fixed operators who have adopted contrasting strategies and technology choices, AT&T, Verizon, and Comcast. We specifically focus on their NGA (Next-Generation Access) triple-play products, for the excellent reason that they themselves focus on these to the extent of increasingly abandoning the subscriber base outside their footprints. We characterise these strategies, attempt to estimate typical subscriber bundles, discuss their future options, and review the situation in the light of a “Deep Value” framework.

A Case Study in Deep Value: The Lessons from Apple and Samsung

Deep value strategies concentrate on developing assets that will be difficult for any plausible competitor to replicate, in as many layers of the value chain as possible. A current example is the way Apple and Samsung – rather than Nokia, HTC, or even Google – came to dominate the smartphone market.

It is now well known that Apple, despite its image as a design-focused company whose products are put together by outsourcers, has invested heavily in manufacturing throughout the iOS era. Although the first generation iPhone was largely assembled from proprietary parts, in many ways it should be considered as a large-scale pilot project. Starting with the iPhone 3GS, the proportion of Apple’s own content in the devices rose sharply, thanks to the acquisition of PA Semiconductor, but also to heavy investment in the supply chain.

Not only did Apple design and pilot-produce many of the components it wanted, it bought them from suppliers in advance to lock up the supply. It also bought machine tools the suppliers would need, often long in advance to lock up the supply. But this wasn’t just about a tactical effort to deny componentry to its competitors. It was also a strategic effort to create manufacturing capacity.

In pre-paying for large quantities of components, Apple provides its suppliers with the capital they need to build new facilities. In pre-paying for the machine tools that will go in them, they finance the machine tool manufacturers and enjoy a say in their development plans, thus ensuring the availability of the right machinery. They even invent tools themselves and then get them manufactured for the future use of their suppliers.

Samsung is of course both Apple’s biggest competitor and its biggest supplier. It combines these roles precisely because it is a huge manufacturer of electronic components. Concentrating on its manufacturing supply chain both enables it to produce excellent hardware, and also to hedge the success or failure of the devices by selling componentry to the competition. As with Apple, doing this is very expensive and demands skills that are both in short supply, and sometimes also hard to define. Much of the deep value embedded in Apple and Samsung’s supply chains will be the tacit knowledge gained from learning by doing that is now concentrated in their people.

The key insight for both companies is that industrial and user-experience design is highly replicable, and patent protection is relatively weak. The same is true of software. Apple had a deeply traumatic experience with the famous Look and Feel lawsuit against Microsoft, and some people have suggested that the supply-chain strategy was deliberately intended to prevent something similar happening again.

Certainly, the shift to this strategy coincides with the launch of Android, which Steve Jobs at least perceived as a “stolen product”. Arguably, Jobs repeated Apple’s response to Microsoft Windows, suing everyone in sight, with about as much success, whereas Tim Cook in his role as the hardware engineering and then supply-chain chief adopted a new strategy, developing an industrial capability that would be very hard to replicate, by design.

Three Operators, Three Strategies

AT&T

The biggest issue any fixed operator has faced since the great challenges of privatisation, divestment, and deregulation in the 1980s is that of managing the transition from a business that basically provides voice on a copper access network to one that basically provides Internet service on a co-ax, fibre, or possibly wireless access network. This, at least, has been clear for many years.

AT&T is the original telco – at least, AT&T likes to be seen that way, as shown by their decision to reclaim the iconic NYSE ticker symbol “T”. That obscures, however, how much has changed since the divestment and the extremely expensive process of mergers and acquisitions that patched the current version of the company together. The bit examined here is the AT&T Home Solutions division, which owns the fixed-line ex-incumbent business, also known as the merged BellSouth and SBC businesses.

AT&T, like all the world’s incumbents, deployed ADSL at the turn of the 2000s, thus getting into the ISP business. Unlike most world incumbents, in 2005 it got a huge regulatory boost in the form of the Martin FCC’s Comcast decision, which declared that broadband Internet service was not a telecommunications service for regulatory purposes. This permitted US fixed operators to take back the Internet business they had been losing to independent ISPs. As such, they were able to cope with the transition while concentrating on the big-glamour areas of M&A and wireless.

As the 2000s advanced, it became obvious that AT&T needed to look at the next move beyond DSL service. The option taken was what became U-Verse, a triple-play product which consists of:

  • Either ADSL, ADSL2+, or VDSL, depending on copper run length and line quality
  • Plus IPTV
  • And traditional telephony carried over IP.

This represents a minimal approach to the transition – the network upgrade requires new equipment in the local exchanges, or Central Offices in US terms, and in street cabinets, but it does not require the replacement of the access link, nor any trenching.

This minimisation of capital investment is especially important, as it was also decided that U-Verse would not deploy into areas where the copper might need investment to carry it. These networks would eventually, it was hoped, be either sold or closed and replaced by wireless service. U-Verse was therefore, for AT&T, in part a means of disposing of regulatory requirements.

It was also important that the system closely coupled the regulated domain of voice with the unregulated, or at least only potentially regulated, domain of Internet service and the either unregulated or differently regulated domain of content. In many ways, U-Verse can be seen as a content first strategy. It’s TV that is expected to be the primary replacement for the dwindling fixed voice revenues. Figure 1 shows the importance of content to AT&T vividly.

Figure 1: U-Verse TV sales account for the largest chunk of Telco 2.0 revenue at AT&T, although M2M is growing fast

Telco 2 UVerse TV sales account for the largest chunk of Telco 2 revenue at ATandT although M2M is growing fast.png

Source: Telco 2.0 Transformation Index

This sounds like one of the telecoms-as-media strategies of the late 1990s. However, it should be clearly distinguished from, say, BT’s drive to acquire exclusive sports content and to build up a brand identity as a “channel”. U-Verse does not market itself as a “TV channel” and does not buy exclusive content – rather, it is a channel in the literal sense, a distributor through which TV is sold. We will see why in the next section.

The US TV Market

It is well worth remembering that TV is a deeply national industry. Steve Jobs famously described it as “balkanised” and as a result didn’t want to take part. Most metrics vary dramatically across national borders, as do qualitative observations of structure. (Some countries have a big public sector broadcaster, like the BBC or indeed Al-Jazeera, to give a basic example.) Countries with low pay-TV penetration can be seen as ones that offer greater opportunities, it being usually easier to expand the customer base than to win share from the competition (a “blue ocean” versus a “red sea” strategy).

However, it is also true that pay-TV in general is an easier sell in a market where most TV viewers already pay for TV. It is very hard to convince people to pay for a product they can obtain free.

In the US, there is a long-standing culture of pay-TV, originally with cable operators and more recently with satellite (DISH and DirecTV), IPTV or telco-delivered TV (AT&T U-Verse and Verizon FiOS), and subscription OTT (Netflix and Hulu). It is also a market characterised by heavy TV usage (an average household has 2.8 TVs). Out of the 114.2 million homes (96.7% of all homes) receiving TV, according to Nielsen, there are some 97 million receiving pay-TV via cable, satellite, or IPTV, a penetration rate of 85%. This is the largest and richest pay-TV market in the world.

In this sense, it ought to be a good prospect for TV in general, with the caveat that a “Sky Sports” or “BT Sport” strategy based on content exclusive to a distributor is unlikely to work. This is because typically, US TV content is sold relatively openly in the wholesale market, and in many cases, there are regulatory requirements that it must be provided to any distributor (TV affiliate, cable operator, or telco) that asks for it, and even that distributors must carry certain channels.

Rightsholders have backed a strategy based on distribution over one based on exclusivity, on the principle that the customer should be given as many opportunities as possible to buy the content. This also serves the interests of advertisers, who by definition want access to as many consumers as possible. Hollywood has always aimed to open new releases on as many cinema screens as possible, and it is the movie industry’s skills, traditions, and prejudices that shaped this market.

As a result, it is relatively easy for distributors to acquire content, but difficult for them to generate differentiation by monopolising exclusive content. In this model, differentiation tends to accrue to rightsholders, not distributors. For example, although HBO maintains the status of being a premium provider of content, consumers can buy it from any of AT&T, Verizon, Comcast, any other cable operator, satellite, or direct from HBO via an OTT option.

However, pay-TV penetration is high enough that any new entrant (such as the two telcos) is committed to winning share from other providers, the hard way. It is worth pointing out that the US satellite operators DISH and DirecTV concentrated on rural customers who aren’t served by the cable MSOs. At the time, their TV needs weren’t served by the telcos either. As such, they were essentially greenfield deployments, the first pay-TV propositions in their markets.

The biggest change in US TV in recent times has been the emergence of major new distributors, the two RBOCs and a range of Web-based over-the-top independents. Figure 2 summarises the situation going into 2013.

Figure 2: OTT video providers beat telcos, cablecos, and satellite for subscriber growth, at scale

OTT video providers beat telcos cablecos and satellite for subscriber growth at scale

Source: Telco 2.0 Transformation Index

The two biggest classes of distributors saw either a marginal loss of subscribers (the cablecos) or a marginal gain (satellite). The two groups of (relatively) new entrants, as you’d expect, saw much more growth. However, the OTT players are both bigger and much faster growing than the two telco players. It is worth pointing out that this mostly represents additional TV consumption, typically, people who already buy pay-TV adding a Netflix subscription. “Cord cutting” – replacing a primary TV subscription entirely – remains rare. In some ways, U-Verse can be seen as an effort to do something similar, upselling content to existing subscribers.

Competing for the Whole Bundle – Comcast and the Cable Industry

So how is this option doing? The following chart, Figure 3, shows that in terms of overall service ARPU, AT&T’s fixed strategy is delivering inferior results than its main competitors.

Figure 3: Cable operators lead the way on ARPU. Verizon, with FiOS, is keeping up

Cable operators lead the way on ARPU. Verizon, with FiOS, is keeping up

Source: Telco 2.0 Transformation Index

The interesting point here is that Time Warner Cable is doing less well than some of its cable industry peers. Comcast, the biggest, claims a $159 monthly ARPU for triple-play customers, and it probably has a higher density of triple-players than the telcos. More representatively, they also quote a figure of $134 monthly average revenue per customer relationship, including single- and double-play customers. We have used this figure throughout this note. TWC, in general, is more content-focused and less broadband-focused than Comcast, having taken much longer to roll out DOCSIS 3.0. But is that important? After all, aren’t cable operators all about TV? Figure 4 shows clearly that broadband and voice are now just as important to cable operators as they are to telcos. The distinction is increasingly just a historical quirk.

Figure 4: Non-video revenues – i.e. Internet service and voice – are the driver of growth for US cable operators

Non video revenues ie Internet service and voice are the driver of growth for US cable operatorsSource: NCTA data, STL Partners

As we have seen, TV in the USA is not a differentiator because everyone’s got it. Further, it’s a product that doesn’t bring differentiation but does bring costs, as the rightsholders exact their share of the selling price. Broadband and voice are different – they are, in a sense, products the operator makes in-house. Most have to buy the tools (except Free.fr which has developed its own), but in any case the operator has to do that to carry the TV.

The differential growth rates in Figure 4 represent a substantial change in the ISP industry. Traditionally, the Internet engineering community tended to look down on cable operators as glorified TV distribution systems. This is no longer the case.

In the late 2000s, cable operators concentrated on improving their speeds and increasing their capacity. They also pressed their vendors and standardisation forums to practice continuous improvement, creating a regular upgrade cycle for DOCSIS firmware and silicon that lets them stay one (or more) jumps ahead of the DSL industry. Some of them also invested in their core IP networking and in providing a deeper and richer variety of connectivity products for SMB, enterprise, and wholesale customers.

Comcast is the classic example of this. It is a major supplier of mobile backhaul, high-speed Internet service (and also VoIP) for small businesses, and a major actor in the Internet peering ecosystem. An important metric of this change is that since 2009, it has transitioned from being a downlink-heavy eyeball network to being a balanced peer that serves about as much traffic outbound as it receives inbound.

The key insight here is that, especially in an environment like the US where xDSL unbundling isn’t available, if you win a customer for broadband, you generally also get the whole bundle. TV is a valuable bonus, but it’s not differentiating enough to win the whole of the subscriber’s fixed telecoms spend – or to retain it, in the presence of competitors with their own infrastructure. It’s also of relatively little interest to business customers, who tend to be high-value customers.


  • Executive Summary
  • Introduction
  • A Case Study in Deep Value: The Lessons from Apple and Samsung
  • Three Operators, Three Strategies
  • AT&T
  • The US TV Market
  • Competing for the Whole Bundle – Comcast and the Cable Industry
  • Competing for the Whole Bundle II: Verizon
  • Scoring the three strategies – who’s winning the whole bundles?
  • SMBs and the role of voice
  • Looking ahead
  • Planning for a Future: What’s Up Cable’s Sleeve?
  • Conclusions


  • Figure 1: U-Verse TV sales account for the largest chunk of Telco 2.0 revenue at AT&T, although M2M is growing fast
  • Figure 2: OTT video providers beat telcos, cablecos, and satellite for subscriber growth, at scale
  • Figure 3: Cable operators lead the way on ARPU. Verizon, with FiOS, is keeping up
  • Figure 4: Non-video revenues – i.e. Internet service and voice – are the driver of growth for US cable operators
  • Figure 5: Comcast has the best pricing per megabit at typical service levels
  • Figure 6: Verizon is ahead, but only marginally, on uplink pricing per megabit
  • Figure 7: FCC data shows that it’s the cablecos, and FiOS, who under-promise and over-deliver when it comes to broadband
  • Figure 7: Speed sells at Verizon
  • Figure 8: Comcast and Verizon at parity on price per megabit
  • Figure 9: Typical bundles for three operators. Verizon FiOS leads the way
  • Figure 12: The impact of learning by doing on FTTH deployment costs during the peak roll-out phase

Telco 1.0: Death Slide Starts in Europe

Telefonica results confirm that global telecoms revenue decline is on the way

Very weak Q1 2014 results from Telefonica and other European players 

Telefonica’s efforts to transition to a new Telco 2.0 business model are well-regarded at STL Partners.  The company, together with SingTel, topped our recent Telco 2.0 Transformation Index which explored six major Communication Service Providers (AT&T, Verizon, Telefonica, SingTel, Vodafone and Ooredoo) in depth to determine their relative strengths and weaknesses and provide specific recommendations for them, their partners and the industry overall.

But Telefonica’s Q1 2014 results were even worse than recent ones from two other European players, Deutsche Telekom and Orange, which both posted revenue declines of 4%.  Telefonica’s Group revenue came in at €12.2 billion which was down 12% on Q1 2013.  Part of this was a result of the disposal of the Czech subsidiary and weaker currencies in Latin America, in which around 50% of revenue is generated.  Nevertheless, the negative trend for Telefonica and other European players is clear.

As the first chart in Figure 1 shows, Telefonica’s revenues have followed a gentle parabola over the last eight years.  They rose from 2006 to 2010, reaching a peak in Q4 of that year, before declining steadily to leave the company in Q1 2014 back where it started in Q1 2006.

The second chart, however, adds more insight.  It shows the year-on-year percentage growth or decline in revenue for each quarter.  It is clear that between 2006 and 2008 revenue growth was already slowing down and, following the 2008 economic crisis in which Spain (which generates around quarter of Telefonica’s revenue) was hit particularly hard, the company’s revenue declined in 2009.  The economic recovery that followed enabled Telefonica to report growth again in 2010 and 2011 before the underlying structural challenges of the telecoms industry – the decline of voice and messaging – kicked in, resulting in revenue decline since 2012.

Figure 1: Telefonica’s growth and decline over the last 8 years

Telco 2.0 Telefonica Group Revenue

Source: Telefonica, STL Partners analysis

One thing is clear: the only way is down for most CSPs and for the industry overall

The biggest concern for Telefonica and something that STL Partners believes will be replicated in other CSPs over the next few years is the accelerating nature of the decline since the peak.  It seems clear that Telco 1.0 revenues are not going to decline in a steady fashion but, once they reach a tipping point, to tumble away quickly as:

  • Substitute voice and messaging products and alternate forms of communication scale;
  • CSPs fight hard to maintain customers, revenue and share in voice, messaging and data products, via attractive bundles

The results of the European CSPs confirms STL Partners belief that the outlook for the global industry in the next few years is negative overall.  It is clear that telecoms industry maturity is at different stages globally:

  • Europe: in decline
  • US: still growing but very close to the peak
  • Africa, Middle East, Latin America: slowing growth but still 2(?) years before peak
  • Asia: mixed, some markets growing, others in decline

Given these different mixes, STL Partners reaffirms its forecast of 2012 that overall the industry will contract by up to 10% between 2013 and 2017 as core Telco 1.0 service revenue decline accelerates once more and more countries get beyond the peak.  This is illustrated for the mobile industry in Figure 2, below.

Figure 2: Near-term global telecoms decline is assured; longer-term growth is dependent on management actions now

Global mobile telcoms revenue

Source: STL Partners

Upturn in telecoms industry fortunes after 2016 dependent on current activities

If the downturn to 2016 is a virtual certainty, the shape of the recovery beyond this, which STL Partners (tentatively) forecasts, is not. The industry’s fortunes could be much better or worse than the forecast owing to the importance of transformation activities which all players (CSPs, Network Equipment Providers, IT players, etc.) need to make now.

The growth of what we have termed Human Data (personal data for consumers and business customers, including some aspects of Enterprise Mobility), Non-Human Data (connection of devices and applications – Internet of Things, Machine2Machine, Infrastructure as a Service, and some Enterprise Mobility) and Digital Services (end-user and B2B2X enabling applications and services) requires CSPs and their partners to develop new skills, assets, partnerships, customer relationships and operating and financial models – a new business model.

As IBM found in moving from being hardware manufacturer to a services player during the 1990’s, transforming the business model is hard.  IBM was very close to bankruptcy in the early 90’s before disrupting itself and re-emerging as a dominant force again in recent years.  CSPs and NEPs, in particular, are now seeking to do the same and must act decisively from 2013-2016 if they are to enjoy a rebirth rather than continued and sustained decline.