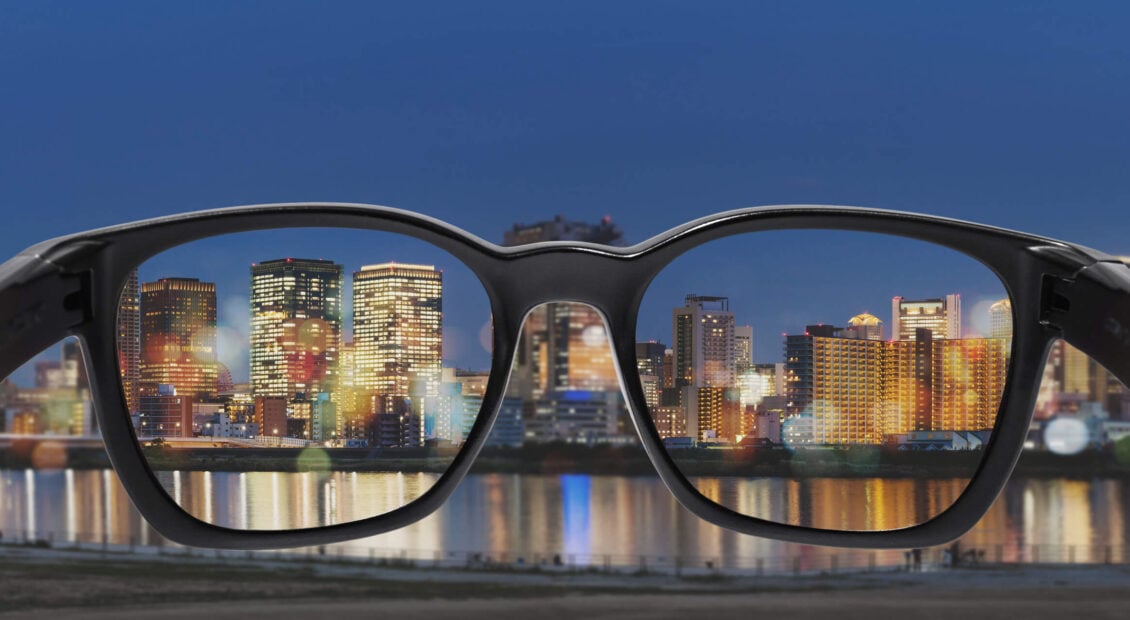
Why B2B marketplace sits at the heart of a thriving ecosystem

B2B Marketplaces: A key enabler for new growth

What is a B2B marketplace?

At its core, a marketplace is an entity through which buyers and sellers can effectively and efficiently transact. It provides a platform to reduce friction for the provisioning of products, services, and solutions: connecting a distributed ecosystem of suppliers with an equally distributed ecosystem of customers.

Think of Amazon, which orchestrates a B2C retail marketplace – Amazon’s marketplace has created a site in which a host of different vendors, whether regional or global, major corporate or small/medium enterprise (SME), can compete directly with one another (and in some cases directly with Amazon’s own products) to reach and serve a wide scale customer base. Using the example of Amazon, we can therefore describe four key actors within the marketplace:

Key actors in a marketplace

B2B marketplace

Enter your details below to request an extract of the report

  • Customers: Amazon’s marketplace creates a simple tool through which users can seamlessly identify, evaluate, and purchase products from a wider range of sellers. These suppliers, due to competition, must continuously innovate to create value for customers or risk competing solely on price. This provides a strong proposition combining ease, choice, and value for the customer. For smaller enterprises and for more simple services (e.g. cybersecurity, productivity software) a B2C-style marketplace works well. Amazon provides a good example of a B2C marketplace – however, for larger enterprises requiring more complex, verticalised solutions, the Amazon “one click purchasing” capability may be less appropriate.
    The marketplace still acts as an entity within which enterprises can identify new, innovative, solution providers and evaluate different components/vendors but may act more as a discovery mechanism – it generates a customer lead for suppliers and a vendor lead for customers. The customer will go on to engage directly with a sales team or representative within the vendor, rather than purchasing and spinning up the service directly through the marketplace. This is because the solution sales cycle is complex and requires a deep knowledge of the end customer and vertical specific expertise. To generate revenue, the orchestrator in this situation would have to create a comparative tool pricing for the use of these larger players.
    Particularly for more fragmented industries with a significant number of SMEs, offering pre-integrated, out-of-the-box solutions still offers the orchestrator a strong revenue opportunity.
  • Suppliers: In the context of B2B, suppliers in the marketplace may offer holistic vertical solutions including end devices, connectivity, applications, infrastructure etc. or sell those capabilities as individual components. Through participation in the marketplace, these vendors gain a strong distribution channel to sell their solution. Furthermore, they can get to market with solutions much faster than a more traditional, vertically integrated route, which would require longer cycles of integration and testing between partners, more investment in marketing & sales engines, and the need to repeat the process with each channel/solution partner identified.
    It also acts as a platform through which to learn more about competitors, identify or even engage potential partners, and understand more about their end customer needs and drivers. The marketplace can therefore act as a tangible entity around which the supply side ecosystem can innovate. This is through varying levels of data and insights, collected through the marketplace, which the orchestrator may allow certain suppliers to access.
  • Orchestrators: Orchestrators help coordinate the underlying community of suppliers and customers, defining the dimensions of the marketplace (which we will discuss further in a later section of the report). They set the parameters and objectives of the marketplace (e.g. which suppliers to onboard to the marketplace and how, which customers to target), and bring additional value to suppliers and customers through insights, supplier and customer experience, and marketing and sales engines to build scale.
    As the orchestrator of the ecosystem, Amazon has leveraged these supply and demand side benefits to grow into the retail giant that we know today. It has successfully driven a flywheel to build scale with suppliers and customers, and subsequently monetised this scale through a variety of different revenue streams – we will discuss these further later in the report.

The Amazon flywheel for marketplace success

B2B marketplace

  • Enablers: For a marketplace to function smoothly, a flexible but resilient backbone of support systems is required. This includes everything from billing, to authentication, onboarding, fulfilment, delivery, settlement, etc. A digital marketplace can automate many of these functions, diminishing the friction of interaction between partners, vendors, and customers.
    Oftentimes, these enablement services will be managed by an orchestrator who has complete oversight of the marketplace. Going back to the example of Amazon, Amazon not only orchestrates the marketplace but provides enablement services to capture additional value and revenue streams. This is in slight contrast, for example, to Ebay, which orchestrates the marketplace between different sellers, but is less involved in the delivery and fulfilment of the order. There is, therefore, nuance around how much of a role the orchestrator may take in the marketplace, and whether they partner to deliver enabling capabilities or completely outsource them to others. Enablers are, however, essential for a functioning marketplace and drive simplicity and stickiness for all actors. 

In summary, the marketplace brings opportunities to each of the actors within it and helps galvanise a diverse and fragmented ecosystem around a tangible construct. It enables customers to reach new suppliers, suppliers to reach new customers as well as engage new partners, and the orchestrators and enablers to drive new streams of revenue growth.

Table of Contents

  • Executive Summary
  • B2B Marketplaces: A key enabler for new growth
    • What is a B2B marketplace?
  • Marketplaces as a B2B growth driver
  • The dimensions of a successful B2B marketplace in healthcare
    • Due to the need for solution certification, a healthcare marketplace will remain more closed and centrally controlled
    • The healthcare marketplace will encourage participants to collaborate while excluding competitors…at first
    • Telcos should create value in the marketplace by driving biodiversity
    • Telcos have the capacity to collect valuable customer data insights but must first develop their capabilities
  • The guiding principles for building a marketplace: Where telcos should start
  • Index

Related Research

Enter your details below to request an extract of the report

Are telcos smart enough to make money work?

Telco consumer financial services propositions

Telcos face a perplexing challenge in consumer markets. On the one hand, telcos’ standing with consumers has improved through the COVID-19 pandemic, and demand for connectivity is strong and continues to grow. On the other hand, most consumers are not spending more money with telcos because operators have yet to create compelling new propositions that they can charge more for. In the broadest sense, telcos need to (and can in our view) create more value for consumers and society more generally.

Download the report extract

As discussed in our previous research, we believe the world is now entering a “Coordination Age” in which multiple stakeholders will work together to maximize the potential of the planet’s natural and human resources. New technologies – 5G, analytics, AI, automation, cloud – are making it feasible to coordinate and optimise the allocation of resources in real-time. As providers of connectivity that generates vast amounts of relevant data, telcos can play an important role in enabling this coordination. Although some operators have found it difficult to expand beyond connectivity, the opportunity still exists and may actually be expanding.

In this report, we consider how telcos can support more efficient allocation of capital by playing in the financial services sector.  Financial services (banking) sits in a “sweet spot” for operators: economies of scale are available at a national level, connected technology can change the industry.

Financial Services in the Telecoms sweet spot

financial services

Source STL Partners

The financial services industry is undergoing major disruption brought about by a combination of digitisation and liberalisation – new legislation, such as the EU’s Payment Services Directive, is making it easier for new players to enter the banking market. And there is more disruption to come with the advent of digital currencies – China and the EU have both indicated that they will launch digital currencies, while the U.S. is mulling going down the same route.

A digital currency is intended to be a digital version of cash that is underpinned directly by the country’s central bank. Rather than owning notes or coins, you would own a deposit directly with the central bank. The idea is that a digital currency, in an increasingly cash-free society, would help ensure financial stability by enabling people to store at least some of their money with a trusted official platform, rather than a company or bank that might go bust. A digital currency could also make it easier to bring unbanked citizens (the majority of the world’s population) into the financial system, as central banks could issue digital currencies directly to individuals without them needing to have a commercial bank account. Telcos (and other online service providers) could help consumers to hold digital currency directly with a central bank.

Although the financial services industry has already experienced major upheaval, there is much more to come. “There’s no question that digital currencies and the underlying technology have the potential to drive the next wave in financial services,” Dan Schulman, the CEO of PayPal told investors in February 2021. “I think those technologies can help solve some of the fundamental problems of the system. The fact that there’s this huge prevalence and cost of cash, that there’s lack of access for so many parts of the population into the system, that there’s limited liquidity, there’s high friction in commerce and payments.”

In light of this ongoing disruption, this report reviews the efforts of various operators, such as Orange, Telefónica and Turkcell, to expand into consumer financial services, notably the provision of loans and insurance. A close analysis of their various initiatives offers pointers to the success criteria in this market, while also highlighting some of the potential pitfalls to avoid.

Table of contents

  • Executive Summary
  • Introduction
  • Potential business models
    • Who are you serving?
    • What are you doing for the people you serve?
    • M-Pesa – a springboard into an array of services
    • Docomo demonstrates what can be done
    • But the competition is fierce
  • Applying AI to lending and insurance
    • Analysing hundreds of data points
    • Upstart – one of the frontrunners in automated lending
    • Takeaways
  • From payments to financial portal
    • Takeaways
  • Turkcell goes broad and deep
    • Paycell has a foothold
    • Consumer finance takes a hit
    • Regulation moving in the right direction
    • Turkcell’s broader expansion plans
    • Takeaways
  • Telefónica targets quick loans
    • Growing competition
    • Elsewhere in Latin America
    • Takeaways
  • Momentum builds for Orange
    • The cost of Orange Bank
    • Takeaways
  • Conclusions and recommendations
  • Index

This report builds on earlier STL Partners research, including:

Download the report extract

Fixed wireless access growth: To 20% homes by 2025

=======================================================================================

Download the additional file on the left for the PPT chart pack accompanying this report

=======================================================================================

Fixed wireless access growth forecast

Fixed Wireless Access (FWA) networks use a wireless “last mile” link for the final connection of a broadband service to homes and businesses, rather than a copper, fibre or coaxial cable into the building. Provided mostly by WISPs (Wireless Internet Service Providers) or mobile network operators (MNOs), these services come in a wide range of speeds, prices and technology architectures.

Some FWA services are just a short “drop” from a nearby pole or fibre-fed hub, while others can work over distances of several kilometres or more in rural and remote areas, sometimes with base station sites backhauled by additional wireless links. WISPs can either be independent specialists, or traditional fixed/cable operators extending reach into areas they cannot economically cover with wired broadband.

There is a fair amount of definitional vagueness about FWA. The most expansive definitions include cheap mobile hotspots (“Mi-Fi” devices) used in homes, or various types of enterprise IoT gateway, both of which could easily be classified in other market segments. Most service providers don’t give separate breakouts of deployments, while regulators and other industry bodies report patchy and largely inconsistent data.

Our view is that FWA is firstly about providing permanent broadband access to a specific location or premises. Primarily, this is for residential wireless access to the Internet and sometimes typical telco-provided services such as IPTV and voice telephony. In a business context, there may be a mix of wireless Internet access and connectivity to corporate networks such as VPNs, again provided to a specific location or building.

A subset of FWA relates to M2M usage, for instance private networks run by utility companies for controlling grid assets in the field. These are typically not Internet-connected at all, and so don’t fit most observers’ general definition of “broadband access”.

Usually, FWA will be marketed as a specific service and package by some sort of network provider, usually including the terminal equipment (“CPE” – customer premise equipment), rather than allowing the user to “bring their own” device. That said, lower-end (especially 4G) offers may be SIM-only deals intended to be used with generic (and unmanaged) portable hotspots.
There are some examples of private network FWA, such as a large caravan or trailer park with wireless access provided from a central point, and perhaps in future municipal or enterprise cellular networks giving fixed access to particular tenant structures on-site – for instance to hangars at an airport.

Enter your details below to request an extract of the report

FWA today

Today, fixed-wireless access (FWA) is used for perhaps 8-9% of broadband connections globally, although this varies significantly by definition, country and region. There are various use cases (see below), but generally FWA is deployed in areas without good fixed broadband options, or by mobile-only operators trying to add an additional fixed revenue stream, where they have spare capacity.

Fixed wireless internet access fits specific sectors and uses, rather than the overall market

FWA Use Cases

Source: STL Partners

FWA has traditionally been used in sparsely populated rural areas, where the economics of fixed broadband are untenable, especially in developing markets without existing fibre transport to towns and villages, or even copper in residential areas. Such networks have typically used unlicensed frequency bands, as there is limited interference – and little financial justification for expensive spectrum purchases. In most cases, such deployments use proprietary variants of Wi-Fi, or its ill-fated 2010-era sibling WiMAX.

Increasingly however, FWA is being used in more urban settings, and in more developed market scenarios – for example during the phase-out of older xDSL broadband, or in places with limited or no competition between fixed-network providers. Some cellular networks primarily intended for mobile broadband (MBB) have been used for fixed usage as well, especially if spare capacity has been available. 4G has already catalysed rapid growth of FWA in numerous markets, such as South Africa, Japan, Sri Lanka, Italy and the Philippines – and 5G is likely to make a further big difference in coming years. These mostly rely on licensed spectrum, typically the national bands owned by major MNOs. In some cases, specific bands are used for FWA use, rather than sharing with normal mobile broadband. This allows appropriate “dimensioning” of network elements, and clearer cost-accounting for management.

Historically, most FWA has required an external antenna and professional installation on each individual house, although it also gets deployed for multi-dwelling units (MDUs, i.e. apartment blocks) as well as some non-residential premises like shops and schools. More recently, self-installed indoor CPE with varying levels of price and sophistication has helped broaden the market, enabling customers to get terminals at retail stores or delivered direct to their home for immediate use.

Looking forward, the arrival of 5G mass-market equipment and larger swathes of mmWave and new mid-band spectrum – both licensed and unlicensed – is changing the landscape again, with the potential for fibre-rivalling speeds, sometimes at gigabit-grade.

Enter your details below to request an extract of the report

Table of contents

  • Executive Summary
  • Introduction
    • FWA today
    • Universal broadband as a goal
    • What’s changed in recent years?
    • What’s changed because of the pandemic?
  • The FWA market and use cases
    • Niche or mainstream? National or local?
    • Targeting key applications / user groups
  • FWA technology evolution
    • A broad array of options
    • Wi-Fi, WiMAX and close relatives
    • Using a mobile-primary network for FWA
    • 4G and 5G for WISPs
    • Other FWA options
    • Customer premise equipment: indoor or outdoor?
    • Spectrum implications and options
  • The new FWA value chain
    • Can MNOs use FWA to enter the fixed broadband market?
    • Reinventing the WISPs
    • Other value chain participants
    • Is satellite a rival waiting in the wings?
  • Commercial models and packages
    • Typical pricing and packages
    • Example FWA operators and plans
  • STL’s FWA market forecasts
    • Quantitative market sizing and forecast
    • High level market forecast
  • Conclusions
    • What will 5G deliver – and when and where?
  • Index

Reliance Jio: Learning from India’s problem solver

=======================================================================================

Download the additional file on the left for the PPT chart pack accompanying this report

=======================================================================================

Introduction

This year marks the 25th anniversary of mobile networks in India. The huge potential of the market has attracted many players (even as recently as 2016, there were 12 mobile operators in India). But most have had their fingers burned by the complexities of this market, as well as intense competition, particularly following the entry of Reliance Jio in September 2016.

In the past four years, Reliance Jio has gone from strength to strength, becoming the leading telco in terms of mobile subscriber numbers in December 2019, dramatically expanding internet access and driving adoption of digital services across the country. It is not an exaggeration to say that Jio played a major role in the digital transformation of India to date.

Evidence of Jio’s impact on the Indian market

Source: STL Partners

Jio leads Indian telecoms

By delivering broad societal progress and value, Jio has been able to overcome many of the regulatory and political challenges that have hindered other new entrants to the Indian telecoms market. Jio is in good standing as regards its future ambitions in the digital environment, helping it to attract over USD20 billion in investment between April and July 2020 from Facebook, Google and other international investors.

In India, Reliance Jio has trialled elements of a Coordination Age approach, setting out to solve various socio-economic problems by matching supply and demand, while moving up the value chain to unlock further sources of revenue growth.

At the time of Jio’s entry, India was still predominantly a 3G market, with voice calls being the main application. Although there were a multitude of plans on offer and the retail price per minute was among the lowest in the world, mobile communications remained out of reach for many (not helped by high license and spectrum fees that translated into upward pressure on pricing).

Reliance Industries recognised an opportunity to use the advent of 4G technology to build a data-first telecoms player that could support its wider aspirations to develop a globally competitive technology business in India. Accordingly, it obtained a nationwide license to operate a 4G network and encouraged take-up with a promotion that offered customers free voice calls forever.

The existing operators rushed to defend their market positions by dropping their prices resulting in a price war that destroyed value in the market and has led to consolidation and insolvencies such that, aside from Jio, only two privately-owned operators remain – with the real possibility that the market will shrink further and become a duopoly.

STL Partners covered the success of Jio’s disruptive market entry strategy in Telco-Driven Disruption: Will AT&T, Axiata, Reliance Jio and Turkcell succeed? report in 2017. This report considers Jio’s strategy in the context of the Coordination Age. It looks at what this has meant for the market and highlights the implications for operators in other developing markets.

Enter your details below to request an extract of the report

Table of Contents

  • Executive Summary
  • Introduction
  • Interventionist government shapes market
    • Mobile market overview
    • The shifting sands of policy
  • Jio overtakes the incumbents
  • The rise of Reliance Jio
    • Leveraging the strength of a conglomerate
    • Restructuring and renewal
  • Major emphasis on partnerships
    • Start-ups
    • Global technology partners
  • Competitor positions
    • Bharti Airtel faring better than Vodafone Idea
    • Competitors’ relationship with the government
  • Conclusions
    • Lessons for telcos in developing markets
  • Index

Enter your details below to request an extract of the report

Apple Glass: An iPhone moment for 5G?

Augmented reality supports many use cases across industries

Revisiting the themes explored in the AR/VR: Won’t move the 5G needle report STL Partners published in January 2018, this report explores whether augmented reality (AR) could become a catalyst for widespread adoption of 5G, as leading chip supplier Qualcomm and some telcos hope.

It considers how this technology is developing, its relationship with virtual reality (VR), and the implications for telcos trying to find compelling reasons for customers to use low latency 5G networks.

This report draws the following distinction between VR and AR

  • Virtual reality: use of an enclosed headset for total immersion in a digital3D
  • Augmented reality: superimposition of digital graphics onto images of the real world via a camera viewfinder, a pair of glasses or onto a screen fixed in real world.

In other words, AR is used both indoors and outdoors and on a variety of devices. Whereas Wi-Fi/fibre connectivity will be the preferred connectivity option in many scenarios, 5G will be required in locations lacking high-speed Wi-Fi coverage.  Many AR applications rely on responsive connectivity to enable them to interact with the real world. To be compelling, animated images superimposed on those of the real world need to change in a way that is consistent with changes in the real world and changes in the viewing angle.

AR can be used to create innovative games, such as the 2016 phenomena Pokemon Go, and educational and informational tools, such as travel guides that give you information about the monument you are looking at.  At live sports events, spectators could use AR software to identify players, see how fast they are running, check their heart rates and call up their career statistics.

Note, an advanced form of AR is sometimes referred to as mixed reality or extended reality (XR). In this case, fully interactive digital 3D objects are superimposed on the real world, effectively mixing virtual objects and people with physical objects and people into a seamless interactive scene. For example, an advanced telepresence service could project a live hologram of the person you are talking to into the same room as you. Note, this could be an avatar representing the person or, where the connectivity allows, an actual 3D video stream of the actual person.

Widespread usage of AR services will be a hallmark of the Coordination Age, in the sense that they will bring valuable information to people as and when they need it. First responders, for example, could use smart glasses to help work their way through smoke inside a building, while police officers could be immediately fed information about the owner of a car registration plate. Office workers may use smart glasses to live stream a hologram of a colleague from the other side of the world or a 3D model of a new product or building.

In the home, both AR and VR could be used to generate new entertainment experiences, ranging from highly immersive games to live holograms of sports events or music concerts. Some people may even use these services as a form of escapism, virtually inhabiting alternative realities for several hours a day.

Given sufficient time to develop, STL Partners believes mixed-reality services will ultimately become widely adopted in the developed world. They will become a valuable aid to everyday living, providing the user with information about whatever they are looking at, either on a transparent screen on a pair of glasses or through a wireless earpiece. If you had a device that could give you notifications, such as an alert about a fast approaching car or a delay to your train, in your ear or eyeline, why wouldn’t you want to use it?

How different AR applications affect mobile networks

One of the key questions for the telecoms industry is how many of these applications will require very low latency, high-speed connectivity. The transmission of high-definition holographic images from one place to another in real time could place enormous demands on telecoms networks, opening up opportunities for telcos to earn additional revenues by providing dedicated/managed connectivity at a premium price. But many AR applications, such as displaying reviews of the restaurant a consumer is looking at, are unlikely to generate much data traffic. the figure below lists some potential AR use cases and indicates how demanding they will be to support.

Examples of AR use cases and the demands they make on connectivity


Source: STL Partners

Although telcos have always struggled to convince people to pay a premium for premium connectivity, some of the most advanced AR applications may be sufficiently compelling to bring about this kind of behavioural shift, just as people are prepared to pay more for a better seat at the theatre or in a sports stadium. This could be on a pay-as-you-go or a subscription basis.

Enter your details below to request an extract of the report

The pioneers of augmented reality

Augmented reality (AR) is essentially a catch-all term for any application that seeks to overlay digital information and images on the real-world. Applications of AR can range from a simple digital label to a live 3D holographic projection of a person or event.

AR really rose to prominence at the start of the last decade with the launch of smartphone apps, such as Layar, Junaio, and Wikitude, which gave you information about what you were looking at through the smartphone viewfinder. These apps drew on data from the handset’s GPS chip, its compass and, in some cases, image recognition software to try and figure out what was being displayed in the viewfinder. Although they attracted a lot of media attention, these apps were too clunky to break through into the mass-market. However, the underlying concept persists – the reasonably popular Google Lens app enables people to identify a product, plant or animal they are looking at or translate a menu into their own language.

Perhaps the most high profile AR application to date is Niantic’s Pokemon Go, a smartphone game that superimposes cartoon monsters on images of the real world captured by the user’s smartphone camera. Pokemon Go generated $1 billion in revenue globally just seven months after its release in mid 2016, faster than any other mobile game, according to App Annie. It has also shown remarkable staying power. Four years later, in May 2020, Pokemon Go continued to be one of the top 10 grossing games worldwide, according to SensorTower.

In November 2017, Niantic, which has also had another major AR hit with sci-fi game Ingress, raised $200 million to boost its AR efforts. In 2019, it released another AR game based on the Harry Potter franchise.

Niantic is now looking to use its AR expertise to create a new kind of marketing platform. The idea is that brands will be able to post digital adverts and content in real-world locations, essentially creating digital billboards that are viewable to consumers using the Niantic platform. At the online AWE event in May 2020, Niantic executives claimed “AR gamification and location-based context” can help businesses increase their reach, boost user sentiment, and drive foot traffic to bricks-and-mortar stores. Niantic says it is working with major brands, such as AT&T, Simon Malls, Starbucks, Mcdonalds, and Samsung, to develop AR marketing that “is non-intrusive, organic, and engaging.”

The sustained success of Pokemon Go has made an impression on the major Internet platforms. By 2018, the immediate focus of both Apple and Google had clearly shifted from VR to AR. Apple CEO Tim Cook has been particularly vocal about the potential of AR. And he continues to sing the praises of the technology in public.

In January 2020, for example, during a visit to Ireland, Cook described augmented reality as the “next big thing.”  In an earnings call later that month, Cook added:When you look at AR today, you would see that there are consumer applications, there are enterprise applications. … it’s going to pervade your life…, because it’s going to go across both business and your whole life. And I think these things will happen in parallel.”

Both Apple and Google have released AR developer tools, helping AR apps to proliferate in both Apple’s App Store and on Google Play.  One of the most popular early use cases for AR is to check how potential new furniture would look inside a living room or a bedroom. Furniture stores and home design companies, such as Ikea, Wayfair and Houzz, have launched their own AR apps using Apple’s ARKit. Once the app is familiar with its surroundings, it allows the user to overlay digital models of furniture anywhere in a room to see how it will fit. The technology can work in outdoor spaces as well.

In a similar vein, there are various AR apps, such as MeasureKit, that allow you to measure any object of your choosing. After the user picks a starting point with a screen tap, a straight line will measure the length until a second tap marks the end. MeasureKit also claims to be able to calculate trajectory distances of moving objects, angle degrees, the square footage of a three-dimensional cube and a person’s height.

Table of contents

  • Executive Summary
    • More mainstream models from late 2022
    • Implications and opportunities for telcos
  • Introduction
  • Progress and Immediate Prospects
    • The pioneers of augmented reality
    • Impact of the pandemic
    • Snap – seeing the world differently
    • Facebook – the keeper of the VR flame
    • Google – the leader in image recognition
    • Apple – patiently playing the long game
    • Microsoft – expensive offerings for the enterprise
    • Amazon – teaming up with telcos to enable AR/VR
    • Market forecasts being revised down
  • Telcos Get Active in AR
    • South Korea’s telcos keep trying
    • The global picture
  • What comes next?
    • Live 3D holograms of events
    • Enhancing live venues with holograms
    • 4K HD – Simple, but effective
  • Technical requirements
    • Extreme image processing
    • An array of sensors and cameras
    • Artificial intelligence plays a role
    • Bandwidth and latency
    • Costs: energy, weight and financial
  • Timelines for Better VR and AR
    • When might mass-market models become available?
    • Implications for telcos
    • Opportunities for telcos
  • Appendix: Societal Challenges
    • AR: Is it acceptable in a public place?
    • VR: health issues
    • VR and AR: moral and ethical challenges
    • AR and VR: What do consumers really want?
  • Index

Enter your details below to request an extract of the report

Telco ecosystems: How to make them work

The ecosystem business framework

The success of large businesses such as Microsoft, Amazon and Google as well as digital disrupters like Airbnb and Uber is attributed to their adoption of platform-enabled ecosystem business frameworks. Microsoft, Amazon and Google know how to make ecosystems work. It is their ecosystem approach that helped them to scale quickly, innovate and unlock value in opportunity areas where businesses that are vertically integrated, or have a linear value chain, would have struggled. Internet-enabled digital opportunity areas tend to be unsuited to the traditional business frameworks. These depend on having the time and the ability to anticipate needs, plan and execute accordingly.

As businesses in the telecommunications sector and beyond try to emulate the success of these companies and their ecosystem approach, it is necessary to clarify what is meant by the term “ecosystem” and how it can provide a framework for organising business.

The word “ecosystem” is borrowed from biology. It refers to a community of organisms – of any number of species – living within a defined physical environment.

A biological ecosystem

The components of a biological ecosystem

Source: STL Partners

A business ecosystem can therefore be thought of as a community of stakeholders (of different types) that exist within a defined business environment. The environment of a business ecosystem can be small or large.  This is also true in biology, where both a tree and a rainforest can equally be considered ecosystem environments.

The number of organisms within a biological community is dynamic. They coexist with others and are interdependent within the community and the environment. Environmental resources (i.e. energy and matter) flow through the system efficiently. This is how the ecosystem works.

Companies that adopt an ecosystem business framework identify a community of stakeholders to help them address an opportunity area, or drive business in that space. They then create a business environment (e.g. platforms, rules) to organise economic activity among those communities.  The environment integrates community activities in a complementary way. This model is consistent with STL Partners’ vision for a Coordination Age, where desired outcomes are delivered to customers by multiple parties acting together.

Enter your details below to request an extract of the report

Characteristics of business ecosystems that work

In the case of Google, it adopted an ecosystem approach to tackle the search opportunity. Its search engine platform provides the environment for an external stakeholder community of businesses to reach consumers as they navigate the internet, based on what consumers are looking for.

  • Google does not directly participate in the business-consumer transaction, but its platform reduces friction for participants (providing a good customer experience) and captures information on the exchange.

While Google leverages a technical platform, this is not a requirement for an ecosystem framework. Nespresso built an ecosystem around its patented coffee pod. It needed to establish a user-base for the pods, so it developed a business environment that included licensing arrangements for coffee machine manufacturers.  In addition, it provided support for high-end homeware retailers to supply these machines to end-users. It also created the online Nespresso Club for coffee aficionados to maintain demand for its product (a previous vertically integrated strategy to address this premium coffee-drinking niche had failed).

Ecosystem relevance for telcos

Telcos are exploring new opportunities for revenue. In many of these opportunities, the needs of the customer are evolving or changeable, budgets are tight, and time-to-market is critical. Planning and executing traditional business frameworks can be difficult under these circumstances, so ecosystem business frameworks are understandably of interest.

Traditional business frameworks require companies to match their internal strengths and capabilities to those required to address an opportunity. An ecosystem framework requires companies to consider where those strengths and capabilities are (i.e. external stakeholder communities). An ecosystem orchestrator then creates an environment in which the stakeholders contribute their respective value to meet that end. Additional end-user value may also be derived by supporting stakeholder communities whose products and services use, or are used with, the end-product or service of the ecosystem (e.g. the availability of third party App Store apps add value for end customers and drives demand for high end Apple iPhones). It requires “outside-in” strategic thinking that goes beyond the bounds of the company – or even the industry (i.e. who has the assets and capabilities, who/what will support demand from end-users).

Many companies have rushed to implement ecosystem business frameworks, but have not attained the success of Microsoft, Amazon or Google, or in the telco arena, M-Pesa. Telcos require an understanding of the rationale behind ecosystem business frameworks, what makes them work and how this has played out in other telco ecosystem implementations. As a result, they should be better able to determine whether to leverage this approach more widely.

Table of Contents

  • Executive Summary
  • The ecosystem business framework
  • Why ecosystem business frameworks?
    • Benefits of ecosystem business frameworks
  • Identifying ecosystem business frameworks
  • Telco experience with ecosystem frameworks
    • AT&T Community
    • Deutsche Telekom Qivicon
    • Telecom Infra Project (TIP)
    • GSMA Mobile Connect
    • Android
    • Lessons from telco experience
  • Criteria for successful ecosystem businesses
    • “Destination” status
    • Strong assets and capabilities to share
    • Dynamic strategy
    • Deep end-user knowledge
    • Participant stakeholder experience excellence
    • Continuous innovation
    • Conclusions
  • Next steps
    • Index

Enter your details below to request an extract of the report

New age, new control points?

Why control points matter

This executive briefing explores the evolution of control points – products, services or roles that give a company disproportionate power within a particular digital value chain. Historically, such control points have included Microsoft’s Windows operating system and Intel’s processor architecture for personal computers (PCs), Google’s search engine and Apple’s iPhone. In each case, these control points have been a reliable source of revenues and a springboard into other lucrative new markets, such as productivity software (Microsoft) server chips (Intel), display advertising (Google) and app retailing (Apple).

Although technical and regulatory constraints mean that most telcos are unlikely to be able to build out their own control points, there are exceptions, such as the central role of Safaricom’s M-Pesa service in Kenya’s digital economy. In any case, a thorough understanding of where new control points are emerging will help telcos identify what their customers most value in the digital ecosystem. Moreover, if they move early enough to encourage competition and/or appropriate regulatory intervention, telcos could prevent themselves, their partners and their customers from becoming too dependent on particular companies.

The emergence of Microsoft’s operating system as the dominant platform in the PC market left many of its “partners” struggling to eke out a profit from the sale of computer hardware. Looking forward, there is a similar risk that a company that creates a dominant artificial intelligence platform could leave other players in various digital value chains, including telcos, at their beck and call.

This report explores how control points are evolving beyond simple components, such as a piece of software or a microprocessor, to become elaborate vertically-integrated stacks of hardware, software and services that work towards a specific goal, such as developing the best self-driving car on the planet or the most accurate image recognition system in the cloud. It then outlines what telcos and their partners can do to help maintain a balance of power in the Coordination Age, where, crucially, no one really wants to be at the mercy of a “master coordinator”.

The report focuses primarily on the consumer market, but the arguments it makes are also applicable in the enterprise space, where machine learning is being applied to optimise specialist solutions, such as production lines, industrial processes and drug development. In each case, there is a danger that a single company will build an unassailable position in a specific niche, ultimately eliminating the competition on which effective capitalism depends.

Enter your details below to request an extract of the report

Control points evolve and shift

A control point can be defined as a product, service or solution on which every other player in a value chain is heavily dependent. Their reliance on this component means the other players in the value chain generally have to accept the terms and conditions imposed by the entity that owns the control point. A good contemporary example is Apple’s App Store – owners of Apple’s devices depend on the App Store to get access to software they need/want, while app developers depend on the App Store to distribute their software to the 1.4 billion Apple devices in active use. This pivotal position allows Apple to levy a controversial commission of 30% on software and digital content sold through the App Store.

But few control points last forever: the App Store will only continue to be a control point if consumers continue to download a wide range of apps, rather than interacting with online services through a web browser or another software platform, such as a messaging app. Recent history shows that as technology evolves, control points can be sidestepped or marginalised. For example, Microsoft’s Windows operating system and Internet Explorer browser were once regarded as key control points in the personal computing ecosystem, but neither piece of software is still at the heart of most consumers’ online experience.

Similarly, the gateway role of Apple’s App Store looks set to be eroded over time. Towards the end of 2018, Netflix — the App Store’s top grossing app — no longer allowed new customers to sign up and subscribe to the streaming service within the Netflix app for iOS across all global markets, according to a report by TechCrunch. That move is designed to cut out the expensive intermediary — Apple. Citing data compiled by Sensor Tower, the report said Netflix would have paid Apple US$256 million of the US$853 million grossed by its 2018 the Netflix iOS app, assuming a 30% commission for Apple (however, after the first year, Apple’s cut on subscription renewals is lowered to 15%).

TechCrunch noted that Netflix is following in the footsteps of Amazon, which has historically restricted movie and TV rentals and purchases to its own website or other “compatible” apps, instead of allowing them to take place through its Prime Video app for iOS or Android. In so doing, Amazon is preventing Apple or Google from taking a slice of its content revenues. Amazon takes the same approach with Kindle e-books, which also aren’t offered in the Kindle mobile app. Spotify has also discontinued the option to pay for its Premium service using Apple’s in-app payment system.

Skating ahead of the puck

As control points evolve and shift, some of today’s Internet giants, notably Alphabet, Amazon and Facebook, are skating where the puck is heading, acquiring the new players that might disrupt their existing control points. In fact, the willingness of today’s Internet platforms to spend big money on small companies suggests they are much more alert to this dynamic than their predecessors were. Facebook’s US$19 billion acquisition of messaging app WhatsApp, which has generated very little in the way of revenues, is perhaps the best example of the perceived value of strategic control points – consumers’ time and attention appears to be gradually shifting from traditional social into messaging apps, such as WhatsApp, or hybrid-services, such as Instagram, which Facebook also acquired.

In fact, the financial and regulatory leeway Alphabet, Amazon, Facebook and Apple enjoy (granted by long-sighted investors) almost constitutes another control point. Whereas deals by telcos and media companies tend to come under much tougher scrutiny and be restricted by rigorous financial modelling, the Internet giants are generally trusted to buy whoever they like.

The decision by Alphabet, the owner of Google, to establish its “Other Bets” division is another example of how today’s tech giants have learnt from the complacency of their predecessors. Whereas Microsoft failed to anticipate the rise of tablets and smart TVs, weakening its grip on the consumer computing market, Google has zealously explored the potential of new computing platforms, such as connected glasses, self-driving cars and smart speakers.

In essence, the current generation of tech leaders have taken Intel founder Andy Grove’s famous “only the paranoid survive” mantra to heart. Having swept away the old order, they realise their companies could also easily be side-lined by new players with new ways of doing things. Underlining this point, Larry Page, founder of Google, wrote in 2014:Many companies get comfortable doing what they have always done, making only incremental changes. This incrementalism leads to irrelevance over time, especially in technology, where change tends to be revolutionary, not evolutionary. People thought we were crazy when we acquired YouTube and Android and when we launched Chrome, but those efforts have matured into major platforms for digital video and mobile devices and a safer, popular browser.”

Table of contents

  • Executive Summary
  • Introduction
  • What constitutes a control point?
    • Control points evolve and shift
    • New kinds of control points
  • The big data dividend
    • Can incumbents’ big data advantage be overcome?
    • Data has drawbacks – dangers of distraction
    • How does machine learning change the data game?
  • The power of network effects
    • The importance of the ecosystem
    • Cloud computing capacity and capabilities
    • Digital identity and digital payments
  • The value of vertical integration
    • The machine learning super cycle
    • The machine learning cycle in action – image recognition
  • Tesla’s journey towards self-driving vehicles
    • Custom-made computing architecture
    • Training the self-driving software
    • But does Tesla have a sustainable advantage?
  • Regulatory checks and balances
  • Conclusions and recommendations

Enter your details below to request an extract of the report

Personal data: Treasure or trash?

Introduction

This report analyses how the Telefónica Group is looking to reshape the digital services market so that both telcos and individuals play a greater role in the management of personal data. Today, most Internet users share large amounts of personal information with the major online platforms: Google, Facebook, Amazon, Apple, Tencent and Alibaba. In many cases, this process is implicit and somewhat opaque – the subject of the personal data isn’t fully aware of what information they have shared or how it is being used. For example, Facebook users may not be aware that the social network tracks their location and can, in some cases, trace a link between offline purchases and its online advertising.

Beyond the tactical deployment of personal data to personalise their services and advertising, the major Internet players increasingly use behavioural data captured by their services to train machine learning systems how to perform specific tasks, such as identify the subject of an image or the best response to an incoming message. Over time, the development of this kind of artificial intelligence will enable much greater levels of automation saving both consumers and companies time and money.

Like many players in the digital economy and some policymakers, Telefónica is concerned that artificial intelligence will be subject to a winner-takes-all dynamic, ultimately stifling competition and innovation. The danger is that the leading Internet platforms’ unparalleled access to behavioural data will enable them to develop the best artificial intelligence systems, giving them an unassailable advantage over newcomers to the digital economy.

This report analyses Telefónica’s response to this strategic threat, as well as examining the actions of NTT DOCOMO, another telco that has sought to break the stranglehold of the Internet platforms on personal data. Finally, it considers whether Mint, a web service that has succeeded in persuading millions of Americans to share very detailed financial information, could be a model for telco’s personal data propositions.

As well as revisiting some of the strategic themes raised in STL Partners’ 2013 digital commerce strategy report, this report builds on the analysis in three recent STL Partners’ executive briefings that explore the role of telcos in digital commerce:

Enter your details below to request an extract of the report

var MostRecentReportExtractAccess = “Most_Recent_Report_Extract_Access”;
var AllReportExtractAccess = “All_Report_Extract_Access”;
var formUrl = “https://go.stlpartners.com/l/859343/2022-02-16/dg485”;
var title = encodeURI(document.title);
var pageURL = encodeURI(document.location.href);
document.write(‘‘);

In pursuit of personal cloud services

For the best part of a decade, STL Partners has been calling for telcos to give customers greater control over their personal data. In doing so, telcos could differentiate themselves from most of the major Internet players in the eyes of both consumers and regulators. But now, the entire digital economy is moving in this direction, partly because the new General Data Protection Regulation (GDPR) requires companies operating in the EU to give consumers more control and partly because of the outcry over the cavalier data management practices of some Internet players, particularly Facebook.

In a world in which everyone is talking about protecting personal data and privacy, is there still scope for telcos to differentiate themselves and strengthen their relationships with consumers?

In a strategy report published in October 2013, STL Partners argued that there were two major strategic opportunities for telcos in the digital commerce space:

  1. Real-time commerce enablement: The use of mobile technologies and services to optimise all aspects of commerce. For example, mobile networks can deliver precisely targeted and timely marketing and advertising to consumer’s smartphones, tablets, computers and televisions.
  2. Personal cloud: Act as a trusted custodian for individuals’ data and an intermediary between individuals and organisations, providing authentication services, digital lockers and other services that reduce the risk and friction in every day interactions. An early example of this kind of service is financial services web site Mint.com (profiled in this report). As personal cloud services provide personalised recommendations based on individuals’ authorised data, they could potentially engage much more deeply with consumers than the generalised decision-support services, such as Google, TripAdvisor, moneysavingexpert.com and comparethemarket.com, in widespread use today.

Back in October 2013, STL Partners saw those two opportunities as inter-related — they could be combined in a single platform. The report argued that telcos should start with mobile commerce, where they have the strongest strategic position, and then use the resulting data, customer relationships and trusted brand to expand into personal cloud services, which will require high levels of investment.

Today, telcos’ traction in mobile commerce remains limited — only a handful of telcos, such as Safaricom, Turkcell, KDDI and NTT Docomo, have really carved out a significant position in this space. Although most telcos haven’t been able or willing to follow suit, they could still pursue the personal cloud value proposition outlined in the 2013 report. For consumers, effective personal cloud services will save time and money. The ongoing popularity of web comparison and review services, such as comparethemarket.com, moneysavingexpert.com and TripAdvisor, suggests that consumers continue to turn to intermediaries to help through them cut through the “marketing noise” on the Internet. But these existing services provide limited personalisation and can’t necessarily join the dots across different aspects of an individual’s lives. For example, TripAdvisor isn’t necessarily aware that a user is a teacher and can only take a vacation during a school holiday.

STL Partners believes there is latent demand for trusted and secure online services that act primarily on behalf of individuals, providing tailored advice, information and offers. This kind of personal cloud could evolve into a kind of vendor relationship management service, using information supplied by the individual to go and source the most appropriate products and services.

The broker could analyse a combination of declared, observed and inferred data in a way that is completely transparent to the individual. This data should be used primarily to save consumers time and give them relevant information that will enrich their lives. Instead of just putting the spotlight on the best price, as comparison web sites do, personal cloud services should put the spotlight on the ‘right’ product or service for the individual.

Ideally, a mature personal cloud service will enrich consumers’ lives by enabling them to quickly discover products, services and places that are near perfect or perfect for them. Rather than having to conduct hours of research or settle for second-best, the individual should be able to use the service to find exactly the right product or service in a few minutes. For example, an entertainment service might alert you to a concert by an upcoming band that fits closely with your taste in music, while a travel site will know you like quiet, peaceful hotels with sea views and recommend places that meet that criteria.

As a personal cloud service will need to be as useful as possible to consumers, it will need to attract as many merchants and brands as possible. In 2013, STL Partners argued that telcos could do that by offering merchants and brands a low risk proposition: they will be able to register to have their products and services included in the personal cloud for free and they will only have to pay commission if the consumer actually purchases one of their products and services. In the first few years, in order to persuade merchants and brands to actually use the site the personal cloud will have to charge a very low commission and, in some cases, none at all.

Since October 2013, much has changed. But the personal cloud opportunity is still valid and some telcos continue to explore how they can get closer to consumers. One of the most prominent of these is Madrid-based Telefónica, which has operations in much of Europe and across Latin America. The next chapter outlines Telefónica’s strategy in the personal data domain.

Contents:

  • Executive Summary
  • Recommendations for telcos
  • Introduction
  • In pursuit of personal cloud services
  • Telefonica’s personal data strategy
  • Questioning the status quo
  • Backing blockchains
  • Takeaways
  • What is Telefónica actually doing?
  • The Aura personal assistant
  • Takeaways
  • Telefonica’s external bets
  • Investment in Wibson
  • Partnership with People.io
  • The Data Transparency Lab
  • Takeaways
  • Will Telefónica see financial benefits?
  • Takeaways
  • What can Telefónica learn from DOCOMO?
  • DOCOMO’s Evolving Strategy
  • Takeaways
  • Mint – a model for a telco personal data play?
  • Takeaways

Figures:

  • Figure 1: Telefónica’s tally of active users of the major apps
  • Figure 2: Telefónica’s view of digital market openness in Brazil
  • Figure 3: Investors’ valuation of Internet platforms implies long-term dominance
  • Figure 4: Key metrics for Telefónica’s four platforms
  • Figure 5: How Wibson intends to allow individuals to trade their data
  • Figure 6: Telefónica’s digital services business is growing steadily
  • Figure 7: Telefónica’s pay TV business continues to expand
  • Figure 8: DOCOMO’s Smart Life division has struggle to grow
  • Figure 9: NTT DOCOMO’s new strategy puts more emphasis on enablers
  • Figure 10: DOCOMO continues to pursue the concept of a personal assistant
  • Figure 11: DOCOMO is using personal data to enable new financial services
  • Figure 12: Mint provides users with advice on how to manage their money
  • Figure 13: Intuit sees Mint as a strategically important engagement tool

Enter your details below to request an extract of the report

var MostRecentReportExtractAccess = “Most_Recent_Report_Extract_Access”;
var AllReportExtractAccess = “All_Report_Extract_Access”;
var formUrl = “https://go.stlpartners.com/l/859343/2022-02-16/dg485”;
var title = encodeURI(document.title);
var pageURL = encodeURI(document.location.href);
document.write(‘‘);

RCS: Walking the commerce tightrope

Introduction

Thanks initially to WeChat in China and now Facebook in the west, mobile messaging is fast becoming a key platform for digital commerce, mounting a challenge to Google Search, Amazon’s Marketplace and other two-sided platforms.

As explained in our June 2016 report, Google/Telcos’ RCS: Dark Horse or Dead Horse?, many of the world’s largest telcos are working with Google to develop and deploy multimedia communications services using the RCS specification. Like SMS, RCS is intended to work across networks, be network-based and be the default mobile messaging service, but it also goes far beyond SMS, by supporting rich features, such as video calling, location sharing, group chat and file sharing.  Proponents of RCS believe it can ultimately offer greater reach, reliability, privacy and security than online messaging services, such as WhatsApp, Facebook Messenger and WeChat.

The rollout of RCS-based services was one of the strategic options explored in STL Partners’ April 2017 report, Consumer communications: Can telcos mount a comeback?, which made different recommendations for different kinds of telcos. It argued that strong incumbent telcos in markets where the Internet players are also strong, such as AT&T, Verizon, BT and Deutsche Telekom, should seek to differentiate their communications proposition through reliability, security, privacy and reach, while also embedding communications into other services.

Building on those two reports, this executive briefing analyses the progress of RCS over the past two years, considering the development of business tools for the specification, while outlining Facebook Messenger’s, WhatsApp’s and Apple’s simultaneous push into the market for so-called conversational commerce, in which messaging and transactions are increasingly interwoven. It concludes by updating the strengths, weaknesses, opportunities and threats (SWOT) analysis in the June 2016 report and the subsequent recommendations for telcos.

RCS: What has changed in the past two years?

New networks, more interoperability and rising usage

The RCS (Rich Communications Services) specification, the heir apparent to SMS, has been around for a decade. Whereas SMS’s functionality is limited by its usage of old-school mobile technology, RCS employs Internet protocols to provide a raft of features similar to those available from leading chat apps. However, up until now, RCS has had little impact on the mobile messaging market – WhatsApp, Facebook Messenger, WeChat, Apple’s iMessage and other chat apps have been accumulating hundreds of millions of users, diminishing the role of mobile operators in this key pillar of the communications market.

But RCS, which is steered by the GSMA, seems to be finally gaining some traction: In 2017, RCS launches almost doubled from 30 to 55 and have the potential to double again in 2018, according to the GSMA. In December 2017, for example, América Movil, Telefónica, Oi and AT&T launched RCS messaging services to subscribers across Latin America. Although it will only work on handsets running Android, GSMA Intelligence estimates approximately 60% of subscribers across the Latin American region will be able to get access to the RCS messaging service. América Movil and Telefónica also plan to launch RCS Messaging in the UK, Germany, Spain, Austria and Central and Eastern Europe. As a result of these launches, GSMA Intelligence expects the number of active monthly RCS users to grow to 350 million by the end of 2018, from 159 million at the start of the year. However, for a messaging service, daily active users are a far more important metric than monthly active users.

To support RCS, telcos either need to embed an Internet multimedia subsystem (IMS) into their networks or used a cloud-based system that sits outside the network. The latter option requires less upfront capex and enables a quicker deployment. In Latin America, the operators are using the Jibe RCS Cloud from Google and the Jibe RCS Hub, thereby ensuring interoperability so that subscribers can send RCS messages across networks. Subscribers from other networks connected to the hub will also be able to send RCS messages regardless of their geographic location. Operators’ RCS networks are also being interconnected in other parts of the Americas and Europe. América Móvil, Rogers Communications and Sprint have interconnected their networks across the Americas, while Deutsche Telekom, Telenor Group, Telia Company and Vodafone Group have interconnected in Europe, enabling subscribers in these regions to access advanced RCS across 22 networks in 17 countries.

Contents:

  • Executive Summary
  • Introduction
  • RCS: What has changed in the past two years?
  • New networks, more interoperability and rising usage
  • Consistency is king
  • Vodafone’s sustained support for RCS
  • Google is finally prioritising RCS
  • Android Messages overshadows Allo
  • Android device makers mostly on board
  • What will Apple do?
  • Competing for the business messaging market
  • Facebook pushes into business messaging
  • The Facebook brand loses its lustre
  • How will RCS fare in the business market?
  • Veon tries a different route
  • Conclusions and Recommendations

Figures:

  • Figure 1: Recommendations for telcos in mobile messaging
  • Figure 2: The companies supporting the RCS Universal Profile
  • Figure 3: RCS now has a feature set designed for business-to-person usage
  • Figure 4: Vodafone is using RCS to promote its new pet tracking service
  • Figure 5: The iPhone accounts for less than one-fifth of the smartphones in use today
  • Figure 6: The pros and cons of Apple’s strategic options for iMessage
  • Figure 7: SMS still leads the Internet-based services in some metrics
  • Figure 8:  Using Facebook Messenger to book an in-store appointment
  • Figure 9: Almost 1.5 billion people access Facebook every day
  • Figure 10: The emerging ecosystem around RCS messaging-as-a-platform
  • Figure 11: Next steps for telcos in all-IP communications
  • Figure 12: China Mobile’s SMS traffic per customer has stabilised
  • Figure 13: Messaging is generating less and less revenue for China Mobile

Making big beautiful: Multinational operators need the telco cloud

Telcos’ (economies of) scale in perspective

As a result of their wide regional or global footprints, multi-country operators typically generate tens of billions of USD in revenues. By this measure, telcos’ scale (as defined by their revenues) is indeed comparable with the likes of Google and Facebook (see Figure 2). However, we can consider scale through a different lens as well: defined by the number of users, it becomes evident that telcos are dwarfed relative to the large internet companies. When considering the number of users, the telecoms industry is more fragmented than the internet sector – resulting in the unfavourable comparison, since no one telco can achieve a similar customer-base.

The fragmented nature of the global telecommunications industry means that telcos tend to struggle to create so-called demand-side economies of scale. These economies of scale rely on network effects stemming from the value generated by having a large number of users. In such a case, there is both inherent value in the use of the service and value derived from other people’s use of the service.

Enter your details below to request an extract of the report

var MostRecentReportExtractAccess = “Most_Recent_Report_Extract_Access”;
var AllReportExtractAccess = “All_Report_Extract_Access”;
var formUrl = “https://go.stlpartners.com/l/859343/2022-02-16/dg485”;
var title = encodeURI(document.title);
var pageURL = encodeURI(document.location.href);
document.write(‘‘);

The big success of the internet giants can, in part, be attributed to significant network effects. Telcos, on the other hand, are in a tougher position. Partly this is due to the nature of the services they traditionally provide. Unlike the internet giants who can reach anyone around the world with an internet connection, telcos are have largely been limited to serving users in the countries in which they operate networks.
Despite this, large operators should – in theory – be well-equipped to create so-called supply-side economies of scale due to the sheer size of their business. With telecoms being a high fixed-costs business, the cost of providing telco services per customer falls as the number of customers increases.

Figure 2: Some telcos are big – but they are unable to create the same network effects as the internet giants

So, have these large multinational telcos managed to create scale effects? Unfortunately, we find rather sobering evidence to the contrary. Figure 3 shows that multi-country operators tend to underperform the industry average. Large European multi-country operators – such as Orange, Telefonica, Vodafone and Deutsche Telekom – all underperform the telco global average operating margin of 17%. On the other hand, large single-market operators, namely AT&T and Verizon, achieve margins above the global average.

Figure 3: European giants struggle to create economies of scale

Contents:

  • Executive Summary
  • Multinational telcos have struggled to create economies of scale
  • A Telco Cloud strategy can deliver scale economies for multinational operators
  • Introduction – Economies of scale in telecoms
  • International expansion has delivered a global footprint for some telcos
  • Telcos’ (economies of) scale in perspective
  • Multinational telcos need to revisit their approach to creating economies of scale
  • The dilemma of multinational telcos – can Telco Cloud help overcome it?
  • Telco Cloud: a brave new world?
  • The cost problem: multinational telcos need to create synergies across markets
  • The revenue problem: multinationals need to calibrate the right innovation model across markets
  • The traditional Opco-driven innovation has inherent problems
  • Centralisation of innovation isn’t the answer either
  • What is the right model for telcos?
  • Conclusions

Enter your details below to request an extract of the report

var MostRecentReportExtractAccess = “Most_Recent_Report_Extract_Access”;
var AllReportExtractAccess = “All_Report_Extract_Access”;
var formUrl = “https://go.stlpartners.com/l/859343/2022-02-16/dg485”;
var title = encodeURI(document.title);
var pageURL = encodeURI(document.location.href);
document.write(‘‘);

Telcos and GAFA: Dancing with the disruptors

Introduction

Across much of the world, the competing Internet ecosystems led by Amazon, Apple, Facebook and Google have come to dominate the consumer market for digital services. Even though most telcos continue to compete with these players in the service layer, it is now almost a necessity for operators to partner with one or more of these ecosystems in some shape or form.

This report begins by pinpointing the areas where telcos are most likely to partner with these players, drawing on examples as appropriate. In each case, it considers the nature of the partnership and the resulting value to the telco and to the Internet ecosystem. It also considers the longer-term, strategic implications of these partnerships and makes recommendations on how telcos can try to strengthen their negotiating position.

This research builds on the findings of the Digital Partnerships Benchmarking Study conducted between 26th September and 4th November 2016 by STL Partners and sponsored by AsiaInfo. That study involved a survey of 34 operators in Europe and Asia Pacific. It revealed that whereas almost all operators expected to grow their partnerships business in the future, they differed on how they expected to pursue this growth.

Approximately half (46%) of the operator respondents wanted to scale up and partner with a large number of digital players, while the other half (49%) wanted to focus in on a few strategic partnerships.  Those looking to partner with a large number of companies were primarily interested in generating new revenue streams or increasing customer relevance, while many of those who wanted to focus on a small number of partnerships also regarded increasing revenues from the core business as a main objective (see Figure 1).

Figure 1: The business objectives differ somewhat by partnership strategy

Source: Digital Partnerships Benchmarking Study conducted in late 2016 by STL Partners and sponsored by AsiaInfo

Respondents were also asked to rank the assets that an operator can bring to a partnership, both today and in the future. These ranks were converted into a normalized score (see Figure 2): A score of 100% in Figure 2 would indicate that all respondents placed that option in the top rank.

Figure 2: Operators regard their customer base as their biggest asset

Source: Digital Partnerships Benchmarking Study conducted in late 2016 by STL Partners and sponsored by AsiaInfo

Clearly, operators are aware that the size of their customer base is a significant asset, and they are optimistic that it is likely to remain so: it is overall the highest scoring asset both today and in the future.

In the future, the options around customer data (customer profiling, analytics and insights) are given higher scores (they move up the ranks). This suggests that operators believe that they will become better at exploiting their data-centric assets and – most significantly – that they will be able to monetize this in partnerships, and that these data-centric assets will have significant value.

The findings of the study confirm that most telcos believe they can bring significant and valuable assets to partnerships. This report considers how those assets can be used to strike mutually beneficial deals with the major Internet ecosystems. The next chapter explains why telcos and the leading Internet players need to co-operate with each other, despite their competition for consumers’ attention.

Contents:

  • Executive Summary
  • Strategic considerations
  • Delivering bigger, better entertainment
  • Improving customer experience
  • Extending and enhancing connectivity
  • Developing the networks of the future
  • Delivering cloud computing to enterprises
  • Introduction
  • Telcos and lnternet giants need each other
  • Delivering bigger, better entertainment
  • Content delivery networks
  • Bundling content and connectivity
  • Zero-rating content
  • Carrier billing
  • Content promotion
  • Apple and EE in harmony
  • Value exchange and takeaways
  • Improving the customer experience
  • Making mobile data stretch further
  • Off-peak downloads, offline viewing
  • Data plan awareness for apps
  • Fine-grained control for consumers
  • Value exchange and takeaways
  • Extending and enhancing connectivity
  • Subsea cable consortiums
  • Free public Wi-Fi services
  • MVNO Project Fi – branded by Google, enabled by telcos
  • Value exchange and takeaways
  • Developing the networks of the future
  • Software-defined networks: Google and the CORD project
  • Opening up network hardware: Facebook’s Telecom Infra Project
  • Value exchange and takeaways
  • Delivering cloud computing to enterprises
  • Reselling cloud-based apps
  • Secure cloud computing – AWS and AT&T join forces
  • Value exchange and takeaways
  • Conclusions and Recommendations
  • Google is top of mind
  • Whose brand benefits?

Figures:

  • Figure 1: The business objectives differ somewhat by partnership strategy
  • Figure 2: Operators regard their customer base as their biggest asset
  • Figure 3: US Internet giants generate about 40% of mobile traffic in Asia-Pacific
  • Figure 4: Google and Facebook are now major players in mobile in Africa
  • Figure 5: Examples of telco-Internet platform partnerships in entertainment
  • Figure 6: BT Sport uses YouTube to promote its premium content
  • Figure 7: Apple Music appears to have helped EE’s performance
  • Figure 8: Amazon is challenging Apple and Spotify in the global music market
  • Figure 9: Examples of telco-Google co-operation around transparency
  • Figure 10: YouTube Smart Offline could alleviate peak pressure on networks
  • Figure 11: Google’s Triangle app gives consumers fine-grained control over apps
  • Figure 12: Examples of telco-Internet platform partnerships to deliver connectivity
  • Figure 13: Project Fi’s operator partners provide extensive 4G coverage
  • Figure 14: Both T-Mobile US and Sprint need to improve their financial returns
  • Figure 15: Examples of telco-Internet platform partnerships on network innovation
  • Figure 16: AWS has a big lead in the cloud computing market
  • Figure 17: Examples of telco-Internet platform partnerships in enterprise cloud
  • Figure 18: AT&T provides private and secure connectivity to public clouds
  • Figure 19: Amazon and Alphabet lead corporate America in R&D
  • Figure 20: Telcos need to be wary of bolstering already powerful brands
  • Figure 21: Balancing immediate value of partnerships against strategic implications
  • Figure 22: Different telcos should adopt different strategies

The Open Source Telco: Taking Control of Destiny

Preface

This report examines the approaches to open source software – broadly, software for which the source code is freely available for use, subject to certain licensing conditions – of telecoms operators globally. Several factors have come together in recent years to make the role of open source software an important and dynamic area of debate for operators, including:

  • Technological Progress: Advances in core networking technologies, especially network functions virtualisation (NFV) and software-defined networking (SDN), are closely associated with open source software and initiatives, such as OPNFV and OpenDaylight. Many operators are actively participating in these initiatives, as well as trialling their software and, in some cases, moving them into production. This represents a fundamental shift away from the industry’s traditional, proprietary, vendor-procured model.
    • Why are we now seeing more open source activities around core communications technologies?
  • Financial Pressure: However, over-the-top (OTT) disintermediation, regulation and adverse macroeconomic conditions have led to reduced core communications revenues for operators in both developed and emerging markets alike. As a result, operators are exploring opportunities to move away from their core, infrastructure business, and compete in the more software-centric services layer.
    • How do the Internet players use open source software, and what are the lessons for operators?
  • The Need for Agility: In general, there is recognition within the telecoms industry that operators need to become more ‘agile’ if they are to succeed in the new, rapidly-changing ICT world, and greater use of open source software is seen by many as a key enabler of this transformation.
    • How can the use of open source software increase operator agility?

The answers to these questions, and more, are the topic of this report, which is sponsored by Dialogic and independently produced by STL Partners. The report draws on a series of 21 interviews conducted by STL Partners with senior technologists, strategists and product managers from telecoms operators globally.

Figure 1: Split of Interviewees by Business Area

Source: STL Partners

Introduction

Open source is less optional than it once was – even for Apple and Microsoft

From the audience’s point of view, the most important announcement at Apple’s Worldwide Developer Conference (WWDC) this year was not the new versions of iOS and OS X, or even its Spotify-challenging Apple Music service. Instead, it was the announcement that Apple’s highly popular programming language ‘Swift’ was to be made open source, where open source software is broadly defined as software for which the source code is freely available for use – subject to certain licensing conditions.

On one level, therefore, this represents a clever engagement strategy with developers. Open source software uptake has increased rapidly during the last 15 years, most famously embodied by the Linux operating system (OS), and with this developers have demonstrated a growing preference for open source tools and platforms. Since Apple has generally pushed developers towards proprietary development tools, and away from third-party ones (such as Adobe Flash), this is significant in itself.

An indication of open source’s growth can be found in OS market shares in consumer electronics devices. As Figure 2 shows below, Android (open source) had a 49% share of shipments in 2014; if we include the various other open source OS’s in ‘other’, this increases to more than 50%.

Figure 2: Share of consumer electronics shipments* by OS, 2014

Source: Gartner
* Includes smartphones, tablets, laptops and desktop PCs

However, one of the components being open sourced is Swift’s (proprietary) compiler – a program that translates written code into an executable program that a computer system understands. The implication of this is that, in theory, we could even see Swift applications running on non-Apple devices in the future. In other words, Apple believes the risk of Swift being used on Android is outweighed by the reward of engaging with the developer community through open source.

Whilst some technology companies, especially the likes of Facebook, Google and Netflix, are well known for their activities in open source, Apple is a company famous for its proprietary approach to both hardware and software. This, combined with similar activities by Microsoft (who open sourced its .NET framework in 2014), suggest that open source is now less optional than it once was.

Open source is both an old and a new concept for operators

At first glance, open source also appears to now be less optional for telecoms operators, who traditionally procure proprietary software (and hardware) from third-party vendors. Whilst many (but not all) operators have been using open source software for some time, such as Linux and various open source databases in the IT domain (e.g. MySQL), we have in the last 2-3 years seen a step-change in operator interest in open source across multiple domains. The following quote, taken directly from the interviews, summarises the situation nicely:

“Open source is both an old and a new project for many operators: old in the sense that we have been using Linux, FreeBSD, and others for a number of years; new in the sense that open source is moving out of the IT domain and towards new areas of the industry.” 

AT&T, for example, has been speaking widely about its ‘Domain 2.0’ programme. Domain 2.0 has the objectives to transform AT&T’s technical infrastructure to incorporate network functions virtualisation (NFV) and software-defined networking (SDN), to mandate a higher degree of interoperability, and to broaden the range of alternative suppliers available across its core business. By 2020, AT&T hopes to virtualise 75% of its network functions, and it sees open source as accounting for up to 50% of this. AT&T, like many other operators, is also a member of various recently-formed initiatives and foundations around NFV and SDN, such as OPNFV – Figure 3 lists some below.

Figure 3: OPNFV Platinum Members

Source: OPNFV website

However, based on publicly-available information, other operators might appear to have lesser ambitions in this space. As ever, the situation is more complex than it first appears: other operators do have significant ambitions in open source and, despite the headlines NFV and SDN draw, there are many other business areas in which open source is playing (or will play) an important role. Figure 4 below includes three quotes from the interviews which highlight this broad spectrum of opinion:

Figure 4: Different attitudes of operators to open source – selected interview quotes

Source: STL Partners interviews

Key Questions to be Addressed

We therefore have many questions which need to be addressed concerning operator attitudes to open source software, adoption (by area of business), and more:

  1. What is open source software, what are its major initiatives, and who uses it most widely today?
  2. What are the most important advantages and disadvantages of open source software? 
  3. To what extent are telecoms operators using open source software today? Why, and where?
  4. What are the key barriers to operator adoption of open source software?
  5. Prospects: How will this situation change?

These are now addressed in turn.

  • Preface
  • Executive Summary
  • Introduction
  • Open source is less optional than it once was – even for Apple and Microsoft
  • Open source is both an old and a new concept for operators
  • Key Questions to be Addressed
  • Understanding Open Source Software
  • The Theory: Freely available, licensed source code
  • The Industry: Dominated by key initiatives and contributors
  • Research Findings: Evaluating Open Source
  • Open source has both advantages and disadvantages
  • Debunking Myths: Open source’s performance and security
  • Where are telcos using open source today?
  • Transformation of telcos’ service portfolios is making open source more relevant than ever…
  • … and three key factors determine where operators are using open source software today
  • Open Source Adoption: Business Critical vs. Service Area
  • Barriers to Telco Adoption of Open Source
  • Two ‘external’ barriers by the industry’s nature
  • Three ‘internal’ barriers which can (and must) change
  • Prospects and Recommendations
  • Prospects: An open source evolution, not revolution
  • Open Source, Transformation, and Six Key Recommendations
  • About STL Partners and Telco 2.0
  • About Dialogic


  • Figure 1: Split of Interviewees by Business Area
  • Figure 2: Share of consumer electronics shipments* by OS, 2014
  • Figure 3: OPNFV Platinum Members
  • Figure 4: Different attitudes of operators to open source – selected interview quotes
  • Figure 5: The Open IT Ecosystem (incl. key industry bodies)
  • Figure 6: Three Forms of Governance in Open Source Software Projects
  • Figure 7: Three Classes of Open Source Software License
  • Figure 8: Web Server Share of Active Sites by Developer, 2000-2015
  • Figure 9: Leading software companies vs. Red Hat, market capitalisation, Oct. 2015
  • Figure 10: The Key Advantages and Disadvantages of Open Source Software
  • Figure 11: How Google Works – Failing Well
  • Figure 12: Performance gains from an open source activation (OSS) platform
  • Figure 13: Intel Hardware Performance, 2010-13
  • Figure 14: Open source is more likely to be found today in areas which are…
  • Figure 15: Framework mapping current telco uptake of open source software
  • Figure 16: Five key barriers to telco adoption of open source software
  • Figure 17: % of employees with ‘software’ in their LinkedIn job title, Oct. 2015
  • Figure 18: ‘Waterfall’ and ‘Agile’ Software Development Methodologies Compared
  • Figure 19: Four key cultural attributes for successful telco transformation

Amazon, Apple, Facebook, Google, Netflix: Whose digital content is king?

Introduction

This report analyses the market position and strategies of five global online entertainment platforms – Amazon, Apple, Facebook, Google and Netflix.

It also explores how improvements in digital technologies, consumer electronics and bandwidth are changing the online entertainment market, while explaining the ongoing uncertainty around net neutrality. The report then considers how well each of the five major entertainment platforms is prepared for the likely technological and regulatory changes in this market. Finally, it provides a high level overview of the implications for telco, paving the way for a forthcoming STL Partners report going into more detail about potential strategies for telcos in online entertainment.

The rise and rise of online entertainment

As in many other sectors, digital technologies are shaking up the global entertainment industry, giving rise to a new world order. Now that 3.2 billion people around the world have Internet access, according to the ITU, entertainment is increasingly delivered online and on-demand.

Mobile and online entertainment accounts for US$195 million (almost 11%) of the US$1.8 trillion global entertainment market today. By some estimates, that figure is on course to rise to more than 13% of the global entertainment market, which could be worth US$2.2 trillion in 2019.

Two leading distributors of online content – Google and Facebook – have infiltrated the top ten media owners in the world as defined by ZenithOptimedia (see Figure 1). ZenithOptimedia ranks media companies according to all the revenues they derive from businesses that support advertising – television broadcasting, newspaper publishing, Internet search, social media, and so on. As well as advertising revenues, it includes all revenues generated by these businesses, such as circulation revenues for newspapers or magazines. However, for pay-TV providers, only revenues from content in which the company sells advertising are included.

Figure 1 – How Google and Facebook differ from other leading media owners

Source: ZenithOptimedia, May 2015/STL Partners

ZenithOptimedia says this approach provides a clear picture of the size and negotiating power of the biggest global media owners that advertisers and agencies have to deal with. Note, Figure 1 draws on data from the financial year 2013, which is the latest year for which ZenithOptimedia had consistent revenue figures from all of the publicly listed companies. Facebook, which is growing fast, will almost certainly have climbed up the table since then.

Figure 1 also shows STL Partners’ view of the extent to which each of the top ten media owners is involved in the four key roles in the online content value chain. These four key roles are:

  1. Programme: Content creation. E.g. producing drama series, movies or live sports programmes.
  2. Package: Content curation. E.g. packaging programmes into channels or music into playlists and then selling these packages on a subscription basis or providing them free, supported by advertising.
  3. Platform: Content distribution. E.g. Distributing TV channels, films or music created and curated by another entity.
  4. Pipe: Providing connectivity. E.g. providing Internet access

Increasing vertical integration

Most of the world’s top ten media owners have traditionally focused on programming and packaging, but the rise of the Internet with its global reach has brought unprecedented economies of scale and scope to the platform players, enabling Google and now Facebook to break into the top ten. These digital disruptors earn advertising revenues by providing expansive two-sided platforms that link creators with viewers. However, intensifying competition from other major ecosystems, such as Amazon, and specialists, such as Netflix, is prompting Google, in particular, to seek new sources of differentiation. The search giant is increasingly investing in creating and packaging its own content.  The need to support an expanding range of digital devices and multiple distribution networks is also blurring the boundaries between the packaging and platform roles (see Figure 2, below) – platforms increasingly need to package content in different ways for different devices and for different devices.

Figure 2 – How the key roles in online content are changing

Source: STL Partners

These forces are prompting most of the major media groups, including Google and, to a lesser extent, Facebook, to expand across the value chain. Some of the largest telcos, including Verizon and BT, are also investing heavily in programming and packaging, as they seek to fend off competition from vertically-integrated media groups, such as Comcast and Sky (part of 21st Century Fox), who are selling broadband connectivity, as well as content.

In summary, the strongest media groups will increasingly create their own exclusive programming, package it for different devices and sell it through expansive distribution platforms that also re-sell third party content. These three elements feed of each other – the behavioural data captured by the platform can be used to improve the programming and packaging, creating a virtuous circle that attracts more customers and advertisers, generating economies of scale.

Although some leading media groups also own pipes, providing connectivity is less strategically important – consumers are increasingly happy to source their entertainment from over-the-top propositions. Instead of investing in networks, the leading media and Internet groups lobby regulators and run public relations campaigns to ensure telcos and cablecos don’t discriminate against over-the-top services. As long as these pipes are delivering adequate bandwidth and are sufficiently responsive, there is little need for the major media groups to become pipes.

The flip-side of this is that if telcos can convince the regulator and the media owners that there is a consumer and business benefit to differentiated network services (or discrimination to use the pejorative term), then the value of the pipe role increases. Guaranteed bandwidth or low-latency are a couple of the potential areas that telcos could potentially pursue here but they will need to do a significantly better job in lobbying the regulator and in marketing the benefits to consumers and the content owner/distributor if this strategy is to be successful.

To be sure, Google has deployed some fibre networks in the US and is now acting as an MVNO, reselling airtime on mobile networks in the US. But these efforts are part of its public relations effort – they are primarily designed to showcase what is possible and put pressure on telcos to improve connectivity rather than mount a serious competitive challenge.

  • Introduction
  • Executive Summary
  • The rise and rise of online entertainment
  • Increasing vertical integration
  • The world’s leading online entertainment platforms
  • A regional breakdown
  • The future of online entertainment market
  • 1. Rising investment in exclusive content
  • 2. Back to the future: Live programming
  • 3. The changing face of user generated content
  • 4. Increasingly immersive games and interactive videos
  • 5. The rise of ad blockers & the threat of a privacy backlash
  • 6. Net neutrality uncertainty
  • How the online platforms are responding
  • Conclusions and implications for telcos
  • STL Partners and Telco 2.0: Change the Game


  • Google is the leading generator of online entertainment traffic in most regions
  • How future-proof are the major online platforms?
  • Figure 1: How Google and Facebook differ from other leading media owners
  • Figure 2: How the key roles in online content are changing
  • Figure 3: Google leads in most regions in terms of entertainment traffic
  • Figure 4: YouTube serves up an eclectic mix of music videos, reality TV and animals
  • Figure 5: Facebook users recommend videos to one another
  • Figure 6: Apple introduces apps for television
  • Figure 7: Netflix, Google, Facebook and Amazon all gaining share in North America
  • Figure 8: YouTube & Facebook increasingly about entertainment, not interaction
  • Figure 9: YouTube maintains lead over Facebook on American mobile networks
  • Figure 10: US smartphones may be posting fewer images and videos to Facebook
  • Figure 11: Over-the-top entertainment is a three-way fight in North America
  • Figure 12: YouTube, Facebook & Netflix erode BitTorrent usage in Europe
  • Figure 13: File sharing falling back in Europe
  • Figure 14: iTunes cedes mobile share to YouTube and Facebook in Europe
  • Figure 15: Facebook consolidates strong upstream lead on mobile in Europe
  • Figure 16: YouTube accounts for about one fifth of traffic on Europe’s networks
  • Figure 17: YouTube & BitTorrent dominate downstream fixed-line traffic in Asia-Pac
  • Figure 18: Filesharing and peercasting apps dominate the upstream segment
  • Figure 19: YouTube stretches lead on mobile networks in Asia-Pacific
  • Figure 20: YouTube neck & neck with Facebook on upstream mobile in Asia-Pac
  • Figure 21: YouTube has a large lead in the Asia-Pacific region
  • Figure 22: YouTube fends off Facebook, as Netflix gains traction in Latam
  • Figure 23: How future-proof are the major online platforms?
  • Figure 24: YouTube’s live programming tends to be very niche
  • Figure 25: Netflix’s ranking of UK Internet service providers by bandwidth delivered
  • Figure 26: After striking a deal with Netflix, Verizon moved to top of speed rankings

Google’s MVNO: What’s Behind it and What are the Implications?

Google’s core business is under pressure

Google, the undisputed leader in online advertising and tech industry icon, has more problems than you might think. The grand narrative is captured in the following chart, showing basic annual financial metrics for Google, Inc. between 2009 and 2014.

Figure 1: Google’s margins have eroded substantially over time

Source: STL Partners, Google 10-K filing

This is essentially the classic problem of commoditisation. The IT industry has been structurally deflationary throughout its existence, which has always posed problems for its biggest successes – how do you maintain profitability in a business where prices only ever fall? Google is growing in terms of volume, but its margins are sliding, and as a result, profitability is growing much more slowly than revenue. Since 2010, the operating margin has shrunk from around 35% to around 25%, a period during which a major competitor emerged (Facebook) and Google initiated a variety of major investments, research projects, and flirted with manufacturing hardware (through the Motorola acquisition).

And it could get worse. In its most recent 10-K filing, Google says: “We anticipate downward pressure on our operating margin in the future.” It cites increasing competition and increased expenditures, while noting that it is becoming more reliant on lower margin products: “The margin on the sale of digital content and apps, advertising revenues from mobile devices and newer advertising formats are generally less than the margin on revenues we generate from advertising on our websites on traditional formats.”

Google remains massively dependent on a commoditising advertising business

Google is very, very dependent on selling advertising for revenue. It does earn some revenue from content, but most of this is generated from the ContentID program, which places adverts on copyrighted material and shares revenue with the rightsholder, and therefore, amounts to much the same thing. Over the past two years, Google has actually become more advert-dominated, as Figure 2 shows. Advertising revenues are not only vastly greater than non-advertising revenues, they are growing much faster and increasing as a share of the total. Over- reliance on the fickle and fast changing advertising market is obviously risky. Also, while ad brokering is considered a high-margin business, Google’s margins are now at the same level as AT&T’s.

Figure 2: Not only is Google overwhelmingly dependent on advertising, advertising revenue is growing faster than non-advertising

Source: STL Partners, Google 10-K

The growth rate of non-advertising revenue at Google has slowed sharply since last year. It is now growing more slowly than either advertising on Google properties, or in the Google affiliate network (see Figure 3).

Figure 3: Google’s new-line businesses are growing slower than the core business

Source: STL Partners, Google 10-K

At the same time, the balance has shifted a little between Google’s own properties (such as Google.com) and its affiliate network. Historically, more and more Google revenue has come from its own inventory and less from placing ads on partner sites. Costs arise from the affiliate network because Google pays out revenue share to the partner sites, known as traffic-acquisition costs or TACs. Own-account ad inventory, however, isn’t free – Google has to create products to place advertising in, and this causes it to incur R&D expenditures.

In a real sense, R&D is the equivalent to TAC for the 60-odd per cent of Google’s business that occurs on its own web sites. Google engineering excellence, and perhaps economies of scale, mean that generating ad inventory via product creation might be a better deal than paying out revenue share to hordes of bloggers or app developers, and Figure 4 shows this is indeed the case. R&D makes up a much smaller percentage of revenue from Google properties than TAC does of revenue from the affiliate network.

Figure 4: R&D is a more efficient means of generating ad inventory than affiliate payouts

Source: STL Partners, Google 10-K

Note, that although TAC might well be rising, the spike for Q4 2014 is probably a seasonal effect – Q4 is likely to be a month when a lot of adverts get clicked across the web.


  • Executive Summary
  • Google’s core business is under pressure
  • Google remains massively dependent on a commoditising advertising business
  • Google spends far more on R&D and capex than Apple
  • But while costs soar, Google ad pricing is falling
  • Google also has very high running costs
  • The threats from Facebook and Apple are real
  • Google MVNO: a strategic initiative
  • What do you need to make a mini-carrier?
  • The Google MVNO will launch into a state of price war
  • How low could the Google MVNO’s prices be?
  • Google’s MVNO: The Strategic Rationale
  • Option 1: Ads
  • Option 2: Straightforward carrier business model
  • Option 3: Android-style strategic initiative vs MNOs
  • Option 4: Anti-Apple virus, 2.0
  • Conclusions


  • Figure 1: Google’s margins have eroded substantially over time
  • Figure 2: Not only is Google overwhelmingly dependent on advertising, advertising revenue is growing faster than non-advertising
  • Figure 3: Growth in Google’s new-line businesses is now slower than in the core business
  • Figure 4: R&D is a more efficient means of generating ad inventory than affiliate payouts
  • Figure 5: Google spends a lot of money on research
  • Figure 6: Proportionately, Google research spending is even higher
  • Figure 7: Google’s dollar capex is almost identical to vastly bigger Apple’s
  • Figure 8: Google is startlingly capex-intensive compared to Apple, especially for an ad broker versus a global manufacturing titan
  • Figure 9: Google’s ad pricing is declining, and volume growth paused for most of 2014
  • Figure 10: Google is a more expensive company to run than Apple
  • Figure 11: The aircraft hangar Google leases from NASA
  • Figure 12: Facebook is pursuing quality over quantity in ad placement
  • Figure 12: Facebook is gradually closing the gap on Google in digital advertising
  • Figure 14: Despite a huge revenue quarter, Facebook’s Q4 saw a sharp hit to margin
  • Figure 15: Facebook’s margin hit is explained by the rise in R&D spending
  • Figure 16: Apple’s triumph – a terrible Q4 for the Android ecosystem
  • Figure 17: Price disruption in France and in the United States
  • Figure 18: Price disruption in the US – this is only the beginning
  • Figure 19: Defending AT&T and Verizon Wireless’ ARPU comes at a price
  • Figure 20: Modelling the service price of a mini-carrier
  • Figure 21: A high WiFi offload rate could make Google’s pricing aggressive
  • Figure 21: Handset subsidies are alive and well at T-Mobile


Digital Services: What is Your Digital Business Worth?

Introduction

When Hewlett Packard’s then-CEO (Carly Fiorina) defended HP’s infamous acquisition of Compaq in 2002, she offered a number of arguments as to why the deal made sense. Firstly, the combined entity would now be able to meet the demands of customers for “solutions on a truly global basis.” Secondly, she claimed that the firm would be able to offer products “from top to bottom, from low-end to high-end.” Lastly, but perhaps most importantly, the merger would generate “synergies that are compelling.”

‘Synergy’ is a straightforward concept: the interaction of two or more entities to produce a combined effect greater than the sum of their parts. Synergistic phenomena are ubiquitous in the natural world, ranging from physics (e.g. the building blocks of atoms), to genetics (e.g. the cooperative interactions among genes in genomes) and the synergies produced by socially-organised groups (e.g. the division of labour).

In the business world, ‘synergy’ refers to the value that is generated by combining two organisations to create a new, more valuable entity. Synergies here can be ‘operational’, such as the combination of functional strengths, or ‘financial’, such as tax benefits or diversification. Traditionally, however, investors have been deeply sceptical of synergies, in terms of both their existence and the ability of M&A activity to deliver them. This was the case with the HP-Compaq merger: the day the merger was announced HP’s stock closed at $18.87, down sharply from $23.21 the previous day.

Recently, ‘synergy’ has also become an increasingly familiar term within the telecommunications industry, owing to activities in two distinct areas. These are now discussed in turn.

Fixed-Mobile Convergence: How tangible are the synergies?

Fixed-mobile convergence (FMC) is a hot topic, and numerous substantial M&A transactions have occurred in this space in recent years (especially in Europe). Figure 1 charts some of these transactions, including publicly available synergy estimates (reflecting cost savings, revenue benefits, or both), below:

Figure 1: Fixed-mobile convergence driven by synergy value


Source: Vodafone, Analysys Mason, STL Partners
* Synergy run-rate by 2016; ** Revenue synergies only

With synergies estimated to account for over 10% of each of these transactions’ valuations, and in the case of Vodafone/KDG nearly 30%, they are clearly perceived as an important driver of value. However, there are two key qualifications to be made here:

  1. Discounted Cash Flow, or ‘DCF’, is theoretically sound but less credible in practice: Each of the estimates of ‘synergy value’ in Figure 1 were constructed using DCF techniques, which attempt to forecast future cash flows and ‘discount’ these to their overall value today (e.g. because one can save cash and earn interest) . Although theoretically sound, there are several problems with DCF in practice.
  2. Certain FMC synergies are more tangible than others: Whilst cost-centric synergies, such as economies of scale (e.g. combined call centres) and access to mobile backhaul, are tangible and easier to quantify, revenue-centric synergies (e.g. quad-play and upselling) are less tangible and more challenging to quantify

These qualifications mirror those raised in the ‘Valuing Digital: A Contentious Yet Vital Business’ Executive Briefing, which discusses the challenges telecoms operators are facing when seeking to generate formal valuations of their digital businesses.

Recap: Digital businesses are especially challenging to value

As telecoms operators’ ambitions in digital services continue to grow, they are increasingly asking what the value of their specific digital initiatives are. Without understanding the value of their digital businesses, telcos cannot effectively govern their individual digital activities: prioritisation, budget allocation and knowing when to close initiatives (‘fast failure’) within digital is challenging without a clear idea of the return on investment different verticals and initiatives are generating. However, telcos face significant challenges across three areas when attempting to value their businesses:

  1. There are challenges in valuing any business (analogue or digital): Although DCF has its drawbacks (see above), any quantitative ‘model’ is necessarily a simplification of reality
  2. Traditional approaches to valuation (e.g. DCF) are inadequate for digital businesses: DCF is especially inappropriate when valuing early-stage digital businesses due to their unique characteristics
  3. The potential for digital services to generate ‘synergy value’ presents further challenges for valuation: Synergy value presents additional conceptual and practical challenges when digital businesses are held within telecoms operators. Figure 2 outlines these below:

Figure 2: Conceptual and practical challenges caused by synergy value


Source: STL Partners

Therefore, telcos (but also the broader technology ecosystem in general) need a new set of tools to answer questions in two key areas. For example:

  1. How should telcos model the market value of their digital businesses?
    • Introducing ‘proxy models’
    • What are the advantages and disadvantages of proxy models?
    • How can a proxy be built to account for issues around limited data availability?
    • Case studies: example valuations of high-profile but privately-held initiatives
  2. How should telcos think about the ‘synergy value’ generated by their digital businesses?
    • What is a useful framework for thinking about synergy value?
    • How are some telcos using clinical trials to assist in the ‘measurement’ of synergies?


  • Executive Summary
  • Introduction
  • Fixed-Mobile Convergence: How tangible are the synergies?
  • Recap: Digital businesses are especially challenging to value
  • A Digital Valuation Framework
  • ‘Net synergy’ has four components: benefits and costs, to and from the core
  • Benchmark data theoretically leads to conservative valuations
  • How to Build a Proxy Model
  • What is a ‘Proxy Model’?
  • Proxy models have several advantages over DCF, but they also have data availability challenges
  • Case Study: SK Telecom’s MelOn could be worth $1bn+
  • How to Measure Synergies
  • The Theory: Clinical trials reduce the synergy problem
  • Case Study: A leading European MNO works with its OpCos to run clinical trials
  • Conclusions and Next Steps
  • STL Partners and Telco 2.0: Change the Game


  • Figure 1: Fixed-mobile convergence driven by synergy value
  • Figure 2: Conceptual and practical challenges caused by synergy value
  • Figure 3: MTN Mobile Money Uganda, Gross Profit Contribution, 2009-12
  • Figure 4: ‘Net synergy’ across four categories
  • Figure 5: ‘Net synergy’ as a component of digital business value
  • Figure 6: Facebook monthly active users vs. valuation, Q1 2010-Present
  • Figure 7: Proxy model output – SME SaaS providers (financial driver)
  • Figure 8: Total VC Investment by Geography, 2010-13
  • Figure 9: Example operational and financial ‘Emerging Market Discounts’
  • Figure 10: Proxy model output – Digital Music (operational driver; South Korea)
  • Figure 11: Correlation vs. Causation


Facebook: Telcos’ New Best Friend?

How Facebook is changing

A history of adaptation

One of the things that sets Facebook apart from its largely defunct predecessors, such as MySpace, Geocities and Friends Reunited, is its ability to adapt to the evolution of the Internet and consumer behaviour. In its decade-long history, Facebook has evolved from a text-heavy, PC-based experience used by American students into a world-leading digital communications and commerce platform used by people of all ages. The basic student matchmaking service Zuckerberg and his fellow Harvard students created in 2004 now matches buyers and sellers in competition with Google, Amazon and eBay (see Figure 1).

Figure 1: From student matchmaking service to a leading digital commerce platform

Source: Zuckerberg’s Facebook page and Facebook investor relations

Launched in early 2004, Facebook initially served as a relatively basic directory with photos and limited communications functionality for Harvard students only. In the spring of 2004, it began to expand to other universities, supported by seed funding from Peter Thiel (co-founder of Paypal). In September 2005, Facebook was opened up to the employees of some technology companies, including Apple and Microsoft. By the end of 2005, it had reached five million users.

Accel Partners invested US$12.7 million in the company in May 2005 and Greylock Partners and others followed this up with another US$27.5 million in March 2006. The additional investment enabled Facebook to expand rapidly. During 2006, it added the hugely popular newsfeed and the share functions and opened up the registration process to anyone. By December 2006, Facebook had 12 million users.

The Facebook Platform was launched in 2007, enabling affiliate sites and developers to interact and create applications for the social network. In a far-sighted move, Microsoft invested US$240 million in October 2007, taking a 1.6% stake and valuing Facebook at US$15 billion. By August 2008, Facebook had 100 million users.

Achieving the 100 million user milestone appears to have given Facebook ‘critical mass’ because at that point growth accelerated dramatically. The company doubled its user base to 200 million in nine months (May 2009) and has continued to grow at a similar rate since then.

As usage continue to grow rapidly, it was increasingly clear that Facebook could erode Google’s dominant position in the Internet advertising market. In June 2011, Google launched the Google + social network – the latest move in a series of efforts by the search giant to weaken Facebook’s dominance of the social networking market. But, like its predecessors, Google+ has had little impact on Facebook.

2012-2013 – the paranoid years

Although Facebook shrugged off the challenge from Google+, the rapid rise of the mobile Internet did cause the social network to wobble in 2012. The service, which had been designed for use on desktop PCs, didn’t work so well on mobile devices, both in terms of providing a compelling user experience and achieving monetisation. Realising Facebook could be disrupted by the rise of the mobile Internet, Zuckerberg belatedly called a mass staff meeting and announced a “mobile first” strategy in early 2012.

In an IPO filing in February 2012, Facebook acknowledged it wasn’t sure it could effectively monetize mobile usage without alienating users. “Growth in use of Facebook through our mobile products, where we do not currently display ads, as a substitute for use on personal computers may negatively affect our revenue and financial results,” it duly noted in the filing.

Although usage of Facebook continued to rise on both the desktop and the mobile, there was increasing speculation that it could be superseded by a more mobile-friendly service, such as fast-growing photo-sharing service Instagram. Zuckerberg’s reaction was to buy Instagram for US$1 billion in April 2012 (a bargain compared with the $21 billion plus Facebook paid for WhatsApp less than two years later).

Moreover, Facebook did figure out how to monetise its mobile usage. Cautiously at first, it began embedding adverts into consumers’ newsfeeds, so that they were difficult to ignore. Although Facebook and some commentators worried that consumers would find these adverts annoying, the newsfeed ads have proven to be highly effective and Facebook continued to grow. In October 2012, now a public company, Facebook triumphantly announced it had one billion active users, with 604 million of them using the mobile site.

Even so, Facebook spent much of 2013 tinkering and experimenting with changes to the user experience. For example, it altered the design of the newsfeed making the images bigger and adding in new features. But some commentators complained that the changes made the site more complicated and confusing, rather than simplifying it for mobile users equipped with a relatively small screen. In April 2013, Facebook tried a different tack, launching Facebook Home, a user interface layer for Android-compatible phones that provides a replacement home screen.

And Zuckerberg continued to worry about upstart mobile-orientated competitors. In November 2013, a number of news outlets reported that Facebook offered to buy Snapchat, which enables users to send messages that disappear after a set period, for US$3 billion. But the offer was turned down.

A few months later, Facebook announced it was acquiring the popular mobile messaging app WhatsApp for what amounted to more than US$21 billion at the time of completion.

In 2014 – going on the offensive

By acquiring WhatsApp at great expense, Facebook alleviated immediate concerns that the social network could be dislodged by another disruptor, freeing up Zuckerberg to turn his attention to new technologies and new markets. The acquisition also put to rest investors’ immediate fears that Facebook could be superseded by a more fashionable, dedicated mobile service, pushing up the share price (see the section on Facebook’s valuation). In May 2014, Facebook wrong-footed many industry watchers and some of its rivals by announcing it had agreed to acquire Oculus VR, Inc., a leading virtual reality company, for US$2 billion in cash and stock.

Zuckerberg has since described the WhatsApp and Oculus acquisitions as “big bets on the next generation of communication and computing platforms.” And Facebook is also investing heavily in organic expansion, increasing its headcount by 45% in 2014, while opening another data center in Altoona, Iowa.

Zuckerberg also continues to devote time and attention to Internet.org, a multi-company initiative to bring free basic Internet services to people who aren’t connected. Announced in August 2013, Internet.org has since launched free basic internet services in six developing countries. For example, in February 2015, Facebook and Reliance Communications launched Internet.org in India. As a result, Reliance customers in six Indian states (Tamil Nadu, Mahararashtra, Andhra Pradesh, Gujarat, Kerala, and Telangana) now have access to about 40 services ranging from news, maternal health, travel, local jobs, sports, communication, and local government information.

Zuckerberg said that more than 150 million people now have the option to connect to the internet using Internet.org, and the initiative had, so far, succeeded in connecting seven million people to the internet who didn’t before have access. “2015 is going to be an important year for our long term plans,” he noted.

The Facebook exception – no fear, more freedom

Although it is now listed, Facebook is clearly not a typical public company. Its massive lead in the social networking market has given it an unusual degree of freedom. Zuckerberg has a controlling stake in the social network (he is able to exercise voting rights with respect to a majority of the voting power of the outstanding capital stock) and the self-confidence to ignore any grumblings on Wall Street. Facebook is able to make acquisitions most other companies couldn’t contemplate and can continue to put Zuckerberg’s long-term objectives ahead of those of short-term shareholders. Like Amazon, Facebook frequently reminds investors that it isn’t trying to maximise short-term profitability. And unlike Amazon, Facebook may not even be trying to maximize long-term profitability.

On Facebook’s quarterly earning calls, Zuckerberg likes to talk about Facebook’s broad, long-term aims, without explaining clearly how fulfilling these objectives will make the company money. “In the next decade, Facebook is focused on our mission to connect the entire world, welcoming billions of people to our community and connecting many more people to the internet through Internet.org (see Figure 2),” he said in the January 2015 earnings call. “Similar to our transition to mobile over the last couple of years, now we want to really focus on serving everyone in the world.”

Figure 2: Zuckerberg is pushing hard for the provision of basic Internet services


Source: Facebook.com

Not all of the company’s investors are entirely comfortable with this mission. On that earnings call, one analyst asked Zuckerberg: “Mark, I think during your remarks in every earnings call, you talk to your investors for a considerable amount of time about Facebook’s efforts to connect the world, and specifically about Internet.org which suggest you think this is important to investors. Can you clarify why you think this matters to investors?”

Zuckerberg’s response: “It matters to the kind of investors that we want to have, because we are really a mission-focused company. We wake up every day and make decisions because we want to help connect the world. That’s what we’re doing here.

“Part of the subtext of your question is that, yes, if we were only focused on making money, we might put all of our energy on just increasing ads to people in the US and the other most developed countries. But that’s not the only thing that we care about here.

“I do think that over the long term, that focusing on helping connect everyone will be a good business opportunity for us, as well. We may not be able to tell you exactly how many years that’s going to happen in. But as these countries get more connected, the economies grow, the ad markets grow, and if Facebook and the other services in our community, or the number one, and number two, three, four, five services that people are using, then over time we will be compensated for some of the value that we’ve provided. This is why we’re here. We’re here because our mission is to connect the world. I just think it’s really important that investors know that.”

Takeaways

Facebook may be a public company, but it doesn’t worry much about shareholders’ short-term aspirations. It often behaves like a private company that is focused first and foremost on fulfilling the goals of its founder. It is clear Zuckerberg is playing the long game. But it isn’t clear what yardsticks he is using to measure success. Although Zuckerberg knows Facebook needs to be profitable enough to ensure investors’ continued support, his primary goal may be to bring hundreds of millions more people online and secure his place in posterity. There is a danger that Zuckerberg’s focus on connecting people in Africa and developing Asia means that there won’t be sufficient top management attention on the multi-faceted digital commerce struggle with Google in North America and Western Europe.

Financials and business model

Network effects still strong

Within that wider mission to connect the world, Facebook continues to do a great job of connecting people to Facebook. Fuelled by network effects, Facebook says that 1.39 billion people now use Facebook each month (see Figure 3) and 890 million people use the service daily, an increase of 165 million monthly active users and 133 million daily active users in 2014. In developed markets, many consumers use Facebook as a primary medium for communications, relying on it to send messages, organize events and relay their news. As a result, in parts of Europe and North America, adults without a Facebook account are increasingly considered eccentric.

Figure 3: Facebook’s user base continues to grow rapidly

Source: Facebook and STL Partners analysis

Having said that, some active users are clearly more active and valuable than others. In a regulatory filing, Facebook admits that some active users may, in fact, be bots: “Some of our metrics have also been affected by applications on certain mobile devices that automatically contact our servers for regular updates with no user action involved, and this activity can cause our system to count the user associated with such a device as an active user on the day such contact occurs. The impact of this automatic activity on our metrics varied by geography because mobile usage varies in different regions of the world.”

This automatic polling of Facebook’s servers by mobile devices makes it difficult to judge the true value of the social network’s user base. Anecdotal evidence suggests many people with Facebook profiles are kept active on Facebook primarily by their smartphone apps, rather than because they are actively choosing to use the service. Still, Facebook would argue that these people are seeing the notifications on their mobile devices and are, therefore, at least partially engaged.


  • Executive Summary
  • How Facebook is changing
  • A history of adaptation
  • The Facebook exception – no fear, more freedom
  • Financials and business model
  • Growth prospects for the core business
  • User growth
  • Monetisation – better targeting, higher prices
  • Mobile advertising spend lags behind usage
  • The Facebook Platform – Beyond the Walled Garden
  • Multimedia – taking on YouTube
  • Search – challenging Google’s core business
  • Enabling transactions – moving beyond advertising
  • Virtual reality – a long-term game
  • Takeaways
  • Threats and risks
  • Facebook fatigue
  • Google – Facebook enemy number one
  • Privacy concerns
  • Wearables and the Internet of Things
  • Local commerce – in need of a map
  • Facebook and communication services
  • Conclusions
  • Facebook is spread too thin
  • Partnering with Facebook – why and how
  • Competing with Facebook – why and how


  • Figure 1: From student matchmaking service to a leading digital commerce platform
  • Figure 2: Zuckerberg is pushing hard for the provision of basic Internet services
  • Figure 3: Facebook’s user base continues to grow rapidly
  • Figure 4: Facebook’s revenue growth has accelerated in the past two years
  • Figure 5: Facebook’s ARPU has risen sharply in the past two years
  • Figure 6: After wobbling in 2012, investors’ belief in Facebook has strengthened
  • Figure 7: Despite a rebound, Facebook’s valuation per user is still below its peak
  • Figure 8: Facebook could be serving 2.3 billion people by 2020
  • Figure 9: Share of digital advertising – Facebook is starting to close the gap on Google but remains a long way behind
  • Figure 10: The gap between click through rates for search and social remains substantial
  • Figure 11: Social networks’ revenue per click is rising but remains 40% of search
  • Figure 12: Facebook’s advertising has moved from the right column to centre stage
  • Figure 13: Facebook’s startling mobile advertising growth
  • Figure 14: Zynga’s share price reflects decline of Facebook.com as an app platform
  • Figure 15 – Facebook Connect – an integral part of the Facebook Platform
  • Figure 16: Leading Internet players’ share of social log-ins over time
  • Figure 17: Facebook’s personalised search proposition
  • Figure 18: Facebook’s new buy button – embedded in a newsfeed post
  • Figure 19: The rise and rise of Android – not good for Facebook
  • Figure 21: Facebook and Google are both heavily associated with privacy issues
  • Figure 22: Facebook wants to conquer the Wheel of Digital Commerce
  • Figure 23: Facebook’s cash flow is far behind that of Google and Apple
  • Figure 24: Facebook’s capital expenditure is relatively modest compared with peers
  • Figure 25: Facebook’s capex/revenue ratio has been high but is falling


The Digital Dashboard: How new metrics drive success in telco digital initiatives

Introduction

As core services revenues, margins and cash generation decline quickly, Communications Service Providers (CSPs) are seeking to invest in and grow new (digital) services. STL Partners estimates that digital business should represent 25+% of Telco revenue by 2020 to avoid long-term industry decline. The move to digital is challenging for CSPs.  It will require large established organisations to define and implement new sustainable business models with new services delivered to existing and new customers via new channels and partners underpinned by new technology and supported by new operating, revenue and cost models. This requires a fundamental shift from a traditional infrastructure-based business to a complex amalgam of infrastructure, platform and product innovation businesses:

  • Historically, the telecoms industry has been an infrastructure business. It has invested large amounts of capital on things such as spectrum purchases, fibre and tower deployments. The result has been three largely undifferentiated services and revenue streams that have been ‘bundled in’ with the networks – voice, messaging and data. In the past, being a good communications service provider involved:
    • Making effective capital investment decisions, and then
    • Operating the network efficiently and affectively.
  • The Internet has changed everything by fracturing the integration between the network and services so that voice and messaging are no longer the sole domain of CSPs. CSPs now need to continue to hone their infrastructure business skills (in a world where every dollar of revenue is competed for hard by other operators and by ‘OTT’ players), and must also develop a range of new skills, assets, partnerships, customer relationships and operating and financial models if they are to compete in the new digital service areas.

In our recent survey (see Reality Check: Are operators’ lofty digital ambitions unrealistic given slow progress to date?), Telco practitioners were asked to comment on the importance of nine things that needed to be addressed to complete their digital business model transformation and the progress made to tackle them (see Figure 1).

Figure 1: Digital metrics should be driving change at CSPs but are themselves proving difficult to implement


Source: STL Partners/Telco 2.0 Operator Survey, November 2014

Measurement using new digital operational/financial metrics was highlighted in the global survey as one of the ‘big 6’ challenges that need to be addressed for CSPs to be successful in future. However, to date, it has often been neglected by CSPs (metrics are often an after-thought and not an integral part of the digital transformation process).

In this report, we argue that the reverse is true: effective metrics lie at the heart of change. Without measurement, it is impossible to make decisions and engender change: an organisation continues on its existing path even if that ultimately leads to decline. We will:

  1. Look at why it is important to capture, synthesise and act upon appropriate metrics.
  2. Examine traditional and new approaches to the use of performance metrics and identify the factors that contribute to success and failure.
  3. Highlight ‘telco best-practice’ via a case-study from a leading Asian CSP, Telkom Indonesia.

Why metrics matter

There is a common misconception that start-ups and digital companies do not – and do not need to – measure and report the performance of their businesses and initiatives. Digital start-ups are often portrayed as small creative teams working on ‘exciting stuff’ with no sense of business rigour or control. This could not be further from the truth. Most start-ups follow a LEAN & agile approach to product ideation and development are steered by one motto… “What you cannot measure, you cannot manage”.  This is even more true if they are VC-backed and therefore reliant on hitting specific targets to receive their next round of funding.

Start-ups rely on operational and actionable metrics to measure progress, identify when to pivot as an organisation and translate strategic objectives into daily activities. By applying the “Build – Measure – Learn” concept (see Figure 2), innovators create something (Build), evaluate how well it is received (Measure), and adjust it in response to the feedback they receive (Learn).

Figure 2: “Build – Measure – Learn” concept

Source: LEAN Analytics – Use Data to Build a Better Startup Faster

Metrics evolve over time. Start-ups are continuously searching for the ‘right’ metrics at any given stage of their development because their businesses are constantly evolving – either because they have just started on their journey or because they may have recently changed direction (or ‘pivoted’ from their original value proposition). Metrics are perceived as an operational toolset to quickly iterate to the right product and market before the money runs out. This ‘sword of Damocles’ hanging over entrepreneurs’ heads is a world away from the world inhabited by telcos’ employees.

Indeed, CSPs’ current approach to business targets & funding allocation is unlikely to create a sense of urgency that will drive and stimulate the success of digital initiatives. Based on extensive interviews with CSPs, digital start-ups and VCs, STL Partners concludes that CSPs should focus on:

  • Removing the Telco ‘safety net’. To succeed in creating truly compelling customer experiences CSPs need to mimic a VC-like environment and create a culture of higher-reward in return for higher risk by targeting employees more tightly on their digital initiative’s performance:

    • Reward success more heavily: this could be ‘shadow’ share options in the venture which yield value in the form of shares or cash bonus for hitting targets which would takes an employee’s overall package way beyond what could be earned in the core business.

    • Create risk for individuals: the quid pro quo of a big upside could be a reduced salary to, say, 60% of normal Telco pay (i.e. similar to what might be earned in a typical start-up) or offer contracts that only renew if an initiative hits its targets – if you fall short, you leave the business and are not simply moved elsewhere in the organisation.

  • Adopting ‘start-up culture’ and ways of thinking. For example, when negotiating for funds, employees should be negotiating for their survival, not for a budget or a budget increase. Also, Telcos should start using the vocabulary / parlance commonly used in the digital space as such burn rate, time before cash runs out, cash break-even date, etc.

  • Establishing new processes to manage KPIs and performance metrics. In the fast-paced digital environment, it usually does not make sense to use 18-24 month targets derived from a detailed business case backed by financial metrics (such as revenue, EBITDA, etc.) – particularly for early-stage start-ups.  Google actually identified a move away from this approach to one focused on a stable strategic foundation (make sure the initial proposition is viable by defining a clear problem we are trying to solve and how the solution will differentiate from alternative solutions) + fluid plans as one of the pillars of its success (see Figure 3
    08D0C9EA79F9BACE118C8200AA004BA90B02000000080000000E0000005F005200650066003400310032003500330036003000380034000000

    08D0C9EA79F9BACE118C8200AA004BA90B02000000080000000E0000005F005200650066003400300039003500320034003300340038000000
    )

Figure 3: Business plan and financial metrics are out-of-date in a digital world

Source: How Google works, Eric Schmidt, Jonathan Rosenberg and Alan Eagle

Metrics are a powerful tool that CSPs should use to foster sustainable commercial growth through validated learning. Unfortunately, metrics are often an “after-thought” and very few CSPs have implemented a consistent approach to metrics.  From a series of interviews, undertaken by STL for this research, it became apparent that most initiatives failed to develop regular reporting that engages (or is even understood by) other stakeholders. At best, operators are inconsistent in tracking digital innovation, at worst, negligent.


  • Executive Summary
  • Introduction
  • Why metrics matter
  • Metrics make a difference: 3 case studies from telecoms operators
  • 3 additional reasons why Telcos need digital metrics
  • Alternative approaches to digital metrics for telecoms operators
  • Introduction
  • The corporate approach – the Balanced Scorecard
  • The start-up approach – LEAN & AARRR methodology
  • Telkom Indonesia’s approach to digital metrics
  • Background
  • Telkom’s current digital strengths
  • Telkom Indonesia’s digital metrics system
  • Benefits of the digital metrics system to Telkom Indonesia
  • Conclusions
  • STL Partners and Telco 2.0: Change the Game


  • Figure 1: Digital metrics should be driving change at CSPs but are themselves proving difficult to implement

  • Figure 2: “Build – Measure – Learn” concept

  • Figure 3: Business plan and financial metrics are out-of-date in a digital world

  • Figure 4: Near perfect correlation between number of agents and number of M-Pesa subscribers, R2 = 0.96

  • Figure 5: Metrics reporting by M-Pesa, December 2012

  • Figure 6: Turkcell’s Mobile Marketing Platform Overview

  • Figure 7: Turkcell’s continuous development of it Mobile Marketing portfolio

  • Figure 8: Libon single roadmap enables rapid evolution and rich features

  • Figure 9: Libon – Cost per Monthly Active Users (M)

  • Figure 10: Illustrative Net Synergy Make up (Hypothetical case)

  • Figure 11: Facebook vs. Yield Businesses: Revenue and Enterprise Value (EV)

  • Figure 12: Facebook: Monthly Active Users vs. Valuation

  • Figure 13: Different players’ metrics requirements

  • Figure 14: Balance Scorecard concept

  • Figure 15: AARRR model

  • Figure 16: Pros & Cons – Summary table

  • Figure 17: Telkom Indonesia’s Metrics Approach – Characteristics

  • Figure 18: Telkom Indonesia’s digital strengths

  • Figure 19: Telcos – slow by design?

  • Figure 20: Telkom Indonesia’s TIMES service portfolio

  • Figure 21: LEAN start-up approach

  • Figure 22: Delivering Innovation – Telkom’s internal organisation

  • Figure 23: Telco 2.0 Domain Framework

  • Figure 24: Metrics Prioritisation & Outcomes Example

  • Figure 25: Governance process – Phase 1 & 2

  • Figure 26: Innovation Governance – Case studies examples