Telco Cloud Deployment Tracker: Will vRAN eclipse pure open RAN?

Is vRAN good enough for now?

In this October 2022 update to STL Partners’ Telco Cloud Deployment Tracker, we present data and analysis on progress with deployments of vRAN and open RAN. It is fair to say that open RAN (virtualised AND disaggregated RAN) deployments have not happened at the pace that STL Partners and many others had forecast. In parallel, some very significant deployments and developments are occurring with vRAN (virtualised NOT disaggregated RAN). Is open RAN a networking ideal that is not yet, or never will be, deployed in its purest form?

In our Telco Cloud Deployment Tracker, we track deployments of three types of virtualised RAN:

  1. Open RAN / O-RAN: Open, disaggregated, virtualised / cloud-native, with baseband (BU) functions distributed between a Central Unit (CU: control plane functions) and Distributed Unit (DU: data plane functions)
  2. vRAN: Virtualised and distributed CU/DU, with open interfaces but implemented as an integrated, single-vendor platform
  3. Cloud RAN (C-RAN): Single-vendor, virtualised / centralised BU, or CU only, with proprietary / closed interfaces

Cloud RAN is the most limited form of virtualised RAN: it is based on porting part or all of the functionality of the legacy, appliance-based BU into a Virtual Machine (VM). vRAN and open RAN are much more significant, in both technology and business-model terms, breaking open all parts of the RAN to more competition and opportunities for innovation. They are also cloud-native functions (CNFs) rather than VM-based.

Enter your details below to request an extract of the report

2022 was meant to be the breakthrough year for open RAN: what happened?

  • Of the eight deployments of open RAN we were expecting to go live in 2022 (shown in the chart below), only three had done so by the time of writing.
  • Two of these were on the same network: Altiostar and Mavenir RAN platforms at DISH. The other was a converged Parallel Wireless 2G / 3G RAN deployment for Orange Central African Republic.
  • This is hardly the wave of 5G open RAN, macro-network roll-outs that the likes of Deutsche Telekom, Orange, Telefónica and Vodafone originally committed to for 2022. What has gone wrong?
  • Open RAN has come up against a number of thorny technological and operational challenges, which are well known to open RAN watchers:
    • integration challenges and costs
    • hardware performance and optimisation
    • immature ecosystem and unclear lines of accountability when things go wrong
    • unproven at scale, and absence of economies of scale
    • energy efficiency shortcomings
    • need to transform the operating model and processes
    • pressured 5G deployment and Huawei replacement timelines
    • absence of mature, open, horizontal telco cloud platforms supporting CNFs.
  • Over and above these factors, open RAN is arguably not essential for most of the 5G use cases it was expected to support.
  • This can be gauged by looking at some of the many open RAN trials that have not yet resulted in commercial deployments.

Global deployments of C-RAN, vRAN and open RAN, 2016 to 2023

Image shows global deployments of C-RAN, vRAN and open RAN, 2016 to 2023

Source: STL Partners

Previous telco cloud tracker releases and related research

Enter your details below to request an extract of the report

Telco Cloud Deployment Tracker: 5G core deep dive

Deep dive: 5G core deployments 

In this July 2022 update to STL Partners’ Telco Cloud Deployment Tracker, we present granular information on 5G core launches. They fall into three categories:

  • 5G Non-standalone core (5G NSA core) deployments: The 5G NSA core (agreed as part of 3GPP Release in December 2017), involves using a virtualised and upgraded version of the existing 4G core (or EPC) to support 5G New Radio (NR) wireless transmission in tandem with existing LTE services. This was the first form of 5G to be launched and still accounts for 75% of all 5G core network deployments in our Tracker.
  • 5G Standalone core (5G SA core) deployments: The SA core is a completely new and 5G-only core. It has a simplified, cloud-native and distributed architecture, and is designed to support services and functions such as network slicing, Ultra-Reliable Low-Latency Communications (URLLC) and enhanced Machine-Type Communications (eMTC, i.e. massive IoT). Our Tracker indicates that the upcoming wave of 5G core deployments in 2022 and 2023 will be mostly 5G SA core.
  • Converged 5G NSA/SA core deployments: this is when a dual-mode NSA and SA platform is deployed; in most cases, the NSA core results from the upgrade of an existing LTE core (EPC) to support 5G signalling and radio. The principle behind a converged NSA/SA core is the ability to orchestrate different combinations of containerised network functions, and automatically and dynamically flip over from an NSA to an SA configuration, in tandem – for example – with other features and services such as Dynamic Spectrum Sharing and the needs of different network slices. For this reason, launching a converged NSA/SA platform is a marker of a more cloud-native approach in comparison with a simple 5G NSA launch. Ericsson is the most commonly found vendor for this type of platform with a handful coming from Huawei, Samsung and WorkingGroupTwo. Albeit interesting, converged 5G NSA/SA core deployments remain a minority (7% of all 5G core deployments over the 2018-2023 period) and most of our commentary will therefore focus on 5G NSA and 5G SA core launches.

Enter your details below to request an extract of the report

75% of 5G cores are still Non-standalone (NSA)

Global 5G core deployments by type, 2018–23

  • There is renewed activity this year in 5G core launches since the total number of 5G core deployments so far in 2022 (effective and in progress) stands at 49, above the 47 logged in the whole of 2021. At the very least, total 5G deployments in 2022 will settle between the level of 2021 and the peak of 2020 (97).
  • 5G in whichever form now exists in most places where it was both in demand and affordable; but there remain large economies where it is yet to be launched: Turkey, Russia and most notably India. It also remains to be launched in most of Africa.
  • In countries with 5G, the next phase of launches, which will see the migration of NSA to SA cores, has yet to take place on a significant scale.
  • To date, 75% of all 5G cores are NSA. However, 5G SA will outstrip NSA in terms of deployments in 2022 and represent 24 of the 49 launches this year, or 34 if one includes converged NSA/SA cores as part of the total.
  • All but one of the 5G launches announced for 2023 are standalone; they all involve Tier-1 MNOs including Orange (in its European footprint involving Ericsson and Nokia), NTT Docomo in Japan and Verizon in the US.

The upcoming wave of SA core (and open / vRAN) represents an evolution towards cloud-native

  • Cloud-native functions or CNFs are software designed from the ground up for deployment and operation in the cloud with:​
  • Portability across any hardware infrastructure or virtualisation platform​
  • Modularity and openness, with components from multiple vendors able to be flexibly swapped in and out based on a shared set of compute and OS resources, and open APIs (in particular, via software ‘containers’)​
  • Automated orchestration and lifecycle management, with individual micro-services (software sub-components) able to be independently modified / upgraded, and automatically re-orchestrated and service-chained based on a persistent, API-based, ‘declarative’ framework (one which states the desired outcome, with the service chain organising itself to deliver the outcome in the most efficient way)​
  • Compute, resource, and software efficiency: as a concomitant of the automated, lean and logically optimal characteristics described above, CNFs are more efficient (both functionally and in terms of operating costs) and consume fewer compute and energy resources.​
  • Scalability and flexibility, as individual functions (for example, distributed user plane functions in 5G networks) can be scaled up or down instantly and dynamically in response to overall traffic flows or the needs of individual services​
  • Programmability, as network functions are now entirely based on software components that can be programmed and combined in a highly flexible manner in accordance with the needs of individual services and use contexts, via open APIs.​

Previous telco cloud tracker releases and related research

Each new release of the tracker is global, but is accompanied by an analytical report which focusses on trends in given regions from time to time:

Enter your details below to request an extract of the report

Why the consumer IoT is stuck in the slow lane

A slow start for NB-IoT and LTE-M

For telcos around the world, the Internet of Things (IoT) has long represented one of the most promising growth opportunities. Yet for most telcos, the IoT still only accounts for a low single digit percentage of their overall revenue. One of the stumbling blocks has been relatively low demand for IoT solutions in the consumer market. This report considers why that is and whether low cost connectivity technologies specifically-designed for the IoT (such as NB-IoT and LTE-M) will ultimately change this dynamic.

NB-IoT and LTE-M are often referred to as Massive IoT technologies because they are designed to support large numbers of connections, which periodically transmit small amounts of data. They can be distinguished from broadband IoT connections, which carry more demanding applications, such as video content, and critical IoT connections that need to be always available and ultra-reliable.

The initial standards for both technologies were completed by 3GPP in 2016, but adoption has been relatively modest. This report considers the key B2C and B2B2C use cases for Massive IoT technologies and the prospects for widespread adoption. It also outlines how NB-IoT and LTE-M are evolving and the implications for telcos’ strategies.

This builds on previous STL Partners’ research, including LPWA: Which way to go for IoT? and Can telcos create a compelling smart home?. The LPWA report explained why IoT networks need to be considered across multiple generations, including coverage, reliability, power consumption, range and bandwidth. Cellular technologies tend to be best suited to wide area applications for which very reliable connectivity is required (see Figure below).

IoT networks should be considered across multiple dimensions

IoT-networks-disruptive-analysis-stl-2021
Source: Disruptive Analysis


Enter your details below to request an extract of the report

The smart home report outlined how consumers could use both cellular and short-range connectivity to bolster security, improve energy efficiency, charge electric cars and increasingly automate appliances. One of the biggest underlying drivers in the smart home sector is peace of mind – householders want to protect their properties and their assets, as rising population growth and inequality fuels fear of crime.

That report contended that householders might be prepared to pay for a simple and integrated way to monitor and remotely control all their assets, from door locks and televisions to solar panels and vehicles.  Ideally, a dashboard would show the status and location of everything an individual cares about. Such a dashboard could show the energy usage and running cost of each appliance in real-time, giving householders fingertip control over their possessions. They could use the resulting information to help them source appropriate insurance and utility supply.

Indeed, STL Partners believes telcos have a broad opportunity to help coordinate better use of the world’s resources and assets, as outlined in the report: The Coordination Age: A third age of telecoms. Reliable and ubiquitous connectivity is a key enabler of the emerging sharing economy in which people use digital technologies to easily rent the use of assets, such as properties and vehicles, to others. The data collected by connected appliances and sensors could be used to help safeguard a property against misuse and source appropriate insurance covering third party rentals.

Do consumers need Massive IoT?

Whereas some IoT applications, such as connected security cameras and drones, require high-speed and very responsive connectivity, most do not. Connected devices that are designed to collect and relay small amounts of data, such as location, temperature, power consumption or movement, don’t need a high-speed connection.

To support these devices, the cellular industry has developed two key technologies – LTE-M (LTE for Machines, sometimes referred to as Cat M) and NB-IoT (Narrowband IoT). In theory, they can be deployed through a straightforward upgrade to existing LTE base stations. Although these technologies don’t offer the capacity, throughput or responsiveness of conventional LTE, they do support the low power wide area connectivity required for what is known as Massive IoT – the deployment of large numbers of low cost sensors and actuators.

For mobile operators, the deployment of NB-IoT and LTE-M can be quite straightforward. If they have relatively modern LTE base stations, then NB-IoT can be enabled via a software upgrade. If their existing LTE network is reasonably dense, there is no need to deploy additional sites – NB-IoT, and to a lesser extent LTE-M, are designed to penetrate deep inside buildings. Still, individual base stations may need to be optimised on a site-by-site basis to ensure that they get the full benefit of NB-IoT’s low power levels, according to a report by The Mobile Network, which notes that operators also need to invest in systems that can provide third parties with visibility and control of IoT devices, usage and costs.

There are a number of potential use cases for Massive IoT in the consumer market:

  • Asset tracking: pets, bikes, scooters, vehicles, keys, wallets, passport, phones, laptops, tablets etc.
  • Vulnerable persontracking: children and the elderly
  • Health wearables: wristbands, smart watches
  • Metering and monitoring: power, water, garden,
  • Alarms and security: smoke alarms, carbon monoxide, intrusion
  • Digital homes: automation of temperature and lighting in line with occupancy

In the rest of this report we consider the key drivers and barriers to take-up of NB-IoT and LTE-M for these consumer use cases.

Table of Contents

  • Executive Summary
  • Introduction
  • Do consumers need Massive IoT?
    • The role of eSIMs
    • Takeaways
  • Market trends
    • IoT revenues: Small, but growing
  • Consumer use cases for cellular IoT
    • Amazon’s consumer IoT play
    • Asset tracking: Demand is growing
    • Connecting e-bikes and scooters
    • Slow progress in healthcare
    • Smart metering gains momentum
    • Supporting micro-generation and storage
    • Digital buildings: A regulatory play?
    • Managing household appliances
  • Technological advances
    • Network coverage
  • Conclusions: Strategic implications for telcos


Enter your details below to request an extract of the report

5G strategies: Lessons from the early movers

What’s the best 5G strategy?

When we published the report 5G: The First Three Years in December 2018, we identified that most of the hype – from autonomous cars to surgeons operating from the beach – is at best several years from significant volume. There are no “killer apps” in sight. Telco growth from 5G deployments will be based on greater capacity, lower cost and customer willingness to buy.

If carrier revenue doesn’t rise, the pressure to cut costs will grow

For the last five years, carrier revenue has been almost flat in most countries and we believe this trend is likely to continue.

STL Partners forecasts less than 1% CAGR in telecoms revenues

Mobile and fixed revenue forecast to 2022Source: STL Partners

In our 5G Strategies report series, STL Partners set out to established what 5G actually offers that will enable carriers to make more money in the next few years.

It builds on STL Partners’ previous insights into 5G, including:

The report explores the most recent activities in 5G by operators, vendors, phone makers and chipmakers.

Enter your details below to request an extract of the report

var MostRecentReportExtractAccess = “Most_Recent_Report_Extract_Access”;
var AllReportExtractAccess = “All_Report_Extract_Access”;
var formUrl = “https://go.stlpartners.com/l/859343/2022-02-16/dg485”;
var title = encodeURI(document.title);
var pageURL = encodeURI(document.location.href);
document.write(‘‘);

High-level takeaways from initial 5G deployments

This section provides a high-level overview of the current efforts and activities of select telcos around the world. Broadly, it shows that almost all are pushing ahead on 5G, some much faster than others.

  • Korea is the world’s most advanced 5G market, with two million Koreans having bought 5G phones by July.
    • Korea’s 3.5 GHz networks typically deliver download speeds of 100 – 500 Mbps. SK Telecom and KT are using Samsung equipment. LG Uplus is mostly Huawei. There is little evidence that either vendor has demonstrated superior performance. Korea’s government, supported by the operators, made a decision that speeding ahead on 5G would be valuable prestige and improve the Korean economy. Korea expects to have 200,000 radios in place by the end of 2019, compared with BT which anticipates fewer than 2,500.
  • China Mobile has confirmed Huawei’s estimate that the price of 5G phones will fall to under US$300 in 2020, which will stimulate a sharp increase in demand.
    • The Chinese and the Koreans are investing heavily in augmented and virtual reality and games for 5G. This will take time to mature.
  • Verizon has taken a radical approach to simplifying its core and transport network, partly in preparation for 5G but more generally to improve its cost of delivery. This simplification has allowed it to maintain and even cut some CAPEX investments while delivering performance improvements.
    • 5G mmWave in 28GHz works and often delivers a gigabit. The equipment is of modest size and cost. However, the apparent range of around 200 metres is disappointing (Verizon has not confirmed the range but there is evidence it is short). Verizon expects better range.
  • Sprint’s 160MHz of spectrum at 2.5GHz gives it remarkably wide coverage at 100 – 500 Mbps download speeds. Massive MIMO (multiple-input, multiple-output with 64 or more antennas) at 2.5 GHz works so well that Sprint is achieving great coverage without adding many small cells.
  • Etisalat (UAE) shows that any country that can afford it can deliver 5G today. Around the Gulf, Ooredoo (Kuwait, Qatar), Vodaphone (Qatar), du Telecom (UAE) and STC (Saudi Arabia) are speeding construction to avoid falling behind.
  • BT claims it will “move quickly” and turn on 100 cells per month (which is relatively few in comparison to Korea). BT’s website also claims that 5G has a latency speed of <1 ms, but the first measured latency is 31 ms. At Verizon, latency tests are often a little better than the announced 30 ms. Edge Networks, if deployed, can cut the latency by about half. A faster air interface, Ultra-Reliable Low-Latency Communication (URLLC), expected around 2023, could shave off another 5-7 ms. The business case for URLLC is unproven and it remains to be seen how widely it is deployed. In the rest of the section we look at these and other operators in a little more detail.

Live commercial 5G deployments globally, August 2019

Live 5G commercial deployments as of August 2019

This is the best available information on 5G deployments globally as of August 2019, gathered from both public and private sources. We have excluded operators that have announced 5G launches, but where services are not yet available for consumers to buy, such as AT&T in the US and Deutsche Telekom in Germany.

Table of contents

  • Executive Summary
  • Introduction
    • If carrier revenue doesn’t rise, the pressure to cut costs will grow
  • Operators
    • High-level takeaways
    • European operators
    • Asia Pacific and Middle Eastern operators
    • North America
  • Phone makers
  • 5G system vendors
    • Datang
    • Samsung
    • Ericsson
    • Huawei
    • Nokia
  • Chip makers
    • Qualcomm
    • Samsung
    • Intel
    • MediaTek
    • Huawei-HiSilicon
  • Conclusions: (Almost) all systems go

Enter your details below to request an extract of the report

var MostRecentReportExtractAccess = “Most_Recent_Report_Extract_Access”;
var AllReportExtractAccess = “All_Report_Extract_Access”;
var formUrl = “https://go.stlpartners.com/l/859343/2022-02-16/dg485”;
var title = encodeURI(document.title);
var pageURL = encodeURI(document.location.href);
document.write(‘‘);

Can telcos help cities combat congestion?

Introduction

Part of STL Partners’ (Re)connecting with Consumers stream, this report explores how telcos could support the companies seeking to reinvent how people get around the world’s increasingly congested cities. It looks at the serious problems arising from congestion and the need for a multi-modal approach to urban travel (incorporating ride hailing, public transport, bike and scooter sharing). The report then considers the many challenges facing the new players trying to bring about this multi-modal future, before making creative and constructive suggestions as to how telcos can help address these challenges. Finally, it also outlines how some operators, such as M1 in Singapore, China Mobile and China Telecom, are already playing an enabling role in the personal transportation market.

In particular, the report explores whether telcos can help coordinate the provision of transportation, as well as providing the underlying connectivity that will enable travellers to get information and make bookings on the fly, while allowing the transport providers to monitor their assets.  In many respects, the provision of effective public transportation is a systems integration challenge that requires a wealth of highly accurate real-time information about what is happening across a city.

As explained in the STL Partners report: The Coordination Age: A third age of telecoms, telecoms networks and related services can help people and companies use assets, such as bikes, cars and roads, much more effectively than they have in the past.

This report also builds on other STL research, notably:

The financial and human costs of congestion

After decades of urbanisation, many affluent cities in North America, Europe and East Asia are gridlocked with traffic. In much of the developing world, people continue to migrate to urban centres in search of work, clogging up roads from Bangkok to Bogota. Urbanisation is at its most extreme in East Asia (see Figure 1) where internal migration over the past decade has seen cities across China expanding at breakneck speed.

Figure 1: People have been flocking into cities worldwide for the past five decades

urbanisation rate

Source: The World Bank

The population density in some major economic hubs in the developing world, such as Mumbai, Manila and Lagos, is higher than 10,000 people per square kilometre (see Figure 2), compared with 1,510 people per square kilometre in London. As the UK capital suffers from serious traffic congestion, many cities in the developing world simply do not have enough space to allow the car to be the primary form of transport for their citizens.

In any case, private cars are not a sustainable mode of transport. As well as reducing people’s productivity and quality of life, traffic congestion is damaging air quality and harming human health. Air pollution has become the fourth highest risk factor for premature deaths – one in 10 deaths worldwide is attributable to air pollution exposure, according to the World Bank. Moreover, the bank says the economic burden of pollution is immense for the world and for individual countries. It estimates that ambient particulate matter (PM2.5) air pollution alone cost the global economy US$5.7 trillion, or 4.4% of global GDP, in 2016.

Figure 2: Many cities in the developing world are very crowded and cramped

the biggest cities in the world

Source: UN

So where is traffic congestion at its worst? Of the 38 countries covered by the INRIX 2017 Traffic Scorecard, Thailand is top of the list. In Thailand, drivers spend an average of 56 hours in rush hour congestion, ahead of Indonesia (51 hours) and Columbia (49 hours), followed by Venezuela (42), and the U.S. and Russia both with 41 hours (see Figure 3). Among developed nations, U.S. and Russia have the most congested cities in the world.

Intriguingly, sales of cars fell in 2018 for the first time in almost 28 years in rapidly urbanising China, a symptom of both the economic slowdown and the frustration of trying to drive in the country’s congested cities. Traffic jams, parking difficulties and overcrowding on buses and subways are the top three problems for urban commuters in China, according to a 2018 report by think tank Tencent Financial Technology.

Figure 3: The countries where the most time is lost to traffic congestion

time people spend in congestion

Source: NRIX 2017 Traffic Scorecard

INRIX’s data shows that Los Angeles tops the list of the world’s most gridlocked cities, with commuting drivers spending an average of 102 hours in congestion in 2017, followed by Moscow (91 hours), New York (91 hours), San Francisco (79 hours) and Bogota (75 hours).

Figure 4: Most of the most gridlocked cities are in the developed world

cities with highest congestion

Source: NRIX 2017 Traffic Scorecard


Contents
  • Executive summary
  • Introduction
  • Disrupting urban travel
    • Similarities with telecoms
  • Bringing about a multi-modal future
    • The Amazon of transportation?
    • Uber’s competitors
    • Takeaways – why one company won’t win
  • The rise of e-bikes and e-scooters
  • The challenges confronting micro-mobility
    • Lack of profitability
    • The maintenance and charging conundrum
    • The threats of vandalism and theft
    • Safety and public order
    • Buying rather than renting
  • How telcos are getting involved
  • Conclusions
Figures
  1. People have been flocking into cities worldwide for the past five decades
  2. Many cities in the developing world are very crowded and cramped
  3. The countries where the most time is lost to traffic congestion
  4. Most of the most gridlocked cities are in the developed world
  5. An overview of the pros and cons of different modes of urban transport
  6. Lime and Bird are clear leaders in the US e-bike and scooter sharing markets
  7. Both Lime and Bird have reported rapid growth in the number of rides
  8. Lime claims using its products is far cheaper than using a private car
  9. Challenges facing providers of shared bikes and scooters
  10. Some Northern European countries have embraced cycling in urban areas
  11. Sales of bikes (including electric-bikes) continue to rise

Telco NFV & SDN Deployment Strategies: Six Emerging Segments

Introduction

STL Partners’ previous NFV and SDN research

This report continues the analysis of three previous reports in exploring the NFV (Network Functions Virtualization) and SDN (Software Defined Networking) journeys of several major telcos worldwide, and adds insights from subsequent research and industry discussions.

The first two reports that STL Partners produced contained detailed discussion of the operators that have publicly engaged most comprehensively with NFV: Telefónica and AT&T.

Telefónica embarked on an ambitious virtualization program, dubbed ‘UNICA’, toward the start of 2014; but its progress during 2014 and 2015 was impeded by internal divisions, lack of leadership from top management, and disagreement over the fundamental technology roadmap. As a result, Telefónica has failed to put any VNFs (Virtualized Network Functions) into production; although it continues to be a major contributor to industry efforts to develop open NFV standards.

By contrast, AT&T’s virtualization program, the User-Defined Network Cloud (UDNC) – launched at the same time as Telefónica’s, in February 2014 – has already contributed to a substantial volume of live NFV deployments, including on-demand networking products for enterprise customers and virtual EPC (Enhanced Packet Core) supporting mobile data and connected car services. AT&T’s activities have been driven from board level, with a very focused vision of the overall transformation that is being attempted – organizational as much as technological – and the strategic objectives that underlie it: those of achieving the agility, scalability and cost efficiency required to compete with web-scale players in both enterprise and consumer markets.

The third report in the series – ‘7 NFV Hurdles: How DTAG, NTT, Verizon, Vodafone, Swisscom and Comcast have tackled them’  – extended the analysis to the SDN and NFV deployment efforts of several other major operators. The report arrived at a provisional model for the stages of the SDN / NFV transformation process, outlined in Figure 1 below.

Figure 1: The SDN-NFV Transformation Process

The transformation process outlined in the chart suggests that elaborating the overall SDN architecture should ideally precede the NFV process: logically if not always chronologically. This is because it is essential to have a vision of the ‘final’ destination, even if – or especially as – operators are navigating their way through a shifting myriad of technology choices, internal change programs, engagements with vendor and open-source ecosystems, priorities and opportunities for virtualization, legacy system migration models, and processes for service and business remodeling.

The focus of this report

This report re-examines some of the analysis undertaken on the players above, along with some additional players, to derive a more fine-grained understanding of the virtualization journeys of different types of telco.

We examine these journeys in relation to five dimensions and the analysis focuses on the choices operators have made in these areas, and how things have turned out so far. This, in turn, allows us to pinpoint six telco segments for SDN and NFV deployment.

There is no ‘one size fits all’ approach to SDN and NFV. However, because the operators we examine have a similar rationale for engaging in SDN- and NFV-led transformation and display sufficient commonality in their approach to deployment, STL Partners has been able to make three core best-practice implementation recommendations.


  • Executive summary
  • Contents
  • Introduction
  • STL Partners’ previous NFV and SDN research
  • The focus of this report
  • Virtualization journeys: 6 telco segments
  • The Story So Far: AT&T and Telefónica
  • ‘NFV Business Model Transformation Pioneers’: BT, China Mobile, NTT and Verizon
  • ‘Smart Piper Incumbent’: AT&T and Deutsche Telekom
  • ‘Fly Blind Incumbent’: Telefónica and Swisscom
  • ‘Agile Adopter’: Tele2
  • ‘Utilitarian adopters’: Vodafone and SingTel
  • ‘Cableco 2.0’: Comcast and Liberty Global
  • Conclusion and Best Practice Recommendations

The Internet of Things: Impact on M2M, where it’s going, and what to do about it?

Introduction

From RFID in the supply chain to M2M today

The ‘Internet of Things’ first appeared as a marketing term in 1999 when it was applied to improved supply-chain strategies, leveraging the then hot-topics of RFID and the Internet.

Industrial engineers planned to use miniaturised, RFID tags to track many different types of asset, especially relatively low cost ones. However, their dependency on accessible RFID readers constrained their zonal range. This also constrained many such applications to the enterprise sector and within a well-defined geographic footprint.

Modern versions of RFID labelling have expanded the addressable market through barcode and digital watermarking approaches, for example, while mobile has largely removed the zonal constraint. In fact, mobile’s economies of scale have ushered in a relatively low-cost technology building block in the form of radio modules with local processing capability. These modules allow machines and sensors to be monitored and remotely managed over mobile networks. This is essentially the M2M market today.

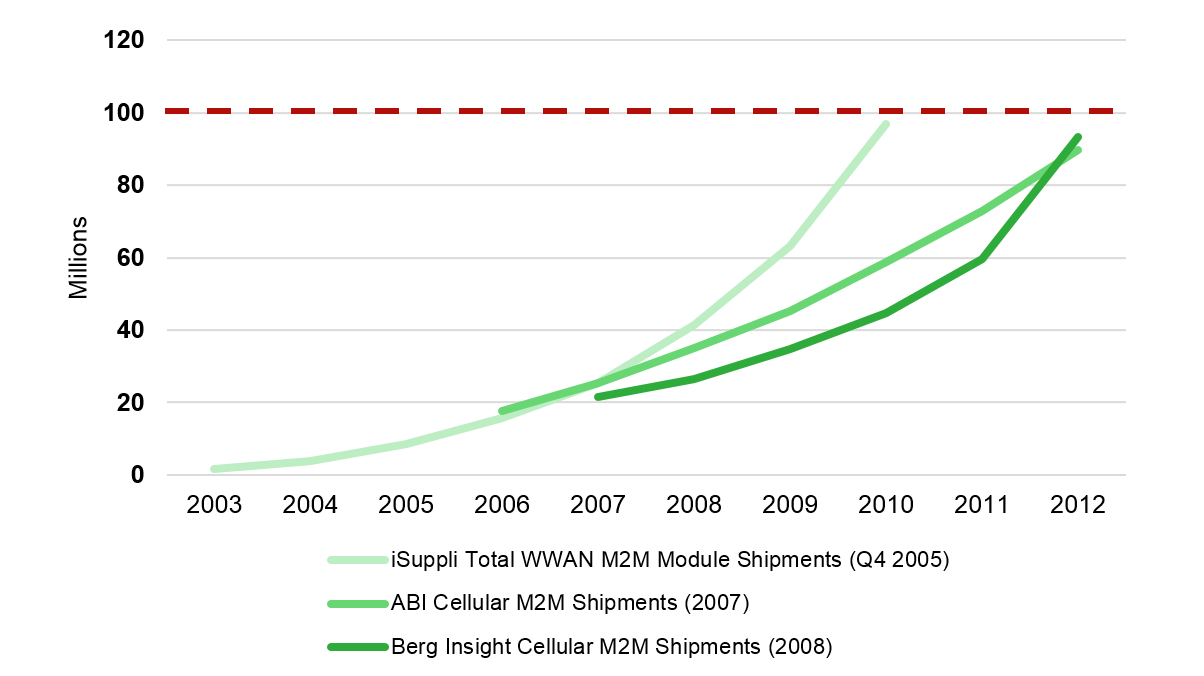
M2M remained a specialist, enterprise sector application for a long time. It relied on niche, systems integration and hardware development companies, often delivering one-off or small-scale deployments. For many years, growth in the M2M market did not meet expectations for faster adoption, and this is visible in analyst forecasts which repeatedly time-shifted the adoption forecast curve. Figure 1 below, for example, illustrates successive M2M forecasts for the 2005-08 period (before M2M began to take off) as analysts tried to forecast when M2M module shipment volumes would breach the 100m units/year hurdle:

Figure 1: Historical analyst forecasts of annual M2M module shipment volumes

Source: STL Partners, More With Mobile

Although the potential of remote connectivity was recognised, it did not become a high-volume market until the GSMA brought about an alignment of interests, across mobile operators, chip- and module-vendors, and enterprise users by targeting mobile applications in adjacent markets.

The GSMA’s original Embedded Mobile market development campaign made the case that connecting devices and sensors to (Internet) applications would drive significant new use cases and sources of value. However, in order to supply economically viable connected devices, the cost of embedding connectivity had to drop. This meant:

  • Educating the market about new opportunities in order to stimulate latent demand
  • Streamlining design practices to eliminate many layers of implementation costs
  • Promoting adoption in high-volume markets such as automotive, consumer health and smart utilities, for example, to drive economies of scale in the same manner that led to the mass-adoption of mobile phones

The late 2000’s proved to be a turning point for M2M, with the market now achieving scale (c. 189m connections globally as of January 2014) and growing at an impressive rate (c. 40% per annum). 

From M2M to the Internet of Things?

Over the past 5 years, companies such as Cisco, Ericsson and Huawei have begun promoting radically different market visions to those of ‘traditional M2M’. These include the ‘Internet of Everything’ (that’s Cisco), a ‘Networked Society’ with 50 billion cellular devices (that’s Ericsson), and a ‘Cellular IoT’ with 100 billion devices (that’s Huawei).

Figure 2: Ericsson’s Promise: 50 billion connected ‘things’ by 2020

Source: Ericsson

Ericsson’s calculation builds on the idea that there will be 3 billion “middle class consumers”, each with 10 M2M devices, plus personal smartphones, industrial, and enterprise devices. In promoting such visions, the different market evangelists have shifted market terminology away from M2M and towards the Internet of Things (‘IoT’).

The transition towards IoT has also had consequences beyond terminology. Whereas M2M applications were previously associated with internal-to-business, operational improvements, IoT offers far more external market prospects. In other words, connected devices allow a company to interact with its customers beyond its strict operational boundaries. In addition, standalone products can now deliver one or more connected services: for example, a connected bus can report on its mechanical status, for maintenance purposes, as well as its location to deliver a higher quality, transit service.

Another consequence of the rise of IoT relates to the way that projects are evaluated. In the past, M2M applications tended to be justified on RoI criteria. Nowadays, there is a broader, commercial recognition that IoT opens up new avenues of innovation, efficiency gains and alternative sources of revenue: it was this recognition, for example, that drove Google’s $3.2 billion valuation of Nest (see the Connected Home EB).

In contrast to RFID, the M2M market required companies in different parts of the value chain to share a common vision of a lower cost, higher volume future across many different industry verticals. The mobile industry’s success in scaling the M2M market now needs to adjust for an IoT world. Before examining what these changes imply, let us first review the M2M market today, how M2M service providers have adapted their business models and where this positions them for future IoT opportunities.

M2M Today: Geographies, Verticals and New Business Models

Headline: M2M is now an important growth area for MNOs

The M2M market has now evolved into a high volume and highly competitive business, with leading telecoms operators and other service providers (so-called ‘M2M MVNOs’ e.g. KORE, Wyless) providing millions of cellular (and fixed) M2M connections across numerous verticals and applications.

Specifically, 428 MNOs were offering M2M services across 187 countries by January 2014 – 40% of mobile network operators – and providing 189 million cellular connections. The GSMA estimates the number of global connections to be growing by about 40% per annum. Figure 3 below shows that as of Q4 2013 China Mobile was the largest player by connections (32 million), with AT&T second largest but only half the size.

Figure 3: Selected leading service providers by cellular M2M connections, Q4 2013


Source: Various, including GSMA and company accounts, STL Partners, More With Mobile

Unsurprisingly, these millions of connections have also translated into material revenues for service providers. Although MNOs typically do not report M2M revenues (and many do not even report connections), Verizon reported $586m in ‘M2M and telematics’ revenues for 2014, growing 47% year-on-year, during its most recent earnings call. Moreover, analysis from the Telco 2.0 Transformation Index also estimates that Vodafone Group generated $420m in revenues from M2M during its 2013/14 March-March financial year.

However, these numbers need to be put in context: whilst $500m growing 40% YoY is encouraging, this still represents only a small percentage of these telcos’ revenues – c. 0.5% in the case of Vodafone, for example.

Figure 4: Vodafone Group enterprise revenues, implied forecast, FY 2012-18


Source: Company accounts, STL Partners, More With Mobile

Figure 4 uses data provided by Vodafone during 2013 on the breakdown of its enterprise line of business and grows these at the rates which Vodafone forecasts the market (within its footprint) to grow over the next five years – 20% YoY revenue growth for M2M, for example. Whilst only indicative, Figure 4 demonstrates that telcos need to sustain high levels of growth over the medium- to long-term and offer complementary, value added services if M2M is to have a significant impact on their headline revenues.

To do this, telcos essentially have three ways to refine or change their business model:

  1. Improve their existing M2M operations: e.g. new organisational structures and processes
  2. Move into new areas of M2M: e.g. expansion along the value chain; new verticals/geographies
  3. Explore the Internet of Things: e.g. new service innovation across verticals and including consumer-intensive segments (e.g. the connected home)

To provide further context, the following section examines where M2M has focused to date (geographically and by vertical). This is followed by an analysis of specific telco activities in 1, 2 and 3.


  • Executive Summary
  • Introduction
  • From RFID in the supply chain to M2M today
  • From M2M to the Internet of Things?
  • M2M Today: Geographies, Verticals and New Business Models
  • Headline: M2M is now an important growth area for MNOs
  • In-depth: M2M is being driven by specific geographies and verticals
  • New Business Models: Value network innovation and new service offerings
  • The Emerging IoT: Outsiders are raising the opportunity stakes
  • The business models and profitability potentials of M2M and IoT are radically different
  • IoT shifts the focus from devices and connectivity to data and its use in applications
  • New service opportunities drive IoT value chain innovation
  • New entrants recognise the IoT-M2M distinction
  • IoT is not the end-game
  • ‘Digital’ and IoT convergence will drive further innovation and new business models
  • Implications for Operators
  • About STL Partners and Telco 2.0: Change the Game
  • About More With Mobile


  • Figure 1: Historical analyst forecasts of annual M2M module shipment volumes
  • Figure 2: Ericsson’s Promise: 50 billion connected ‘things’ by 2020
  • Figure 3: Selected leading service providers by cellular M2M connections, Q4 2013
  • Figure 4: Vodafone Group enterprise revenues, implied forecast, FY 2012-18
  • Figure 5: M2M market penetration vs. growth by geographic region
  • Figure 6: Vodafone Group organisational chart highlighting Telco 2.0 activity areas
  • Figure 7: Vodafone’s central M2M unit is structured across five areas
  • Figure 8: The M2M Value Chain
  • Figure 9: ‘New entrant’ investments outstripped those of M2M incumbents in 2014
  • Figure 10: Characterising the difference between M2M and IoT across six domains
  • Figure 11: New business models to enable cross-silo IoT services
  • Figure 12: ‘Digital’ and IoT convergence


Connected Car: Key Trends, Players and Battlegrounds

Introduction: Putting the Car in Context

A growing mythology around M2M and the Internet of Things

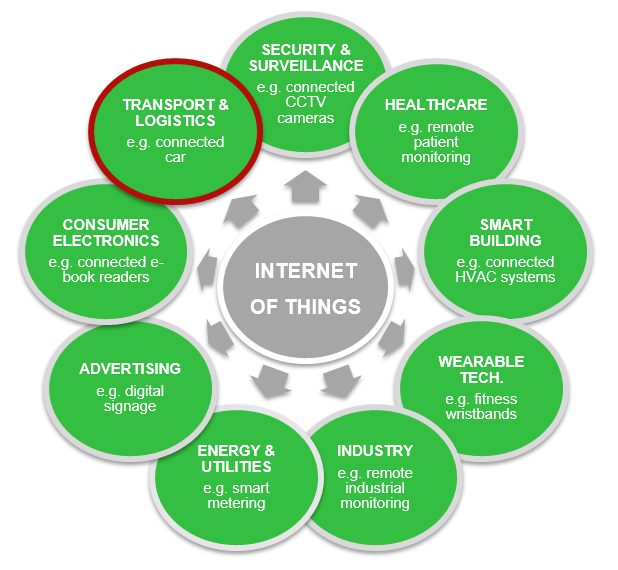
The ‘Internet of Things’, which is sometimes used interchangeably with ‘machine-to-machine’ communication (M2M), is not a new idea: as a term, it was coined by Kevin Ashton as early as 1999. Although initially focused on industrial applications, such as the use of RFID for tagging items in the supply chain, usage of the term has now evolved to more broadly describe the embedding of sensors, connectivity and (to varying degrees) intelligence into traditionally ‘dumb’ environments. Figure 1 below outlines some of the service areas potentially disrupted, enabled or enhanced by the Internet of Things (IoT):

Figure 1: Selected Internet of Things service areas

Source: STL Partners

To put the IoT in context, one can conceive of the Internet as having experienced three key generations to date. The first generation dates back to the 1970s, which involved ARPANET and the interconnection of various military, government and educational institutions around the United States. The second, beginning in the 1990s, can be thought of as the ‘AOL phase’, with email and web browsing becoming mainstream. Today’s generation is dominated by ‘mobile’ and ‘social’, with the two inextricably linked. The fourth generation will be signified by the arrival of the Internet of Things, in which the majority of internet traffic is generated by ‘things’ rather than humans.

The enormous growth of networks, cheaper connectivity, proliferation of smart devices, more efficient wireless protocols (e.g. ZigBee) and various government incentives/regulations have led many to confidently predict that the fourth generation of the Internet – the Internet of Things – will soon be upon us. Visions include the “Internet of Everything” (Cisco) or a “connected future” with 50 billion connected devices by 2020 (Ericsson). Similarly rapid growth is also forecasted by the MIT Technology Review, as detailed below:

Figure 2: Representative connected devices forecast, 2010-20

Source: MIT Technology Review

This optimism is reflected in broader market excitement, which has been intensified by such headline-grabbing announcements as Google’s $3.2bn acquisition of Nest Labs (discussed in depth in the Connected Home EB) and Apple’s recently announced Watch. Data extracted from Google Trends (Figure 3) shows that the popularity of ‘Internet of Things’ as a search term has increased fivefold since 2012:

Figure 3: The popularity of ‘Internet of Things’ as a search term on Google since 2004

Source: Google Trends

However, the IoT to date has predominantly been a case study in hype vs. reality. Technologists have argued for more than a decade about when the army of connected devices will arrive, as well as what we should be calling this phenomenon, and with this a mythology has grown around the Internet of Things: widespread disruption was promised, but it has not yet materialised. To many consumers the IoT can sound all too far-fetched: do I really need a refrigerator with a web browser?

Yet for every ‘killer app’ that wasn’t we are now seeing inroads being made elsewhere. Smart meters are being deployed in large numbers around the world, wearable technology is rapidly increasing in popularity, and many are hailing the connected car as the ‘next big thing’. Looking at the connected car, for example, 2013 saw a dramatic increase in the amount of VC funding it received:

Figure 4: Connected car VC activity, 2010-13

Source: CB Insights Venture Capital Database

The Internet of Things is potentially an important phenomenon for all, but it is of particular relevance to mobile network operators (MNOs) and network equipment providers. Beyond providing cellular connectivity to many of these devices, the theory is that MNOs can expand across the value chain and generate material and sustainable new revenues as their core business continues to decline (for more, see the ‘M2M 2.0: New Approaches Needed’ Executive Briefing).

Nevertheless, the temptation is always to focus on the grandiose but less well-defined opportunities of the future (e.g. smart grids, smart cities) rather than the less expansive but more easily monetised ones of today. It is easy to forget that MNOs have been active to varying degrees in this space for some time: for example, O2 UK had a surprisingly large business serving fleet operators with the 9.6Kbps Mobitex data network for much of the 2000s. To further substantiate this context, we will address three initial questions:

  1. Is there a difference between M2M and the Internet of Things?
  2. Which geographies are currently seeing the most traction?
  3. Which verticals are currently seeing the most traction?

These are now addressed in turn…


  • Executive Summary
  • Introduction: Putting the Car in Context
  • A growing mythology around M2M and the Internet of Things
  • The Internet of Things: a vision of what M2M can become
  • M2M today: driven by specific geographies and verticals
  • Background: History and Growth Drivers
  • History: from luxury models to mass market deployment
  • Growth drivers: macroeconomics, regulation, technology and the ‘connected consumer’
  • Ecosystem: Services and Value Chain
  • Service areas: data flows vs. consumer value proposition
  • Value chain: increasingly complex with two key battlegrounds
  • Markets: Key Geographies Today
  • Conclusions


  • Figure 1: Selected Internet of Things service areas
  • Figure 2: Representative connected devices forecast, 2010-20
  • Figure 3: The popularity of ‘Internet of Things’ as a search term on Google since 2004
  • Figure 4: Connected car VC activity, 2010-13
  • Figure 5: Candidate differences between M2M and the Internet of Things
  • Figure 6: Selected leading MNOs by M2M connections globally
  • Figure 7: M2M market maturity vs. growth by geographic region
  • Figure 8: Global M2M connections by vertical, 2013-20
  • Figure 9: Global passenger car profit by geography, 2007-12
  • Figure 10: A connected car services framework
  • Figure 11: Ericsson’s vision of the connected car’s integration with the IoT
  • Figure 12: The emerging connected car value chain
  • Figure 13: Different sources of in-car connectivity
  • Figure 14: New passenger car sales vs. consumer electronics spending by market
  • Figure 15: Index of digital content spending (aggregate and per capita), 2013
  • Figure 16: OEM embedded modem shipments by region, 2014-20
  • Figure 17: Telco 2.0™ ‘two-sided’ telecoms business model

Digital Commerce 2.0: New $50bn Disruptive Opportunities for Telcos, Banks and Technology Players

Introduction – Digital Commerce 2.0

Digital commerce is centred on the better use of the vast amounts of data created and captured in the digital world. Businesses want to use this data to make better strategic and operational decisions, and to trade more efficiently and effectively, while consumers want more convenience, better service, greater value and personalised offerings. To address these needs, Internet and technology players, payment networks, banks and telcos are vying to become digital commerce intermediaries and win a share of the tens of billions of dollars that merchants and brands spend finding and serving customers.

Mobile commerce is frequently considered in isolation from other aspects of digital commerce, yet it should be seen as a springboard to a wider digital commerce proposition based on an enduring and trusted relationship with consumers. Moreover, there are major potential benefits to giving individuals direct control over the vast amount of personal data their smartphones are generating.

We have been developing strategies in these fields for a number of years, including our engagement with the World Economic Forum’s (WEF) Rethinking Personal Data project, and ongoing research into user data and privacy, digital money and payments, and digital advertising and marketing.

This report brings all of these themes together and is the first comprehensive strategic playbook on how smartphones and authenticated personal data can be combined to deliver a compelling digital commerce proposition for both merchants and consumers. It will save customers valuable time, effort and money by providing a fast-track to developing and / or benchmarking a leading edge strategy and approach in the fast-evolving new world of digital commerce.

Benefits of the Report to Telcos, Other Players, Investors and Merchants


For telcos, this strategy report:

  • Shows how to evaluate and implement a comprehensive and successful digital commerce strategy worth up to c.$50bn (5% of core revenues in 5 years)
  • Saves time and money by providing a fast-track for decision making and an outline business case
  • Rapidly challenges / validates existing strategy and services against relevant ‘best in class’, including their peers, ‘OTT players’ and other leading edge players.


For other players including Internet companies, technology vendors, banks and payment networks:

  • The report provides independent market insight on how telcos and other players will be seeking to generate $ multi-billion revenues from digital commerce
  • As a potential partner, the report will provide a fast-track to guide product and business development decisions to meet the needs of telcos (and others) that will need to make commensurate investment in technologies and partnerships to achieve their value creation goals
  • As a potential competitor, the report will save time and improve the quality of competitor insight by giving a detailed and independent picture of the rationale and strategic approach you and your competitors will need to take


For merchants building digital commerce strategies, it will:


  • Help to improve revenue outlook, return on investment and shareholder value by improving the quality of insight to strategic decisions, opportunities and threats lying ahead in digital commerce
  • Save vital time and effort by accelerating internal decision making and speed to market


For investors, it will:

  • Improve investment decisions and strategies returning shareholder value by improving the quality of insight on the outlook of telcos and other digital commerce players
  • Save vital time and effort by accelerating decision making and investment decisions
  • Help them better understand and evaluate the needs, goals and key strategies of key telcos and their partners / competitors

Digital Commerce 2.0: Report Content Summary

  • Executive Summary. (9 pages outlining the opportunity and key strategic options)
  • Strategy. The shape and scope of the opportunities, the convergence of personal data, mobile, digital payments and advertising, and personal cloud. The importance of giving consumers control. and the nature of the opportunity, including Amazon and Vodafone case studies.
  • The Marketplace. Cultural, commercial and regulatory factors, and strategies of the market leading players. Further analysis of Google, Facebook, Apple, eBay and PayPal, telco and financial services market plays.
  • The Value Proposition. How to build attractive customer propositions in mobile commerce and personal cloud. Solutions for banked and unbanked markets, including how to address consumers and merchants.
  • The Internal Value Network. The need for change in organisational structure in telcos and banks, including an analysis of Telefonica and Vodafone case studies.
  • The External Value Network. Where to collaborate, partner and compete in the value chain – working with telcos, retailers, banks and payment networks. Building platforms and relationships with Internet players. Case studies include Weve, Isis, and the Merchant Customer Exchange.
  • Technology. Making appropriate use of personal data in different contexts. Tools for merchants and point-of-sale transactions. Building a flexible, user-friendly digital wallet.
  • Finance. Potential revenue streams from mobile commerce, personal cloud, raw big data, professional services, and internal use.
  • Appendix – the cutting edge. An analysis of fourteen best practice and potentially disruptive plays in various areas of the market.


Cloud 2.0: Telstra, Singtel, China Mobile Strategies

Summary: In this extract from our forthcoming report ‘Cloud 2.0: Telco Strategies in the Cloud’ we outline the key components of Telstra, Singtel and China Mobile’s cloud strategies, and how they compare to the major ‘Big Technology’ players (such as Microsoft, VMWare, IBM, HP, etc.) and ‘Web Giants’ such as Google and Amazon. (November 2012, Executive Briefing Service, Cloud & Enterprise ICT Stream.) Vodafone results Nov 2012
  Read in Full (Members only)  To Subscribe click here

Below is an extract from this 14 page Telco 2.0 Report that can be downloaded in full in PDF format by members of the Telco 2.0 Executive Briefing service and the Cloud and Enterprise ICT Stream here. Non-members can subscribe here or other enquiries, please email contact@telco2.net / call +44 (0) 207 247 5003.

We’ll also be discussing our findings at the New Digital Economics Brainstorms in Singapore (3-5 December, 2012).

To share this article easily, please click:


Introduction

This is an edited extract of Cloud 2.0: Telco Strategies in the Cloud, a new Telco 2.0 Strategy Report to be published next week. The report examines the evolution of cloud services; the current opportunities for vendors and Telcos in the Cloud market, plus a penetrating analysis on the positioning Telcos need to adopt in order to take advantage of the global $200Bn Cloud services market opportunity.

The report shows how CSP’s can create sustainable differentiated positions in Enterprise Cloud. It contains a concise and comprehensive analysis of key vendor and telco strategies, market forecasts (including our own for both the market and telcos), and key technologies.

Led by Robert Brace (formerly Global Head of Cloud Services for Vodafone), it leverages the knowledge and experience of Telco 2.0 analyst team, senior global brainstorm participants, and targeted industry research and interviews. Robert will also be presenting at Digital Asia, 4-5 Dec, Singapore 2012.

Methodology

In the full report, we reviewed both telcos and technology companies using a list of 30 criteria organised in six groups (Market, Vision, Finance, Proposition, Value Network, and Technology). We aimed to cover their objectives, strategy, market areas addressed, target customers, proposition strategy, routes to market, operational approach, buy / build partner approach, and technology choices.

We based our analysis on a combination of desk research, expert interviews, and output from our Executive Brainstorms.

Among the leading cloud technology companies we identify two groups, which we characterise as “Big Tech” and the “Web Giants”. The first of these are the traditional enterprise IT vendors, while the second are the players originating in the consumer web 2.0 space (hence the name).

  • Big Tech: Microsoft (Azure), Google (Dev & Enterprise), VMWare, Parallels, Rackspace, HP, IBM.
  • Web Giants: Microsoft (Office 365), Amazon, Google (Apps & Consumer), Salesforce, Akamai.

In the report and our analyses below, we use averages for each of these groups to give a key comparator for telco strategies. The full strategy report contains individual analyses for each of these companies and the following telcos: AT&T, Orange, Telefonica, Deutsche Telekom, Vodafone, Verizon, China Telecom, SFR, Belgacom, Elisa, Telenor, Telstra, BT, Cable and Wireless.

Summary

The ‘heatmap’ table below shows the summary results of a 4-box scoring against our key criteria for the four APAC telcos enterprise cloud product intentions (i.e. what they intend to do in the market), where 1 (light blue) is weakest, 4 (bright red) stronger.

Figure 1: Cloud ‘heatmap’ for selected APAC telcos
Cloud APAC Heatmap
Source: STL Partners / Telco 2.0

In the full report are similar tables and comparisons for capabilities and used these results to compare telco to vendor strategies and telco to telco strategies where they compete in the same markets.

In this briefing we summarise results for Telstra, Singtel, China Mobile, and China Telecom.

Telstra – building regional leadership


Operating in the somewhat special circumstances of Australia, Telstra is pursuing both an SMB SaaS strategy (typical of mobile operators) and an enterprise IaaS strategy (see Figure 2). Under the first, it resells a suite of business applications centred on Microsoft Office 365, for which it has exclusivity in Australia.

Under the second, it is trying to develop a cloud computing business out of its managed hosting business. VMWare is the main technology provider, with some Microsoft Hyper-V. Unlike many telcos, Telstra benefits from the fact that the major IaaS players are only just beginning to develop data centres in Australia, and therefore cloud applications hosted with Amazon etc. are subject to a considerable latency penalty.


Figure 2: Telstra: A local leader

Cloud Telstra Radar Map

Source: STL Partners / Telco 2.0

However, data sovereignty concerns in Australia will force other cloud providers to develop at least some presence if they wish to address a variety of important markets (finance, government, and perhaps even mining), and this will eventually bring greater competition.

So far, Telstra has a web portal for the reseller SaaS products, and relies on a mixture of its direct sales force and a partnership with Accenture as a channel for IaaS.

Figure 3: Telstra benefits from geography

Telstra Cloud Radar Map 2

Source: STL Partners / Telco 2.0

To read the note in full, including the following analysis…

  • Introduction
  • Methodology
  • Summary
  • Telstra – building regional leadership
  • SingTel – aiming to be a regional hub
  • China Mobile – the Great Cloud?
  • China Telecom – making a start
  • Conclusions
  • Next steps

…and the following figures…

  • Figure 1: Cloud ‘heatmap’ for selected APAC telcos
  • Figure 2: Telstra: A local leader
  • Figure 3: Telstra benefits from geography
  • Figure 4: SingTel’s strategy is typical, but well executed
  • Figure 5: China Mobile: A less average telco
  • Figure 6: China Mobile has a distinctly different technology strategy
  • Figure 7: China Mobile has some key differentiators (“spikes”) versus its rivals
  • Figure 8: Comparing the APAC Giants
  • Figure 9: Cluster analysis: Telco operators


Members of the Telco 2.0 Executive Briefing Subscription Service and the Cloud and Enterprise ICT Stream can download the full 14 page report in PDF format hereNon-Members, please subscribe here or email contact@telco2.net / call +44 (0) 207 247 5003.


Technologies and industry terms referenced: strategy, cloud, business model, APAC, Singtel, Telstra, China Mobile, China Telecom, VMWare, Amazon, Google, IBM, HP.

The Cloud 2.0 Programme

This research report is a part of the ‘Cloud 2.0’ programme. The report was independently commissioned, written, edited and produced by STL Partners.

The Cloud 2.0 programme is a new initiative that brings together STL Partners’ research and senior thought-leaders and decision makers in the fast evolving Cloud ecosystem to develop new propositions and new partnerships. We’d like to thank the sponsors of the programme listed below for their support. To find out more or to join the Cloud 2.0 programme, please email contact@telco2.net or call +44 (0) 207 247 5003.

Stratus Partners:

Cordys Logo


The value of “Smart Pipes” to mobile network operators

Preface

Rationale and hypothesis for this report

It is over fourteen years since David Isenberg wrote his seminal paper The Rise of the Stupid Network in which he outlined the view that telephony networks would increasingly become dumb pipes as intelligent endpoints came to control how and where data was transported. Many of his predictions have come to fruition. Cheaper computing technology has resulted in powerful ‘smartphones’ in the hands of millions of people and new powerful internet players are using data centres to distribute applications and services ‘over the top’ to users over fixed and mobile networks.

The hypothesis behind this piece of research is that endpoints cannot completely control the network. STL Partners believes that the network itself needs to retain intelligence so it can interpret the information it is transporting between the endpoints. Mobile network operators, quite rightly, will not be able to control how the network is used but must retain the ability within the network to facilitate a better experience for the endpoints. The hypothesis being tested in this research is that ‘smart pipes’ are needed to:

  1. Ensure that data is transported efficiently so that capital and operating costs are minimised and the internet and other networks remain cheap methods of distribution.
  2. Improve user experience by matching the performance of the network to the nature of the application or service being used. ‘Best effort’ is fine for asynchronous communication, such as email or text, but unacceptable for voice. A video call or streamed movie requires guaranteed bandwidth, and real-time gaming demands ultra-low latency;
  3. Charge appropriately for use of the network. It is becoming increasingly clear that the Telco 1.0 business model – that of charging the end-user per minute or per Megabyte – is under pressure as new business models for the distribution of content and transportation of data are being developed. Operators will need to be capable of charging different players – end-users, service providers, third-parties (such as advertisers) – on a real-time basis for provision of broadband and guaranteed quality of service (QoS);
  4. Facilitate interactions within the digital economy. Operators can compete and partner with other players, such as the internet companies, in helping businesses and consumers transact over the internet. Networks are no longer confined to communications but are used to identify and market to prospects, complete transactions, make and receive payments and remittances, and care for customers. The knowledge that operators have about their customers coupled with their skills and assets in identity and authentication, payments, device management, customer care etc. mean that ‘the networks’ can be ‘enablers’ in digital transactions between third-parties – helping them to happen more efficiently and effectively.

Overall, smarter networks will benefit network users – upstream service providers and end users – as well as the mobile network operators and their vendors and partners. Operators will also be competing to be smarter than their peers as, by differentiating here, they gain cost, revenue and performance advantages that will ultimately transform in to higher shareholder returns.

Sponsorship and editorial independence

This report has kindly been sponsored by Tellabs and is freely available. Tellabs developed the initial concepts, and provided STL Partners with the primary input and scope for the report. Research, analysis and the writing of the report itself was carried out independently by STL Partners. The views and conclusions contained herein are those of STL Partners.

About Tellabs

Tellabs logo

Tellabs innovations advance the mobile Internet and help our customers succeed. That’s why 43 of the top 50 global communications service providers choose our mobile, optical, business and services solutions. We help them get ahead by adding revenue, reducing expenses and optimizing networks.

Tellabs (Nasdaq: TLAB) is part of the NASDAQ Global Select Market, Ocean Tomo 300® Patent Index, the S&P 500 and several corporate responsibility indexes including the Maplecroft Climate Innovation Index, FTSE4Good and eight FTSE KLD indexes. http://www.tellabs.com

Executive Summary

Mobile operators no longer growth stocks

Mobile network operators are now valued as utility companies in US and Europe (less so APAC). Investors are not expecting future growth to be higher than GDP and so are demanding money to be returned in the form of high dividends.

Two ‘smart pipes’ strategies available to operators

In his seminal book, Michael Porter identified three generic strategies for companies – ‘Cost leadership’, ‘Differentiation’ and ‘Focus’. Two of these are viable in the mobile telecommunications industry – Cost leadership, or Happy Pipe in STL Partners parlance, and Differentiation, or Full-service Telco 2.0. No network operators have found a Focus strategy to work as limiting the customer base to a segment of the market has not yielded sufficient returns on the high capital investment of building a network. Even MVNOs that have pursued this strategy, such as Helio which targeted Korean nationals in the US, have struggled.

Underpinning the two business strategies are related ‘smart pipe’ approaches – smart network and smart services:

Normal
0

false
false
false

EN-GB
X-NONE
X-NONE


Porter

Strategy

Telco 2.0 strategy

Nature of smartness

Characteristics

Cost leadership

Happy Pipe

Smart network

Cost efficiency – minimal network, IT and commercial costs.  Simple utility offering.

Differentiation

Full-service Telco 2.0

Smart services

Technical and commercial flexibility: improve customer experience by integrating network capabilities with own and third-party services and charging either end user or service provider (or both).

Normal
0

false
false
false

EN-GB
X-NONE
X-NONE

Source: STL Partners

It is important to note that, currently at least, having a smart network is a precursor of smart services.  It would be impossible for an operator to implement a Full-service Telco 2.0 strategy without having significant network intelligence.  Full-service Telco 2.0 is, therefore, an addition to a Happy Pipe strategy.

Smart network strategy good, smart services strategy better

In a survey conducted for this report, it was clear that operators are pursuing ‘smart’ strategies, whether at the network level or extending beyond this into smart services, for three reasons:

  • Revenue growth: protecting existing revenue sources and finding new ones.  This is seen as the single most important driver of building more intelligence.
  • Cost savings: reducing capital and operating costs.
  • Performance improvement: providing customers with an improved customer experience.

Assuming that most mobile operators currently have limited smartness in either network or services, our analysis suggests significant upside in financial performance from successfully implementing either a Happy Pipe or Full-service Telco 2.0 strategy.  Most mobile operators generate Cash Returns on Invested Capital of between 5 and 7%.  For the purposes of our analysis, we have a assumed a baseline of 5.8%.  The lower capital and operator costs of a Happy Pipe strategy could increase this to 7.4% and the successful implementation of a Full-service Telco 2.0 strategy would increase this to a handsome 13.3%:

Normal
0

false
false
false

EN-GB
X-NONE
X-NONE

Telco 2.0 strategy

Nature of smartness

Cash Returns on Invested Capital

As-is – Telco 1.0

Low – relatively dumb

5.8%

Happy Pipe

Smart network

7.4%

Full-service Telco 2.0

Smart services

13.3%

Source: STL Partners

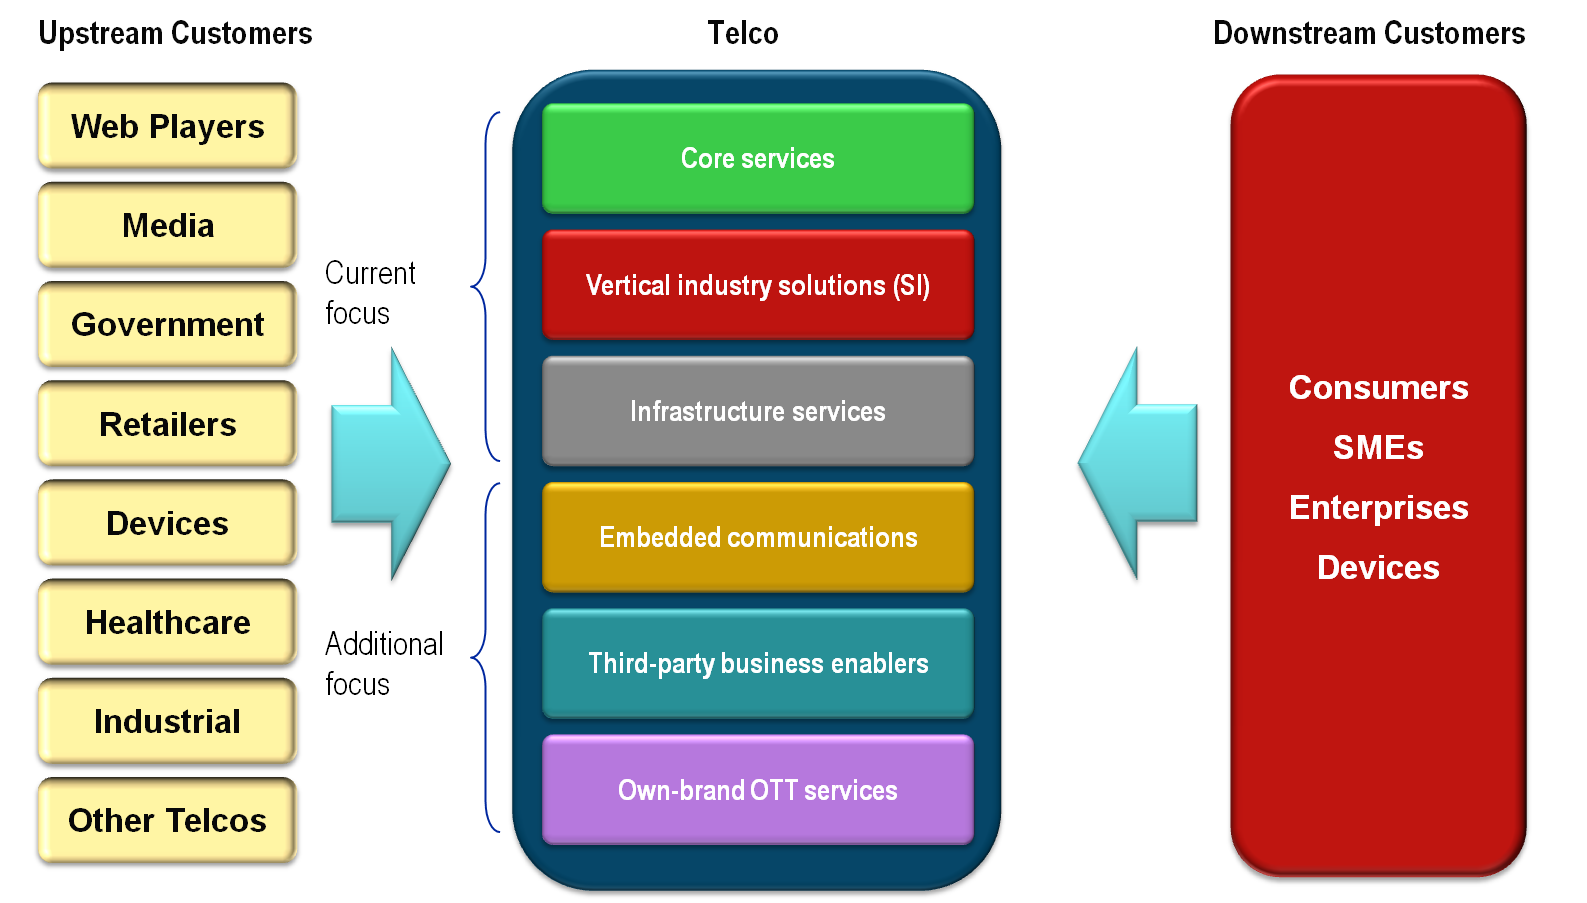
STL Partners has identified six opportunity areas for mobile operators to exploit with a Full-service Telco 2.0 strategy.  Summarised here, these are outlined in detail in the report:

Opportunity Type

Approach

Typical Services

Core Services

Improving revenues and customer loyalty by better design, analytics, and smart use of data in existing services.

Access, Voice and Messaging, Broadband, Standard Wholesale, Generic Enterprise ICT Services (inc. SaaS)

Vertical industry solutions (SI)

Delivery of ICT projects and support to vertical enterprise sectors.

Systems Integration (SI), Vertical CEBP solutions, Vertical ICT, Vertical M2M solutions, and Private Cloud.

Infrastructure services

Optimising cost and revenue structures by buying and selling core telco ICT asset capacity.

Bitstream ADSL, Unbundled Local Loop, MVNOs, Wholesale Wireless, Network Sharing, Cloud – IaaS.

Embedded communications

Enabling wider use of voice, messaging, and data by facilitating access to them and embedding them in new products.

Comes with data, Sender pays delivery, Horizontal M2M Platforms, Voice, Messaging and Data APIs for 3rd Parties.

Third-pary business enablers

Enabling new telco assets (e.g. Customer data) to be leveraged in support of 3rd party business processes.

Telco enabled Identity and Authorisation, Advertising and Marketing, Payments. APIs to non-core services and assets.

Own-brand OTT services

Building value through Telco-owned online properties and ‘Over-the-Top’ services.

Online Media, Enterprise Web Services, Own Brand VOIP services.


Source: STL Partners

Normal
0

false
false
false

EN-GB
X-NONE
X-NONE

Regional approaches to smartness vary

As operators globally experience a slow-down in revenue growth, they are pursuing ways of maintaining margins by reducing costs.  Unsurprisingly therefore, most operators in North America, Europe and Asia-Pacific appear to be pursuing a Happy Pipe/smart network strategy.  Squeezing capital and operating costs and improving network performance is being sought through such approaches as:

  • Physical network sharing – usually involving passive elements such as towers, air-conditioning equipment, generators, technical premises and pylons.
  • Peering data traffic rather than charging (and being charged) for transit.
  • Wi-Fi offload – moving data traffic from the mobile network on to cheaper fixed networks.
  • Distributing content more efficiently through the use of multicast and CDNs.
  • Efficient network configuration and provisioning.
  • Traffic shaping/management via deep-packet inspection (DPI) and policy controls.
  • Network protection – implementing security procedures for abuse/fraud/spam so that network performance is maximised.
  • Device management to ameliorate device impact on network and improve customer experience

Vodafone Asia-Pacific is a good example of an operator pursuing these activities aggressively and as an end in itself rather than as a basis for a Telco 2.0 strategy.  Yota in Russia and Lightsquared in the US are similarly content with being Happy Pipers.

In general, Asia-Pacific has the most disparate set of markets and operators.  Markets vary radically in terms of maturity, structure and regulation and operators seem to polarise into extreme Happy Pipers (Vodafone APAC, China Mobile, Bharti) and Full-Service Telco 2.0 players (NTT Docomo, SK Telecom, SingTel, Globe).

In Telefonica, Europe is the home of the operator with the most complete Telco 2.0 vision globally.  Telefonica has built and acquired a number of ‘smart services’ which appear to be gaining traction including O2 Priority Moments, Jajah, Tuenti and Terra.  Recent structural changes at the company, in which Telefonica Digital was created to focus on opportunities in the digital economy, further indicate the company’s focus on Telco 2.0 and smart services.  Europe too appears to be the most collaborative market.  Vodafone, Telefonica, Orange, Telecom Italia and T-Mobile are all working together on a number of Telco 2.0 projects and, in so doing, seek to generate enough scale to attract upstream developers and downstream end-users.

The sheer scale of the two leading mobile operators in the US, AT&T and Verizon, which have over 100 million subscribers each, means that they are taking a different approach to Telco 2.0.  They are collaborating on one or two opportunities, notably with ISIS, a near-field communications payments solution for mobile, which is a joint offer from AT&T, Verizon and T-Mobile.  However, in the main, there is a high degree of what one interviewee described as ‘Big Bell dogma’ – the view that their company is big enough and powerful enough to take on the OTT players and ‘control’ the experiences of end users in the digital economy.  The US market is more consolidated than Europe (giving the big players more power) but, even so, it seems unlikely that either AT&T or Verizon can keep customers using only their services – the lamented wall garden approach.

Implementing a Telco 2.0 strategy is important but challenging

STL Partners explored both how important and how difficult it is to implement the changes required to deliver a Happy Pipe strategy (outlined in the bullets above) and those needed for Full-service Telco 2.0 strategy, via industry interviews with operators and a quantitative survey.  The key findings of this analysis were:

  • Overall, respondents felt that many activities were important as part of a smart strategy.  In our survey, all except two activity areas – Femto/pico underlay and Enhanced switches (vs. routers) – were rated by more than 50% of respondents as either ‘Quite important’ or ‘Very important’ (see chart below).
  • Activities associated with a Full-service Telco 2.0 strategy were rated as particularly important:
  • Making operator assets available via APIs, Differentiated pricing and charging and Personalised and differentiated services were ranked 1, 2 and 3 out of the thirteen activities.
  • Few considered that any of the actions were dangerous and could destroy value, although Physical network sharing and Traffic shaping/DPI were most often cited here.
Smart Networks - important implementation factors to MNOs
Source: STL Partners/Telco 2.0 & Tellabs ‘Smart pipes’ survey, July 2011, n=107

NOTE: Overall ranking was based on a weighted scoring policy of Very important +4, Quite important +3, Not that important +2, Unimportant +1, Dangerous -4.

Overall, most respondents to the survey and people we spoke with felt that operators had more chance in delivering a Happy Pipe strategy and that only a few Tier 1 operators would be successful with a Full-Service Telco 2.0 strategy.  For both strategies, they were surprisingly sceptical about operators’ ability to implement the necessary changes.  Five reasons were cited as major barriers to success and were particularly big when considering a Full-Service Telco 2.0 strategy:

  1. Competition from internet players.  Google, Apple, Facebook et al preventing operators from expanding their role in the digital economy.
  2. Difficulty in building a viable ecosystem. Bringing together the required players for such things as near-field communications (NFC) mobile payments and sharing value among them.
  3. Lack of mobile operators skills.  The failure of operators to develop or exploit key skills required for facilitating transactions such as customer data management and privacy.
  4. Culture.  Being too wedded to existing products, services and business models to alter the direction of the super-tanker.
  5. Organisation structure. Putting in place the people and processes to manage the change.

Looking at the specific activities required to build smartness, it was clear that those required for a Full-service Telco 2.0/smart services strategy are considered the hardest to implement (see chart below):

  • Personalised and differentiated services via use of customer data – content, advertising, etc.
  • Making operator assets available to end users and other service providers – location, presence, ID, payments
  • Differentiated pricing and charging based on customer segment, service, QoS
Smart Networks - how challenging are the changes?
Source: STL Partners/Telco 2.0 & Tellabs ‘Smart pipes’ survey, July 2011, n=100

NOTE: Overall ranking was based on a weighted scoring policy of Very easy +5, Relatively straightforward +4, Manageable +3, Quite difficult +2, Very difficult -2.

Conclusions and recommendations

By comparing the relative importance of specific activities against how easy they are to implement, we were able to classify them into four categories:

Category

Importance for delivering smart strategy

Relative ease of implementation

Must get right

High

Easy

Strive for new role

High

Difficult

Housekeeping

Low

Easy

Forget

Low

Difficult

Rating of factors needed for Telco 2.0 'Smart Pipes' and 'Full Services' Strategies
Source: STL Partners/Telco 2.0 & Tellabs ‘Smart pipes’ survey, July 2011, n=100

Unfortunately, as the chart above shows, no activities fall clearly into the ‘Forget’ categories but there are some clear priorities:

  • A Full-service Telco 2.0 strategy is about striving for a new role in the digital economy and is probably most appropriate for Tier 1 MNOs, since it is going to require substantial scale and investment in new skills such as software and application development and customer data.  It will also require the development of new partnerships and ecosystems and complex commercial arrangements with players from other industries (e.g. banking). 
  • There is a cluster of smart network activities that are individually relatively straightforward to implement and will yield a big bang for the buck if investments are made – the ‘Must get right’ group:
  • More efficient network configuration and provisioning;
  • Strengthen network security to cope with abuse and fraud;
  • Improve device management (and cooperation with handset manufacturers and content players) to reduce the impact of smartphone burden on the network;

Although deemed more marginal in our survey, we would include as equally important:

  • Traffic shaping and DPI which, in many cases, underpins various smart services opportunities such as differentiated pricing based on QoS and Multicast and CDNs which are proven in the fixed world and likely to be equally beneficial in a video-dominated mobile one.

There is second cluster of smart network activities which appear to be equally easy (or difficult) to implement but are deemed by respondents to be lower value and therefore fall into a lower ‘Housekeeping’ category:

  • Wi-Fi offload – we were surprised by this given the emphasis placed on this by NTT Docomo, China Mobile, AT&T, O2 and others;
  • Peering (vs. transit) and Enhanced switches  – this is surely business-as-usual for all MNOs;
  • Femto/Pico underlay – generally felt to be of limited importance by respondents although a few cited its importance in pushing network intelligence to the edge which would enable MNOs to more easily deliver differentiated QoS and more innovative retail and wholesale revenue models;
  • Physical network sharing – again, a surprising result given the keenness of the capital markets on this strategy. 


Overall, it appears that mobile network operators need to continue to invest resources in developing smart networks but that a clear prioritisation of efforts is needed given the multitude of ‘moving parts’ required to develop a smart network that will deliver a successful Happy Pipe strategy.

A successful Full-Service Telco 2.0 strategy is likely to be extremely profitable for a mobile network operator and would result in a substantial increase in share price.  But delivering this remains a major challenge and investors are sceptical.  Collaboration, experimentation and investment are important facets of a Telco 2.0 implementation strategy as they drive scale, learning and innovation respectively.  Given the demands of investors for dividend yields, investment is only likely to be available if an operator becomes more efficient, so implementing a Happy Pipe strategy which reduces capital and operating costs is critical.


Report Contents


  • Executive Summary
  • Mobile network operator challenges
  • The future could still be bright
  • Defining a ‘smart’ network
  • Understanding operator strategies
  • Video: Case study in delivering differentiation and cost leadership
  • The benefits of Smart on CROIC
  • Implementing a ‘smart’ strategy
  • Conclusions and recommendations

Report Figures


  • Figure 1: Pressure from all sides for operators
  • Figure 2: Vodafone historical dividend yield – from growth to income
  • Figure 3: Unimpressed capital markets and falling employment levels
  • Figure 4: Porter and Telco 2.0 competitive strategies
  • Figure 5: Defining Differentiation/Telco 2.0
  • Figure 6 – The Six Opportunity Areas – Approach, Typical Services and Examples
  • Figure 7: Defining Cost Leadership/Happy Pipe
  • Figure 8: Defining ‘smartness’
  • Figure 9: Telco 2.0 survey – Defining smartness
  • Figure 10: NTT’s smart content delivery system – a prelude to mobile CDNs?
  • Figure 11: Vodafone India’s ARPU levels are now below $4/month, illustrating the need for a ‘smart network’ approach
  • Figure 12: China Mobile’s WLAN strategy for coverage, capacity and cost control
  • Figure 13: GCash – Globe’s text-based payments service
  • Figure 14: PowerOn – SingTel’s on-demand business services
  • Figure 15: Telefonica’s Full-service Telco 2.0 strategy
  • Figure 16: Vodafone – main messages are about being an efficient data pipe
  • Figure 17: Collaboration with other operators key to smart services strategy
  • Figure 18: Verizon Wireless and Skype offering
  • Figure 19: Content delivery with and without a CDN
  • Figure 20: CDN benefits to consumers are substantial
  • Figure 21: Cash Returns on Invest Capital of different Telco 2.0 opportunity areas
  • Figure 22: The benefits of smart to a MNO are tangible and significant
  • Figure 23: Telco 2.0 Survey – benefits of smart to MNOs
  • Figure 24: Telco 2.0 survey – MNO chances of success with smart strategies
  • Figure 25: Telco 2.0 survey – lots of moving parts required for ‘smartness’
  • Figure 26: Telco 2.0 survey – Differentiation via smart services is particularly challenging
  • Figure 27: Telco 2.0 survey – Implementing changes is challenging
  • Figure 28: Telco 2.0 survey – Prioritising smart implementation activities


The Roadmap to New Telco 2.0 Business Models

$375Bn per annum Growth or Brutal Retrenchment? Which route will Telcos take?

Over the last three years, the Telco 2.0 Initiative has identified new business model growth opportunities for telcos of $375Bn p.a. in mature markets alone (see the ‘$125Bn Telco 2.0 ‘Two-Sided’ Market Opportunity’ and ‘New Mobile, Fixed and Wholesale Broadband Business Models’ Strategy Reports). In that time, most of the major operators have started to integrate elements of Telco 2.0 thinking into their strategic plans and some have begun to communicate these to investors.

But, as they struggle with the harsh realities of the seismic shift from being predominantly voice-centric to data-centric businesses, telcos now find themselves:

  • Facing rapidly changing consumer behaviours and powerful new types of competitors;
  • Investing heavily in infrastructure, without a clear payback;
  • Operating under less benign regulatory environments, which constrain their actions;
  • Being milked for dividends by shareholders, unable to invest in innovation.

As a result, far from yet realising the innovative growth potential we identified, many telcos around the world seem challenged to make the bold moves needed to make their business models sustainable, leaving them facing retrenchment and potentially ultimately utility status, while other players in the digital economy prosper.

In our new 284 page strategy report – ‘The Roadmap to Telco 2.0 Business Models’ – we describe the transformational path the telecoms industry needs to take to carve out a more valuable role in the evolving ‘digital economy’. Based on the output from 5 intensive senior executive ‘brainstorms’ attended by over 1000 industry leaders, detailed analysis of the needs of ‘upstream’ industries and ‘downstream’ end users markets, and with the input from members and partners of the Telco 2.0 Initiative from across the world, the report specifically describes:

  • A new ‘Telco 2.0 Opportunity Framework’ for planning revenue growth;
  • The critical changes needed to telco innovation processes;
  • The strategic priorities and options for different types of telcos in different markets;
  • Best practice case studies of business model innovation.

The ‘Roadmap’ Report Builds on Telco 2.0’s Original ‘Two-Sided’ Telecoms Business Model

Updated Telco 2.0 Industry Framework

Source: The Roadmap to New Telco 2.0 Business Models


Who should read this report

The report is for strategy decision makers and influences across the TMT (Telecoms, Media and Technology) sector. In particular, CxOs, Strategists, Technologists, Marketers, Product Managers, and Legal and Regulatory leaders in telecoms operators, vendors, consultants, and analyst companies. It will also be valuable to those managing or considering medium to long-term investment in the telecoms and adjacent industries, and to regulators and legislators.

It provides fresh, creative ideas to:

Grow revenues beyond current projections by:

  • Protecting revenues from existing customers;
  • Extending services to new customers;
  • Generating new service offering and revenues.

Stay relevant with customers through:

  • A broader range of services and offers;
  • More personalised services;
  • Greater interaction with customers.

Evolve business models by:

  • Moving from a one-sided to a two-sided business model;
  • Generating cross-platform network effects – between service providers and customers;
  • Exploiting existing latent assets, skills and relationships.


The Six Telco 2.0 Opportunity Areas

Six Telco 2.0 Opportunity Types

Source: The Roadmap to New Telco 2.0 Business Models

What are the Key Questions the Report Answers?

For Telcos:

  • Where should your company be investing for growth?
  • What is ‘best practice’ in telecoms Telco 2.0 business model innovation and how does your company compare to it?
  • Which additional strategies should you consider, and which should you avoid?
  • What are the key emerging trends to monitor?
  • What actions are required in the areas of value proposition, technology, value / partner network, and finances?

For Vendors and Partners:

  • How to segment telecoms operators?
  • How well does your offering support Telco 2.0 strategies and transformation needs in your key customers?
  • What are the most attractive new areas in which you could support telcos in business model innovation?

For Investors and Regulators:

  • What are and will be the main new categories of telcos/CSPs?
  • What are the principle opportunity areas for operators?
  • What are and will be operator’s main strategic considerations with respect to new business models?
  • What are the major regulatory considerations of new business models?
  • What are the main advantages and disadvantages that telcos have in each opportunity area?

Contents

  • Executive Summary & Introduction
  • Pressures on Operators
  • The new Telco 2.0 Framework
  • Principles of Innovation and Services Delivery
  • – Strategic Positioning
  • – Design
  • – Development and delivery
  • Categorising telcos
  • Category 1: Leading international operators
  • Category 2: Regional leaders
  • Category 3: Wholesale and business-focused telcos
  • Category 4: Challengers & disruptors
  • Category 5: Smaller national leaders
  • Conclusions and Recommendations