Fibre for 5G and edge: Who does it and how to build it?

Opportunities for fibre network operators

4G/5G densification and the growth in edge end points will place fresh demands on telecoms network infrastructure to deliver high bandwidth connections to new locations. Many of these will be sites on the streets of urban centres without existing connections, where installation of new fibre cables is costly. This will require careful planning and optimum selection of existing infrastructure to minimise costs and strengthen the business cases for fibre deployment.

While much of the growth in deployment of small cells and edge end points will be on private sites, their deployment in public areas, in support of public network services, will pose specific challenges to providing the broad bandwidth connectivity required. This includes both backhaul from cell sites and edge end points to the fibre transport network, plus any fronthaul needs for new open RAN deployments, from baseband equipment to radio units and antennas. In almost all cases this will entail installing new fibre in areas where laying a new duct is at its most expensive, although in a few cases fixed point-to-point radio links could be deployed instead.

Enter your details below to request an extract of the report

Global deployments of small cells and non-telco edge end points
in public areas

Source: Small Cell Forum, STL research and analysis

In addition, operators of 5G small cells and public cloud edge sites will require access to fibre links for backhaul to their core networks to provide the high bandwidths required. In some cases, they may need multiple fibres, especially if diverse paths are needed for security and resilience purposes.

Many newer networks have been built for a specific purpose, such as residential or business FTTP. Others are trunk routes to connect large businesses and data centres, and may serve local, regional, national or international areas. In addition, changing regulations have encouraged the creation of new businesses such as neutral hosts (also called “open access” for wholesale fibre) and, as a result, the supply side of the market is composed of an increasing variety of players. If this pattern were to continue, then it would very likely prove uneconomic to build dedicated networks for some applications, such as small cell densification or some standalone edge applications.

However, provided build qualities meet the required standard and costs can be contained there is no reason why networks deployed to address one market cannot be extended and repurposed to serve others. For new fibre builds being planned, it is also important to consider these new FTTX opportunities upfront and in some detail, rather than as an afterthought or just a throw-away bullet point on investor slide-decks.  

This report looks at the opportunities these developments offer to fibre network operators and considers the business cases that need to be made. It looks at the means and scope for minimising costs necessary to profitably satisfy the widest range of needs.

The fibre market is changing

FTTH/P has been largely satisfied in many countries, and even in slower markets such as the UK and Germany, the bulk of the network is expected to be in place by 2025/6 for most urban premises, at least on the basis of “homes passed”, if not actually connected.

By contrast the requirement of higher bandwidth connectivity for mobile base stations being upgraded from 3G to 4G and 5G is current and ongoing. Demand for links to small cells needed to support 5G densification, standalone edge, and smart city applications is only just beginning to appear and is likely to develop significantly over the next 10 years or more. In future high speed broadband links will be required to support an increasing range of applications for different organisations: for example, autonomous and semi-autonomous vehicle (V2X) applications operated by government or city authorities.

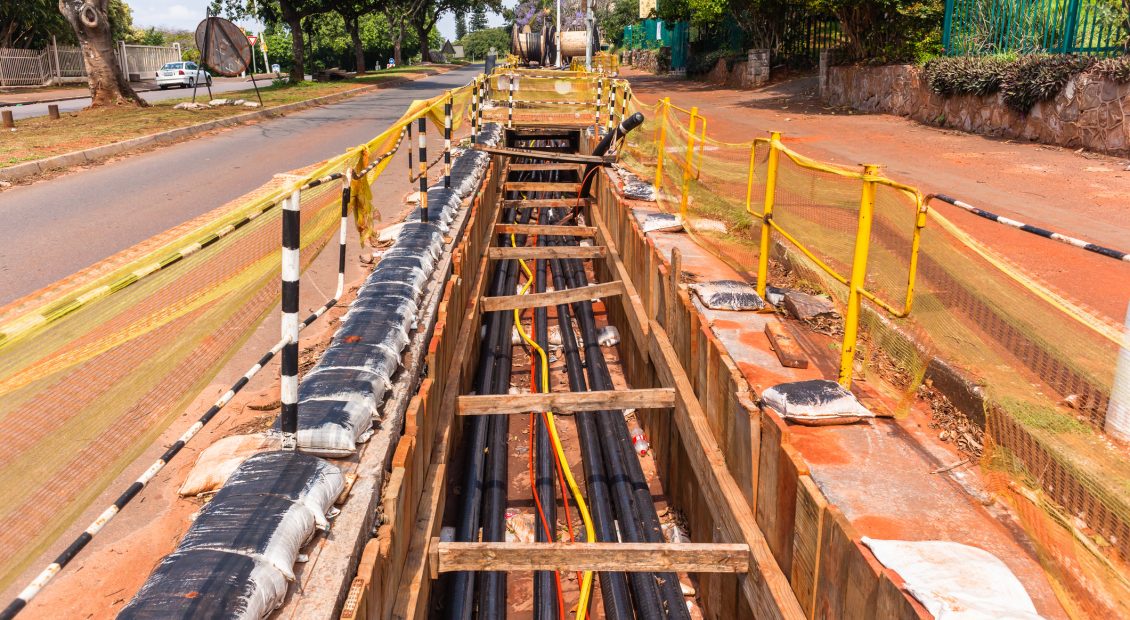
Both densification and edge will need local connections for fronthaul and backhaul as well as longer connections to provide backhaul to the core network. Building from scratch is expensive owing to the high costs associated with digging in the public highway, especially in urban centres. Digging can be complex, depending on the surfaces and buried services encountered, and extensions after the initial main build can be very expensive.

Laying fibre and ducts are a long-term investment and can usually be amortised over 15 to 20 years.  Nevertheless, network operators need to be sure of a good return on their investment and therefore need to find ways to minimise costs while maximising revenues. In markets with multiple players, there will also be a desire by potential acquisition targets to underscore their valuations, by maximising their addressable market, while reducing any post-merger remedial or expansion costs. Good planning, including watching for new opportunities and trends and the smart use of existing assets to minimise costs, can help ensure this.

  • Serving multiple markets through good forecasting and planning can help maximise revenues.
  • Operators and others can make use of various infrastructure assets to reduce costs, including incumbents’ physical duct/pole infrastructure sewers, disused water and hydraulic pipes, neutral hosts’ networks, council ducts, and traffic management ducts. Obviously these will not extend everywhere that fibre is required, but can make a meaningful contribution in many situations.

The remaining sections of this report examine in more detail the specific opportunities offered to fixed network operators, by densification of mobile base stations and growth of edge computing. It covers:

  • Market demand, including drivers of demand, and end users’ and the industry’s needs and options
  • The changing supply side and regulation
  • Technologies, build options and costs
  • How to maximise revenues and returns on investment.

Table of Contents

  • Executive Summary
  • Introduction
    • The fibre market is changing
  • Small cell and edge: Demand
    • Demand for small cells
    • Demand for edge end points
  • Small cell and edge: Supply
    • The changing network supply structure
  • Build options
    • Pros and cons of seven building options
  • How do they compare on costs?
  • Impact of regulation and policy
  • How to mitigate unforeseen costs
  • The business case
  • Conclusions
  • Index

Related Research


Enter your details below to request an extract of the report

Beating the crash: What’s coming?

Signs of tougher times

Tough times are ahead…

As we look ahead, the world faces a number of significant challenges:

  • Global / OECD consumer confidence is diving to startling new depths as people increasingly feel the impact of inflation, supply constraints and a cost of living crisis.
  • This follows the war in Ukraine, the Covid pandemic and long Covid, stresses resulting from diverging political ideologies, growing social unrest, and the ever increasing realisation of the impact of climate change.
  • These seismic tensions are all driven by nearly 8 billion (and growing) people vying for resources and a vision of the future that they can continue to thrive in.

…but it’s not our first rodeo…

We have previously written about, for example:

And before that, there was the Credit Crunch series (2008), the Eurozone Crisis (2012), and technology and market disruptions too numerous to name.

There is always a temptation to think that the latest crisis is the worst. Each one tends to temporarily obliterate one’s view of the future as our imaginations are so absorbed in dealing with the nearby threat that all other considerations become secondary.

…and we believe we can bring some hope

Our solution to these challenges is two-fold. First, there is a lot that can be learned by looking at the lessons from previous traumas. Secondly, it is extremely helpful to be able to position all the individual events within an overall context, as it enables us to more rapidly reorientate after the latest shock.

Our context is The Coordination Age – the vision that the world is entering into a new era where:

  • The primary need is to make better use of available resources (e.g. money, carbon, time, assets, etc)
  • And that connecting technologies (e.g. telecommunications, data, automation and AI) are key elements of the solution.

Enter your details below to request an extract of the report

Making the Coordination Age work

making-the-coordination-age-work

Source: STL Partners

This report uses these learnings to look ahead to what we see as a challenging time. While some of the forces we outline in this report may seem alarming, this is not a pessimistic picture. We believe that the vision we describe brings opportunities for telecoms – but only if leaders in telecoms and elsewhere act on the vision. We are striving to make this happen, and we hope we can help you do that too.

A scale of discovery

To help contextualise the many forces of change, we have developed a six-stage schematic to generalise how people deal with new forces and changes in their lives. It progresses from the first recognition of a new theme or issue through to normalisation, the point where something is no longer new or different. The graphic below highlights the six stages, and general heuristic descriptions of what you might hear said, risks and threats, mitigations, and the general psychological and emotional mindset of those processing the change or issue in question.

Six stages of dealing with new ideas

six-stages-dealing-with-new-ideas-stl-partners

Source: STL Partners

The body of the report covers the drivers, their impact and consequences for telecoms:

  • Economic drivers, such as consumer confidence, inflation, and rising living costs
  • Environmental drivers, including climate change and carbon reduction
  • Political drivers, including the War in Ukraine, China / US tensions, trade wars and tensions
  • Social drivers, including Covid and Long Covid, inequalities and social polarisation.

Economic drivers: A crisis of confidence

In this section we examine drivers in consumer confidence, inflation / cost-of-living concerns and the consequences for telecoms.

Consumer confidence: An all-time low

The OECD consumer confidence index is a barometer of consumer sentiment. It reflects people’s confidence in their economic prospects. The chart below shows that it is currently reaching record new lows.

The OECD Consumer confidence index is at its lowest ever level

OECD-consumer-inflation-index-june-2022

Source: OECD

This means that consumers feel extremely pessimistic about their economic prospects. The average score is now below where it was at the peak of anxiety about Covid in early 2020, and below where it was in the financial crash in 2008-09. Indeed, the OECD average is now at its lowest ever level since global measures were introduced in the early 1970s, with only Mexico and Indonesia bucking the downward trend.

People are now preparing for a tough period in their economies. Some are worried about making ends meet – having enough to live to the standard they normally expect. This usually means that they will look to cut back on spending, especially for non-essential things.

Inflation is worrying everyone in Summer 2023

The pressures behind this trend are a generalised concern about inflation (rising prices on essential items like food) leading to a cost-of-living crisis.

Inflation overtook other global concerns in April 2022

Inflation-overtook-global-concerns-april-2022-stl-partners

Source: Ipsos

The Google trends chart below shows search interest in ‘inflation’ globally, which is an even more immediate signal of concern. It clearly spikes in July 2022.

Google Trends – searches for “inflation” spiked in Summer 2022

google-trends-searches-for-inflation-summer-2022-stl-partners

Source: Google

The problem is not confined to one or two economies: it is widespread, as the image from the interactive chart below shows.

inflation-global-challenge-2022-stl-partners

Source: FT

The rest of the analysis in this report reviews the macro-economic trends – i.e. the economic, environmental, political and social drivers of change. In a second report, we will cover telecoms industry trends, including technologies, policy, propositions and industry structure.


Table of Contents

  • Executive Summary
    • Not one crash, but many
    • 1. Actively realigning with stakeholders
    • 2. Accelerating operational innovation
    • 3. Enhancing resilience and customer security offerings
    • Next steps
  • Introduction: Signs of tougher times
    • A scale of discovery
  • Economic drivers: A crisis of confidence
    • Consumer confidence: An all-time low
    • Inflation is worrying everyone in summer 2022
    • Interest rates: A blunt tool?
    • Stock markets: Not quite sure…yet
    • Moving out of denial on economic problems
    • Consequences in telecoms demand
    • Recommendations
  • Environmental factors: Heating up fast
    • Climate change: Denial is hard these days
    • Decarbonisation: Digitising the industrial landscape, fast
    • Environmental concerns are now mainstream
    • Consequences for telecoms
    • Recommendations
  • Political: Drawing new lines
    • Ideo-conflict: Who’s side are you on?
    • The war in Ukraine: The first Coordination Age war?
    • China and Taiwan: Watching, waiting, wondering
    • Trade wars and barriers in general
    • Global instability: More trouble ahead
    • Consequences for telecoms
    • Recommendations
  • Social: A new order
    • Covid and Long Covid: Living with the virus
    • Rising resentment of inequalities
    • The United Nations Sustainable Development Goals
    • Consequences and recommendations for telecoms
  • Analysis
    • Getting the news in context
  • Appendix 1: Waste, pollution and air quality
    • Waste and pollution: Cleaning up
    • Refugees and migrations: Seeking solace in troubling times
  • Appendix 2: The 17 Sustainable Development Goals


Enter your details below to request an extract of the report


Telco Cloud Deployment Tracker: 5G core deep dive

Deep dive: 5G core deployments 

In this July 2022 update to STL Partners’ Telco Cloud Deployment Tracker, we present granular information on 5G core launches. They fall into three categories:

  • 5G Non-standalone core (5G NSA core) deployments: The 5G NSA core (agreed as part of 3GPP Release in December 2017), involves using a virtualised and upgraded version of the existing 4G core (or EPC) to support 5G New Radio (NR) wireless transmission in tandem with existing LTE services. This was the first form of 5G to be launched and still accounts for 75% of all 5G core network deployments in our Tracker.
  • 5G Standalone core (5G SA core) deployments: The SA core is a completely new and 5G-only core. It has a simplified, cloud-native and distributed architecture, and is designed to support services and functions such as network slicing, Ultra-Reliable Low-Latency Communications (URLLC) and enhanced Machine-Type Communications (eMTC, i.e. massive IoT). Our Tracker indicates that the upcoming wave of 5G core deployments in 2022 and 2023 will be mostly 5G SA core.
  • Converged 5G NSA/SA core deployments: this is when a dual-mode NSA and SA platform is deployed; in most cases, the NSA core results from the upgrade of an existing LTE core (EPC) to support 5G signalling and radio. The principle behind a converged NSA/SA core is the ability to orchestrate different combinations of containerised network functions, and automatically and dynamically flip over from an NSA to an SA configuration, in tandem – for example – with other features and services such as Dynamic Spectrum Sharing and the needs of different network slices. For this reason, launching a converged NSA/SA platform is a marker of a more cloud-native approach in comparison with a simple 5G NSA launch. Ericsson is the most commonly found vendor for this type of platform with a handful coming from Huawei, Samsung and WorkingGroupTwo. Albeit interesting, converged 5G NSA/SA core deployments remain a minority (7% of all 5G core deployments over the 2018-2023 period) and most of our commentary will therefore focus on 5G NSA and 5G SA core launches.

Enter your details below to request an extract of the report

75% of 5G cores are still Non-standalone (NSA)

Global 5G core deployments by type, 2018–23

  • There is renewed activity this year in 5G core launches since the total number of 5G core deployments so far in 2022 (effective and in progress) stands at 49, above the 47 logged in the whole of 2021. At the very least, total 5G deployments in 2022 will settle between the level of 2021 and the peak of 2020 (97).
  • 5G in whichever form now exists in most places where it was both in demand and affordable; but there remain large economies where it is yet to be launched: Turkey, Russia and most notably India. It also remains to be launched in most of Africa.
  • In countries with 5G, the next phase of launches, which will see the migration of NSA to SA cores, has yet to take place on a significant scale.
  • To date, 75% of all 5G cores are NSA. However, 5G SA will outstrip NSA in terms of deployments in 2022 and represent 24 of the 49 launches this year, or 34 if one includes converged NSA/SA cores as part of the total.
  • All but one of the 5G launches announced for 2023 are standalone; they all involve Tier-1 MNOs including Orange (in its European footprint involving Ericsson and Nokia), NTT Docomo in Japan and Verizon in the US.

The upcoming wave of SA core (and open / vRAN) represents an evolution towards cloud-native

  • Cloud-native functions or CNFs are software designed from the ground up for deployment and operation in the cloud with:​
  • Portability across any hardware infrastructure or virtualisation platform​
  • Modularity and openness, with components from multiple vendors able to be flexibly swapped in and out based on a shared set of compute and OS resources, and open APIs (in particular, via software ‘containers’)​
  • Automated orchestration and lifecycle management, with individual micro-services (software sub-components) able to be independently modified / upgraded, and automatically re-orchestrated and service-chained based on a persistent, API-based, ‘declarative’ framework (one which states the desired outcome, with the service chain organising itself to deliver the outcome in the most efficient way)​
  • Compute, resource, and software efficiency: as a concomitant of the automated, lean and logically optimal characteristics described above, CNFs are more efficient (both functionally and in terms of operating costs) and consume fewer compute and energy resources.​
  • Scalability and flexibility, as individual functions (for example, distributed user plane functions in 5G networks) can be scaled up or down instantly and dynamically in response to overall traffic flows or the needs of individual services​
  • Programmability, as network functions are now entirely based on software components that can be programmed and combined in a highly flexible manner in accordance with the needs of individual services and use contexts, via open APIs.​

Previous telco cloud tracker releases and related research

Each new release of the tracker is global, but is accompanied by an analytical report which focusses on trends in given regions from time to time:

Enter your details below to request an extract of the report

Telco Cloud Deployment Tracker: Open RAN deep dive

Telco Cloud: Open RAN is a work in progress

This report accompanies the latest release and quarterly update of STL Partners ‘Telco Cloud Deployment Tracker’ database. This contains data on deployments of VNFs (Virtual Network Functions), CNFs (cloud-native network functions) and SDN (Software Defined Networking) in the networks of the leading telcos worldwide. In this update we have added some additional categories to the database to reflect the different types of virtualised / open RAN:

  1. Open RAN / O-RAN: Fully open, disaggregated, virtualised / cloud-native, with CU / DU split
  2. vRAN: Virtualised CU/DU, with open interfaces but implemented as an integrated, single-vendor platform
  3. Cloud RAN: Single-vendor, virtualised / centralised BU, or CU only, with proprietary / closed interfaces

Cloud RAN is the most limited form of virtualised RAN: It is based on porting part or all of the functionality of the legacy, appliance-based BU into a Virtual Machine. vRAN and open RAN are much more significant, in both technology and business-model terms, breaking open all parts of the RAN to more competition and opportunities for innovation.

Accordingly, the report presents data on only open RAN and vRAN deployments however a granular analysis of each category of RAN deployment can be carried out using the Telco Cloud Tracker tool.

Access our online Telco Cloud Deployment Tracker tool here

Download the additional file for the full dataset of Telco Cloud deployments

Enter your details below to request an extract of the report

Open RAN and vRAN deployments, 2018 – 2022

Open-RAN-Deployments-Apr-2021-STL-Partners

Source: STL Partners

Open RAN and vRAN

Both Open RAN and vRAN are virtualised (with the exception of NTT DoCoMo as outlined in the report), but ‘open RAN’ implies full disaggregation of the different parts of the RAN (hardware, software and radio), and open interfaces between them. By contrast, vRAN incorporates the open interfaces but is generally deployed as a pre-integrated, single-vendor solution: hardware, software and radio supplied by the same vendor.

To date, there have been significantly more open RAN than vRAN deployments. But vRAN is emerging as a potentially competitive alternative to pure open RAN: offering the same operational benefits and – in theory – multi-vendor openness, but without the overhead of integrating components from multiple vendors, and a ‘single neck to choke’ if things go wrong. Deployments in 2020 were mostly small-scale and / or 4G, including trials which continued to carry live traffic after the trial period came to an end.

The stark contrast between 2021 and 2022 reflects a slight hiatus in commercial deployments as work intensified around integration and operational models, trials, performance optimisation, and cost economics. However, major deployments are expected in 2022, including greenfield networks 1&1 Drillisch (Germany) and DISH (US), Verizon, Vodafone UK, and MTN (Africa and ME).

Scope and content of the Tracker

The data in the latest update of our interactive tool and database covers the period up to March 2022, although reference is made in the report to events and deployments after that date. The data is drawn predominantly from public-domain information contained in news releases from operators and vendors, along with reputable industry media.

We apply the term ‘deployment’ to refer to the total set of VNFs, CNFs or SDN technology, and their associated management software and infrastructure, deployed at an operator – or at one or more of an operator’s opcos or natcos – in order to achieve a defined objective or support particular services (in the spreadsheet, we designate these as the ‘primary purpose’ of the deployment). For example, this could be:

  • to deploy a 5G standalone core
  • to launch a software-defined WAN (SD-WAN) service
  • or to construct a ‘telco cloud’ or NFV infrastructure (NFVi): a cloud infrastructure platform on which virtualised network services can be introduced and operated.

The Tracker is provided as an interactive tool containing line-by-line analysis of over 900 individual deployments of VNFs, CNFs or SDN technology, which can be used to drill down by:

  • Region where deployed
  • Operator
  • Technology vendor
  • Primary purpose
  • Type of telco cloud function deployed
  • …and more filters

Telco Cloud Trial Deployment Tracker

Take a look at the trial of our interactive tool with live, commercial deployments of VNFs, CNFs and SDN technologies worldwide

Previous telco cloud tracker releases

Each new release of the tracker is global, but is accompanied by an analytical report which focusses on trends in given regions from time to time:


Enter your details below to request an extract of the report

Convergence, coexistence or competition: How will 5G and Wi-Fi 6 interact?

Introduction: Wi-Fi vs cellular

The debate around Wi-Fi and cellular convergence is not new. However, the introduction of next generation mobile and cellular technologies, Wi-Fi 6 and 5G, has once again reignited this debate. Further impetus for discussion has been provided by industry bodies, including the Wi-Fi Alliance, IEEE, Wireless Broadband Alliance (WBA), Next Generation Mobile Networks Alliance (NGMN) and 3GPP, developing standards to enable the convergence between 5G and Wi-Fi.

5G, introduced by 3GPP’s release 15 in 2018, and deployed internationally by telecoms operators since 2019, is considered a significant upgrade to 4G and LTE. Its improved capabilities such as increased speed, coverage, reliability, and security promise to enable a host of new use cases in a wide range of industries.

Simultaneously, Wi-Fi has evolved into its 6th generation, with Wi-Fi 6 technology emerging in 2019. This new evolution of Wi-Fi can provide speeds that are 40% higher than its predecessor, as well as improved visibility and transparency for better network control and management. Some of the key enhancements of the new generation are detailed in the table below.

Figure 1: There are a number of key differences between next generation Wi-Fi and cellular connectivity

key-differences-next-generation-wifi-cellular-activity

Source: STL Partners

The market context for convergence

Industry bodies have been promoting convergence

The Wireless Broadband Alliance (WBA) and the Next Generation Mobile Networks Alliance (NGMN) produced a joint report in 2021 promoting the future convergence between Wi-Fi and 5G. The report highlights the merits of convergence, noting a number of use cases and verticals that could stand to benefit from closer alignment between the two technologies. Further, the 3GPP have increasingly sought to include standards with each new release that enable convergence between Wi-Fi and cellular. 3GPP’s release 8 introduced the concept of ‘access network discovery and selection function’ (ANDSF) which allowed user equipment to discover non-3GPP access networks, including Wi-Fi. In 2018, release 15 included optional 3GPP access for native 5G services via these non 3GPP access networks. Most recently, release 16 introduced ‘access traffic steering, splitting and switching’ (ATSSS), allowing both 3GPP and non-3GPP connectivity to multiple access networks, which is a key enabler of the resilience model of convergence. Similarly, the IEEE, sponsored by the Wi-Fi Alliance has been discussing the potential pathways to convergence for a number of years. However, these bodies are less vocal about future convergence possibilities, likely given Wi-Fi’s current dominance in the provision of enterprise wireless connectivity.

Spectrum auctions

The possibility of convergence has been further supported in recent years by releases of spectrum in the 6GHz band for unlicensed use in the USA, UK, South Korea and other major markets. Spectrum in the same 6GHz range can also be used to support 5G connectivity in addition to the existing 5GHz band. With the ability to share the same spectrum, this could theoretically promote closer coupling of 5G and Wi-Fi. However, given similar propagation characteristics for each technology, it remains to be proven as to whether the increasing availability of spectrum will help to push convergence forward.

There is a disconnect between theory and practice

While standards define what is possible, the purpose of industry bodies is to be future-focused, paving the way for the rest of the ecosystem to follow. What is possible in theory must be supported in practice, and the supply-side ecosystem, including network operators, system integrators (SIs), network equipment providers (NEPs) and hardware manufacturers have a role to play if convergence is to become more widespread.

Similarly, for devices to access converged networks, they must be equipped with 5G and Wi-Fi chips. While mobile phones support both connectivity types, the vast majority of connected devices that enterprises deploy are Wi-Fi only. Until 5G chips or modules become more widely available, and used in a greater number of devices, convergence will likely remain relegated to specific use cases. For example, use cases that depend on the mobility afforded by being able to ‘switch over’ from Wi-Fi to mobile seamlessly, or highly mission critical use cases in verticals such as manufacturing that can justify the investment in (private) 5G as a back-up to Wi-Fi. We discuss both of these use cases in more detail in the report. The full ecosystem must ultimately work in concert for convergence to become a realistic possibility for a larger number of enterprises.


Table of Contents

  • Executive Summary
    • Convergence is still immature on both the demand and supply sides
    • What do we mean by co-existence, convergence and competition?
  • Preface
  • Introduction
  • The market context for convergence
    • Industry bodies have been promoting convergence
    • Spectrum auctions
    • There is a disconnect between theory and practice
    • There are two key use cases for convergence
  • A future trend towards convergence is still immature
    • Regional differences in the maturity of 5G
    • Inconsistent definitions
    • Who manages convergence?
  • It is still too early to see high levels of demand for convergence from enterprise customers
    • Wi-Fi is the incumbent, 5G must overcome a number of barriers before it can become a genuine partner or alternative
    • Decisions regarding convergence are driven by industry characteristics
    • Supply side players must educate enterprise customers about convergence (if they believe it is beneficial to the enterprise)
  • Conclusion

Related research

Revisiting convergence: How to address the growth imperative

Introduction

Significant opportunity, high risk of complacency

The opportunity for communications service providers (CSPs) to provide greater value and innovative services to customers through new technology advancements is well-documented. For example, the network capabilities (and programmability) that 5G and cloud native bring is touted to change the way that CSPs address revenue opportunities with customers and partners in a more ecosystem-centric environment. The emergence of FTTx (fibre to the x) technology can optimise the use of operators’ assets in a way that delivers seamless connectivity to customers. These advancements allow CSPs to better serve customer needs in a more flexible, scalable, sustainable and agile way than ever before.

Part of the imperative to address this opportunity and vision stems from significant market disruption with new entrants and new types of ‘co-opetitors’, such as the hyperscale cloud providers and greenfield operators, that challenge operators’ existing business and operating models. As a result, CSPs face growing pressure to respond much faster to market and customer demands and enhance their capabilities in a way that does not inflate their cost base or undermine their net-zero goals.

Although CSPs have identified these green pastures for growth, there is still a considerable disconnect between the vision (and what is required to fulfil the ambition) and what capabilities CSPs have today to meet it. Today, CSPs are grappling with too much complexity, fragmentation and duplication within their networks, capabilities and systems. This not only means costs are too high, but it also poses a significant barrier to how they can accelerate the beat rate of innovation and serve new revenue-generating opportunities. This is a gap that CSPs need to close urgently or be at risk of their market shares and value eroding as a result of competition.

Enter your details below to request an extract of the report

The imperative that CSPs can no longer ignore

There is therefore a renewed urgency in building a stronger cost base, scalability, agility and innovation, which could soon become a matter of survival. CSPs are evaluating different strategies and means of making better (and smarter) use of their assets and capabilities in a more agile way and provide the services that customers and partners are increasingly demanding. One such strategy that CSPs have long pursued is network convergence. Although the concept is not new and has been consistently explored and sporadically pursued by operators over the years, the interest has now been reignited to address this imperative. The balance of forces between convergence and divergence has also shifted in favour of the latter in recent years. This has been driven by the adoption of cloud native technologies, which enables operators to deliver new innovative services on top of a common platform (versus siloed islands) and drive for more sustainability & efficiency in the network. This has brought convergence back up to the top of operators’ agendas.

Our report therefore looks to address the following questions:

  • Why and how are CSPs converging their networks to fulfil their growth ambitions?
  • What are the key challenges they face and how can they overcome them?

Evaluating the key drivers for convergence

Cost savings are a priority, but CSPs also want top line growth

The key drivers that CSPs are focused on as part of this renewed pursuit of network convergence are internal and external. Although most operators see capital investment savings and reduction of total cost of ownership (TCO) as an essential priority, the majority of interviewees we spoke to also emphasised the need to support greater innovation with customers and ecosystem development. We describe the main drivers we found through our research with operators below:

Four key drivers that CSPs are focused on

Source: STL Partners

Reducing TCO through network simplification and consolidation

Many operators we spoke to cited network simplification and convergence in addressing the need to ‘do more with less’ and the ability to drive economies of scale and serve market requirements. Convergence can address different disparate sub-systems and siloes that don’t interact with one another (e.g. performance management and inventory management, IP and optical). This fragmentation creates unnecessary complexity for network operations teams to run, manage and assure their networks and introduce potential human errors and associated costs. CSPs have an opportunity to move towards having common infrastructure and management toolset to serve multiple needs, reduce overall TCO and to achieve better control and ubiquitous visibility across their networks. This is particularly important for larger and/or multi-service, multi-country operators. The decommissioning of legacy services (in some cases with government support, for example with PSTN services) is a key opportunity for this.

One European operator described the importance of being able to serve fixed (residential), mobile (consumer), enterprise and wholesale customers with a single backbone and transport network. Inherent in this is greater efficiency, ease of management and less capital spend required to serve multiple types of customers. For example, our interviewee cited the economies of scale they have achieved by putting all of their traffic onto a single IP network that supports all types of customers. This includes greater efficiency and simplicity in not having to run separate IP networks for each type of customer group and less spend on IP routers and lower TCO overall as part of the consolidation.

Creating a sustainable platform for scale and massive data growth

New use cases are projected to increase network traffic and demands. Operators need to prepare for this volume expansion, support more types of fibre connections, provide more flexible capacity and address high performance demands (throughput, latency, error rates). Another European group operator described scale as the main driver for convergence, in being able to seamlessly support thousands of points within the network and offer their portfolio of services across their operations as one package to customers in a simpler way.

Operators need to consider how they can maximise the use of their infrastructure to serve increasingly demanding needs. For example, there is a significant need for CSPs to extract greater synergies from their access fibre: two operators we spoke to – one in North America, the other in Asia – are using fibre originally deployed for residential broadband (Gigabit Passive Optical Network, or GPON) to connect 5G cells. Operators are joining national governments and high-profile corporations in making ‘net-zero’ commitments which is leading them to actively identify and implement strategies that will dramatically reduce their own environmental footprint and play a more active role in reducing their customers’ carbon emissions.

Enabling greater control, resilience and automation

Implicit in these developments is the greater need for automation within the network to ensure not only the greatest cost efficient optimisation of network speeds and processing power, but also the ability to navigate greater network intricacy. One particular European operator we spoke to described the need to enable greater automation across the entire lifecycle, introduce CI/CD pipelines for more agile service development and provide much more granular information and visibility across the entire network. By simplifying and converging the network, operators, operators can address some of the inherent complexity and disparate siloes in their networks and create a unified view of their network. This provides better visibility across the entire network for network operations teams and makes the task of assuring their networks easier. A more unified or common management layer also enables a more granular view and creates scope for AI/ML to deliver further gains in operational simplification and automation. In addition to the benefits for service assurance and lifecycle management, CSPs are also looking to better identify priority areas for improvement and develop more granular cost-benefit analysis for future investment planning.

Enabling greater control, resilience and automation

Implicit in these developments is the greater need for automation within the network to ensure not only the greatest cost efficient optimisation of network speeds and processing power, but also the ability to navigate greater network intricacy. One particular European operator we spoke to described the need to enable greater automation across the entire lifecycle, introduce CI/CD pipelines for more agile service development and provide much more granular information and visibility across the entire network. By simplifying and converging the network, operators can address some of the inherent complexity and disparate siloes in their networks and create a unified view of their network. This provides better visibility across the entire network for network operations teams and makes the task of assuring their networks easier. A more unified or common management layer also enables a more granular view and creates scope for AI/ML to deliver further gains in operational simplification and automation. In addition to the benefits for service assurance and lifecycle management, CSPs are also looking to better identify priority areas for improvement and develop more granular cost-benefit analysis for future investment planning.

Supporting greater innovation and ecosystem development

As the industry moves to more ecosystem-centric, B2B2X models, operators need to be more versatile in supporting diverse types of services with different types of customers. As more and more devices become connected throughout the Coordination Age , the network will need to become more responsive to different use case needs. The underlying network infrastructure needs to facilitate the faster development of richer network functionality and the plethora of emerging use cases, in order to support greater innovation. This means the network (and network teams) need to handle fast changing functions and more agile service development, and frequent software updates.

With a resurging interest in more network-enabled applications, from telematics and connected car to different types of location-based services or immersive experiences (AR/VR) that can respond to network performance data, the network needs to become more visible, distributed, programmable and instructible. Operators can leverage and expose these network capabilities to both internal and external parties, including customers and partners such as application developers, to serve new types of revenue opportunities and ecosystem partners . The expansion of 5G will create the risk of added complexity to the network, not least through the increase in access infrastructure including thousands of locations supporting distributed virtualised workloads (both cloud native network functions and other applications). This makes convergence and the simplification of the management layer even more imperative. The ability to dynamically manipulate network functions is just one of many programmable capabilities the network will require but doing this while keeping the network and associated services secured is no simple task.

Table of contents

  • Executive Summary
  • Preface
  • Introduction
    • Significant opportunity, high risk of complacency
    • The imperative that CSPs can no longer ignore
  • Evaluating the key drivers for convergence
    • Cost savings are a priority, but CSPs also want top line growth
  • Revisiting the concept of convergence
    • Convergence is a multifaceted problem and solution
    • CSPs take different approaches to tackle similar problems
    • Logical convergence
    • Horizontal convergence
    • Vertical convergence
    • The whole is greater than the sum of its parts
  • A matter of how? not why?
    • History and market variance play a role
    • Understanding the key challenges
  • Taking the plunge
    • Convergence is not just a technology decision
    • Incremental steps, not radical change

Related Research

Enter your details below to request an extract of the report

Telco Cloud Deployment Tracker: 5G standalone and RAN

Telco cloud 2.0, fuelled by 5G standalone and RAN, is on the starting grid

This report accompanies the latest release and update of STL Partners ‘Telco Cloud Deployment Tracker’ database. This contains data on deployments of VNFs (Virtual Network Functions), CNFs (cloud-native network functions) and SDN (Software Defined Networking) in the networks of the leading telcos worldwide. It builds on an extensive body of analysis by STL Partners over the past nine years on NFV and SDN strategies, technology and market developments.

Access our Telco Cloud Tracker here

Download the additional file for the full dataset of Telco Cloud deployments

Scope and content of the Tracker

The data in the latest update of our interactive tool and database covers the period up to September 2021, although reference is made in the report to events and deployments after that date. The data is drawn predominantly from public-domain information contained in news releases from operators and vendors, along with reputable industry media.

We apply the term ‘deployment’ to refer to the total set of VNFs, CNFs or SDN technology, and their associated management software and infrastructure, deployed at an operator – or at one or more of an operator’s opcos or natcos – in order to achieve a defined objective or support particular services (in the spreadsheet, we designate these as the ‘primary purpose’ of the deployment). For example, this could be:

  • to deploy a 5G standalone core
  • to launch a software-defined WAN (SD-WAN) service
  • or to construct a ‘telco cloud’ or NFV infrastructure (NFVi): a cloud infrastructure platform on which virtualised network services can be introduced and operated.

The Tracker is provided as an interactive tool containing line-by-line analysis of over 900 individual deployments of VNFs, CNFs or SDN technology, which can be used to drill down by:

  • Region where deployed
  • Operator
  • Technology vendor
  • Primary purpose
  • Category of NFV/SDN technology deployed
  • …and more filters

Enter your details below to request an extract of the report

5G standalone (SA) will hit an inflection point in 2022

5G standalone (SA) core is beginning to take off, with 19 deployments so far expected to be completed in 2022. The eventual total will be higher still, as will that of NSA core, as NSA 5G networks continue to be launched. As non-standalone (NSA) cores are replaced by SA, this will result in another massive wave of core deployments – probably from 2023/4 onwards.

Standalone 5G vs non-standalone 5G core deployments

STL-5G-standalone-core-cloud-tracker-2021

Source: STL Partners


Previous telco cloud tracker releases

Each new release of the tracker is global, but is accompanied by an analytical report which focusses on trends in given regions from time to time:

Enter your details below to request an extract of the report

NFV Deployment Tracker: Global review and update

Welcome to The NFV Deployment Tracker!

This report is the fourth analytical report in the ‘NFV Deployment Tracker’ series and is intended as an accompaniment to the third update of the Tracker Excel spreadsheet (to the end of June 2018).

The update extends the coverage of the Tracker worldwide: adding a comprehensive set of data on live, commercial deployments of NFV and SDN in the African, Latin American and Middle East markets to the existing data set on Asia-Pacific, Europe and North America. In addition, the spreadsheet contains updated and expanded data on deployments in the latter regions.

The expansion of the Tracker’s coverage worldwide presents an opportunity to gain an overview of global SDN and NFV development and deployment trends, and to assess the prospects for the technologies, and the services based on them, going forward.

Enter your details below to request an extract of the report

var MostRecentReportExtractAccess = “Most_Recent_Report_Extract_Access”;
var AllReportExtractAccess = “All_Report_Extract_Access”;
var formUrl = “https://go.stlpartners.com/l/859343/2022-02-16/dg485”;
var title = encodeURI(document.title);
var pageURL = encodeURI(document.location.href);
document.write(‘‘);

Previous editions and other NFV / SDN research

Scope of information provided by the Tracker

The data in the NFV Deployment Tracker is sourced primarily from public-domain information such as telco and vendor press releases and reliable press reports regarding successfully completed deployments and the launch of live, commercial services based on virtualised network functions (VNFs) or SDN. We have also obtained some confidential information direct from operators, which we are unable to present in the detailed break-down of deployments by operator. However, this information has been added to an aggregated data set, which is also provided in the spreadsheet.

The data is therefore limited to verified deployments: production implementations of NFV and SDN powering live services, where we can be confident that the data on the VNFs and IT components involved is accurate and – as far as possible – up to date. We also include some information on deployments planned to be completed by the end of 2017 or by a date as yet unknown, where the information is in the public domain, and where the size and scope of the deployments merit their inclusion.

Contents:

  • Executive Summary
  • The volume and pace of SDN / NFV deployments continues to grow…
  • …but some fundamental challenges remain
  • The focus of deployments varies region by region
  • Operator trends
  • Vendor trends
  • Conclusion
  • Introduction
  • Welcome to the third update of the ‘NFV Deployment Tracker’
  • Scope, definitions and importance of the data
  • Analysis of the global data set
  • Constant growth – but SDN / NFV deployment is far from universal
  • Asia-Pacific ahead on number of deployments despite a slowdown in 2018
  • SD-WAN, SDN, core network functions and orchestration have driven the growth in 2018
  • Operator trends: Leading players rack up the deployments, leaving others lagging far behind
  • Vendor trends: a few major players dominate the scene – but telcos continue to look for alternatives
  • Conclusion 

Figures:

  • Figure 1: Growth in the number of SDN / NFV deployments per year, 2012 to June 2018
  • Figure 2: Breakdown of total deployments by region, 2012 to June 2018
  • Figure 3: Deployments by region, 2014 to 2018
  • Figure 4: Global deployments by higher-level category, 2014 to 2018
  • Figure 5: Deployments in Europe by leading category, 2014 to 2018
  • Figure 6: Asia-Pacific deployments by higher-level category, 2014 to 2018
  • Figure 7: Deployments in North America by leading categories, 2014 to 2018
  • Figure 8: Global deployments of leading VNFs and functional components, 2014 to 2018
  • Figure 9: Total deployments of leading VNFs and functional components, Middle East
  • Figure 10: Leading VNFs and functional components, Latin America
  • 1Figure 11: Leading operators by number of deployments, global
  • Figure 12:  Leading vendors by number of deployments, global
  • Figure 13: Leading vendors by deployment category 25

Enter your details below to request an extract of the report

var MostRecentReportExtractAccess = “Most_Recent_Report_Extract_Access”;
var AllReportExtractAccess = “All_Report_Extract_Access”;
var formUrl = “https://go.stlpartners.com/l/859343/2022-02-16/dg485”;
var title = encodeURI(document.title);
var pageURL = encodeURI(document.location.href);
document.write(‘‘);

NFV Deployment Tracker: Asia takes the lead

Introduction

Welcome to the second update of the ‘NFV Deployment Tracker’

This report is the third analytical report in the ‘NFV Deployment Tracker’ series and is intended as an accompaniment to the second update of the Tracker Excel spreadsheet (dated March 2018).

The update provides a comprehensive set of data on live, commercial deployments of NFV and SDN in the Asia-Pacific market. Under ‘Asia-Pacific’, we include all of the countries of Central, Southern and South-East Asia, along with Oceania. In addition to the new set of data for Asia-Pacific, the spreadsheet contains updated and revised data on deployments in the European and North American regions.

In June 2018, the data set and analysis will be extended to all other regions worldwide, with the aim of providing the industry’s most comprehensive, authoritative source of information on live deployments of NFV and SDN.

Scope, definitions and importance of the data

Detailed explanation of the scope of the information provided in the Tracker, definitions of terms (including how we define a live ‘deployment’ and definitions of frequently used NFV / SDN acronyms) and an account of why we think it is important to track the progress of NFV / SDN are provided in the first analytical report of the series – so we will not repeat them here.

Analysis of the Asia-Pacific data set

Overall data and trends: Asia-Pacific is the largest global market for NFV

We have gathered data on 102 live, commercial deployments of NFV and SDN in Asia-Pacific between 2012 and 2018. These were completed by 33 telcos, including all of the major operators in China, Japan, South Korea and Australia. Deployments have been more limited in India: seven in total, including two global implementations by Tata Communications. Altogether, the data includes information on 203 known Virtual Network Functions (VNFs), functional sub-components and supporting infrastructure elements that have formed part of these deployments.

This means that Asia-Pacific is the largest market for NFV and SDN, measured purely in terms of number of deployments. The Asia-Pacific totals outstrip the updated numbers for both Europe (89 deployments and 182 VNFs / functional components) and North America (62 deployments and 126 VNFs / functional components). The number of operators that have completed deployments is also higher than that in Europe or North America.

Contents:

  • Executive Summary
  • Asia-Pacific is the leading global SDN / NFV market
  • Introduction
  • Welcome to the second update of the ‘NFV Deployment Tracker’
  • Scope, definitions and importance of the data
  • Analysis of the Asia-Pacific data set
  • Overall data and trends: Asia-Pacific is the largest global market for NFV
  • SDN, SD-WAN and core network functions have driven the growth
  • Operator trends: Innovators lead the way, closely followed by the Chinese giants
  • Vendor trends: SD-WAN and vCPE vendors lead the way
  • Conclusion

Figures:

  • Figure 1: Total NFV and SDN deployments in Asia-Pacific, 2012 to 2018
  • Figure 2: Asia-Pacific deployments by higher-level category, 2014 to 2018
  • Figure 3: European deployments by higher-level category, 2014 to 2018
  • Figure 4: North American deployments by higher-level category, 2014 to 2018
  • Figure 5: Leading VNFs and functional components deployed in Asia-Pacific
  • Figure 6: Leading Asia-Pacific operators by number of NFV / SDN deployments
  • Figure 7: Leading vendors by number of deployments

NFV Deployment Tracker – North America: SD-WAN tail wags NFV dog

Introduction

Welcome to the first update of the ‘NFV Deployment Tracker’

This report is the second analytical report in the ‘NFV Deployment Tracker’ series and is intended as an accompaniment to the first update of the Tracker Excel spreadsheet (to December 2017).

The update provides a comprehensive set of data on live, commercial deployments of NFV and SDN in the North American market (including the US, Canada and the Caribbean). In addition, the spreadsheet contains updated and revised data on deployments in the European region.

In March 2018, the data set and analysis will be extended to all other regions worldwide, with the aim of providing the industry’s most comprehensive, authoritative source of information on live deployments of NFV and SDN.

Enter your details below to request an extract of the report

var MostRecentReportExtractAccess = “Most_Recent_Report_Extract_Access”;
var AllReportExtractAccess = “All_Report_Extract_Access”;
var formUrl = “https://go.stlpartners.com/l/859343/2022-02-16/dg485”;
var title = encodeURI(document.title);
var pageURL = encodeURI(document.location.href);
document.write(‘‘);

Scope, definitions and importance of the data

Detailed explanation of the scope of the information provided in the Tracker, definitions of terms (including how we define a live ‘deployment’ and definitions of frequently used NFV / SDN acronyms) and an account of why we think it is important to track the progress of NFV / SDN are provided in the first analytical report of the series – NFV Deployment Tracker: Europe (September 2017).

Contents:

  • Executive Summary
  • Conclusion: strong growth in 2018 will be delivered by the continuing rise of SD-WAN and new consumer use cases
  • Introduction
  • Welcome to the first update of the ‘NFV Deployment Tracker’
  • Scope, definitions and importance of the data
  • Analysis of the North American data set
  • Overall data and trends
  • ‘Service-led Innovation’ has driven the deployments
  • ‘Technology Evolution’ deployments are less in evidence
  • Operator trends: AT&T and Verizon dispute first place, while other players focus on differentiated offers
  • Vendor trends: SD-WAN and vCPE vendors lead the way
  • Conclusion: A dynamic enterprise market – but consumer use cases still outstanding

Figures:

  • Figure 1: Total NFV and SDN deployments in North America, 2011 to 2017
  • Figure 2: North American deployments by higher-level category, 2014 to 2017
  • Figure 3: European deployments by higher-level category, 2014 to 2017
  • Figure 4: Leading North American operators by number of NFV / SDN deployments
  • Figure 5: Leading vendors by number of deployments (North America)

Enter your details below to request an extract of the report

var MostRecentReportExtractAccess = “Most_Recent_Report_Extract_Access”;
var AllReportExtractAccess = “All_Report_Extract_Access”;
var formUrl = “https://go.stlpartners.com/l/859343/2022-02-16/dg485”;
var title = encodeURI(document.title);
var pageURL = encodeURI(document.location.href);
document.write(‘‘);

AI on the Smartphone: What telcos should do

Introduction

Following huge advances in machine learning and the falling cost of cloud storage over the last several years, artificial intelligence (AI) technologies are now affordable and accessible to almost any company. The next stage of the AI race is bringing neural networks to mobile devices. This will radically change the way people use smartphones, as voice assistants morph into proactive virtual assistants and augmented reality is integrated into everyday activities, in turn changing the way smartphones use telecoms networks.

Besides implications for data traffic, easy access to machine learning through APIs and software development kits gives telcos an opportunity to improve their smartphone apps, communications services, entertainment and financial services, by customising offers to individual customer preferences.

The leading consumer-facing AI developers – Google, Apple, Facebook and Amazon – are in an arms race to attract developers and partners to their platforms, in order to further refine their algorithms with more data on user behaviours. There may be opportunities for telcos to share their data with one of these players to develop better AI models, but any partnership must be carefully weighed, as all four AI players are eyeing up communications as a valuable addition to their arsenal.

In this report we explore how Google, Apple, Facebook and Amazon are adapting their AI models for smartphones, how this will change usage patterns and consumer expectations, and what this means for telcos. It is the first in a series of reports exploring what AI means for telcos and how they can leverage it to improve their services, network operations and customer experience.

Contents:

  • Executive Summary
  • Smartphones are the key to more personalised services
  • Implications for telcos
  • Introduction
  • Defining artificial intelligence
  • Moving AI from the cloud to smartphones
  • Why move AI to the smartphone?
  • How to move AI to the smartphone?
  • How much machine learning can smartphones really handle?
  • Our smartphones ‘know’ a lot about us
  • Smartphone sensors and the data they mine
  • What services will all this data power?
  • The privacy question – balancing on-device and the cloud
  • SWOT Analysis: Google, Apple, Facebook and Amazon
  • Implications for telcos

Figures:

  • Figure 1: How smartphones can use and improve AI models
  • Figure 2: Explaining artificial intelligence terminology
  • Figure 3: How machine learning algorithms see images
  • Figure 4: How smartphones can use and improve AI models
  • Figure 5: Google Translate works in real-time through smartphone cameras
  • Figure 6: Google Lens in action
  • Figure 7: AR applications of Facebook’s image segmentation technology
  • Figure 8: Comparison of the leading voice assistants
  • Figure 9: Explanation of Federated Learning

NFV Deployment Tracker: Europe (September 2017)

This report is discussed in our free webinar recording: Keeping NFV on track – Assessing operator strategies and progress

Introduction

Welcome to The NFV Deployment Tracker!

This report is the first of a new series of statistical and analytical reports tracking the progress of NFV and SDN: ‘The NFV Deployment Tracker’. The ‘Tracker’ builds on an extensive body of analysis by STL Partners over the past two years on NFV and SDN strategies, technology and market developments.

This service will be updated on a quarterly basis and will provide a steadily growing database on live deployments of NFV and SDN by telcos worldwide. The data is presented in an Excel spreadsheet, accompanied by an analytical report presenting the key statistics and trends observed during the quarter.

At launch, the Tracker provides data on the European market; December’s update will also include comprehensive data from the North American market; and in March 2018, we will extend the coverage to Asia and the Rest of the World – while up-to-date information on the markets already included will be added on a continuous basis.

Enter your details below to request an extract of the report

var MostRecentReportExtractAccess = “Most_Recent_Report_Extract_Access”;
var AllReportExtractAccess = “All_Report_Extract_Access”;
var formUrl = “https://go.stlpartners.com/l/859343/2022-02-16/dg485”;
var title = encodeURI(document.title);
var pageURL = encodeURI(document.location.href);
document.write(‘‘);

Scope of information provided by the Tracker

The data in the NFV Deployment Tracker is sourced primarily from public-domain information such as telco and vendor press releases and reliable press reports regarding successfully completed deployments and the launch of live, commercial services based on virtualised network functions (VNFs) or SDN. We have also obtained some confidential information direct from operators, which we are unable to present in the detailed break-down of deployments by operator. However, this information has been added to an aggregated data set, which is also provided in the spreadsheet.

The data is therefore limited to verified deployments: production implementations of NFV and SDN powering live services, where we can be confident that the data on the VNFs and IT components involved is accurate and – as far as possible – up to date. We also include some information on deployments planned to be completed by the end of 2017 or by a date as yet unknown, where the information is in the public domain, and where the size and scope of the deployments merit their inclusion.

In terms of size, the research has focused on Tier-One carriers, including the incumbent or former incumbent operators of every European state, along with leading competitive operators in major markets, Pan-European players and the leading cablecos. We have not included smaller local and regional players, Tier-Three providers and all but the largest Tier-Two carriers. We include all deployments within Europe, even if the parent company involved is headquartered outside of Europe (e.g. US-based Liberty Global, which owns cable assets across Europe). But we do not include deployments at non-European subsidiaries of Europe-based operator groups.

We have also not included activity around proofs of concept (PoCs), live tests or demonstrations of NFV and SDN. This is partly because a lot of this work never comes to fruition in terms of commercial deployments – at least not in quite the same combination of elements as the pre-commercial tests – and partly because the aim of the Tracker is to provide a reliable, comprehensive source of information on actual, commercial implementations of NFV and SDN, from which vendor and telco hype about the technologies has been eliminated.

Contents:

  • Executive Summary: NFV still on the roadmap, but horizons of deployment stretch out
  • Welcome to the NFV Deployment Tracker
  • Scope and importance of the Tracker
  • European data: Steady but unspectacular growth in deployments
  • Conclusion: NFV still squarely on the roadmap, but navigating the landscape is taking longer than scheduled
  • Introduction
  • Welcome to The NFV Deployment Tracker!
  • Scope of information provided by the Tracker
  • Definitions
  • What counts as a deployment?
  • Why is this information important?
  • Analysis of the initial European data set
  • Overall data and trends
  • Winners, losers and low-hanging fruit
  • Vendor trends
  • Operator trends
  • Conclusion
  • NFV is still very much on the roadmap, but the horizon of deployment is stretching out further than anticipated

Figures:

  • Figure 1: Definition of main abbreviations used in this report
  • Figure 2: Total NFV and SDN deployments in Europe, 2009 to 2017
  • Figure 3: Deployments from 2009 to 2017 broken down by higher-level categories
  • Figure 4: Deployments by leading network function and infrastructure category, 2014 to 2017
  • Figure 5: Number of deployments by lead vendor
  • Figure 6: Leading operators in terms of number of deployments

Enter your details below to request an extract of the report

var MostRecentReportExtractAccess = “Most_Recent_Report_Extract_Access”;
var AllReportExtractAccess = “All_Report_Extract_Access”;
var formUrl = “https://go.stlpartners.com/l/859343/2022-02-16/dg485”;
var title = encodeURI(document.title);
var pageURL = encodeURI(document.location.href);
document.write(‘‘);

5G: The spectrum game is changing – but how to play?

Introduction

Why does spectrum matter?

Radio spectrum is a key “raw material” for mobile networks, together with evolution of the transmission technology itself, and the availability of suitable cell-site locations. The more spectrum is made available for telcos, the more capacity there is overall for current and future mobile networks. The ability to provide good coverage is also determined largely by spectrum allocations.

Within the industry, we are accustomed to costly auction processes, as telcos battle for tranches of frequencies to add capacity, or support new generations of technology. In contrast, despite the huge costs to telcos for different spectrum allocation, most people have very little awareness of what bands their phones support, other than perhaps that it can use ‘mobile/cellular’ and WiFi.

Most people, even in the telecoms industry, don’t grasp the significance of particular numbers of MHz or GHz involved (Hz = number of cycles per second, measured in millions or billions). And that is just the tip of the jargon and acronym iceberg – a full discussion of mobile RAN (radio access network) technology involves different sorts of modulation, multiple antennas, propagation metrics, path loss (in decibels, dB) and so forth.

Yet as 5G pulls into view, it is critical to understand the process by which new frequencies will be released by governments, or old ones re-used by the mobile industry. To deliver the much-promised peak speeds and enhanced coverage of 5G, big chunks of frequencies are needed. Yet spectrum has many other uses besides public mobile networks, and battles will be fierce about any reallocations of incumbent users’ rights. The broadcast industry (especially TV), satellite operators, government departments (notably defence), scientific research communities and many other constituencies are involved here. In addition, there are growing demands for more bandwidth for unlicensed usage (as used for WiFi, Bluetooth and other low-power IoT networks such as SigFox).

Multiple big industries – usually referred to by the mobile community as “verticals” – are flexing their own muscles as well. Energy, transport, Internet, manufacturing, public safety and other sectors all see the benefits of wireless connectivity – but don’t necessarily want to involve mobile operators, nor subscribe to their preferred specifications and standards. Many have huge budgets, a deep legacy of systems-building and are hiring mobile specialists.

Lastly, parts of the technology industry are advocates of more nuanced approaches to spectrum management. Rather than dedicate bands to single companies, across whole countries or regions, they would rather develop mechanisms for sharing spectrum – either on a geographic basis, or by allowing some form of “peaceful coexistence” where different users’ radios behave nicely together, instead of creating interference. In theory, this could improve the efficient use of spectrum – but adds complexity, and perhaps introduces so much extra competition than willingness to invest suffers.

Which bands are made available for 5G, on what timescales, in what type of “chunks”, and the authorisation / licensing schemes involved, all define the potential opportunity for operators in 5G – as well as the risks of disruption, and (for some) how large the window is to fully-monetise 4G investments.

The whole area is a minefield to understand – it brings together the hardest parts of wireless technology to grasp, along with impenetrable legal processes, and labyrinthine politics at national and international levels. And ideally, it is possible to somehow to layer on consideration of end-user needs, and economic/social outputs as well.

Who are the stakeholders for spectrum?

At first sight, it might seem that spectrum allocations for mobile networks ought to be a comparatively simple affair, with governments deciding on tranches of frequencies and an appropriate auction process. MNOs can bid for their desired bands, and then deploy networks (and, perhaps, gripe about the costs afterwards).

The reality is much more complex. A later section describes some of the international bureaucracy involved in defining appropriate bands, which can then be doled out by governments (assuming they don’t decide to act unilaterally). But even before that, it is important to consider which organisations want to get involved in the decision process – and their motivations, whether for 5G or other issues that are closer to their own priorities, which intersect with it.

Governments have a broad set of drivers and priorities to reconcile – technological evolution of the economy as a whole, the desire for a competitive telecoms industry, exports, auction receipts – and the protection of other spectrum user groups such as defence, transport and public safety. Different branches of government and the public administration have differing views, and there may sometimes be tussles between the executive branch and various regulators.

Much the same is true at regional levels, especially in Europe, where there are often disagreements between European Commission, European Parliament, the regulators’ groups and 28 different EU nations’ parliaments (plus another 23 non-EU nations).

Even within the telecoms industry there are differences of opinion – some operators see 5G as an urgent strategic priority, that can help differentiation and reduce costs of existing infrastructure deployments. Others are still in the process of rolling out 4G networks and want to ensure that those investments continue to have relevance. There are variations in how much credence is assigned to the projections of IoT growth – and even there, whether there needs to be breathing room for 4G cellular types such as NB-IoT, which is yet to be deployed despite its putative replacement being discussed already.

The net result is many rounds of research, debate, consultation, disagreement and (eventually) compromise. Yet in many ways, 5G is different from 3G and 4G, especially because many new sectors are directly involved in helping define the use-cases and requirements. In many ways, telecoms is now “too important to be left to the telcos”, and many other voices will therefore need to be heard.


  • Executive Summary
  • Introduction
  • Why does spectrum matter?
  • Who are the stakeholders for spectrum?
  • Spectrum vs. business models
  • Does 5G need spectrum harmonisation as much as 4G?
  • Spectrum authorisation types & processes
  • Licensed, unlicensed and shared spectrum
  • Why is ITU involved, and what is IMT spectrum?
  • Key bands for 5G
  • Overview
  • 5G Phase 1: just more of the same?
  • mmWave beckons – the high bands >6GHz
  • Conclusions


  • Figure 1 – 5G spectrum has multiple stakeholders with differing priorities
  • Figure 2 – Multi-band support has improved hugely since early 4G phones
  • Figure 3 – A potential 5G deployment & standardisation timeline
  • Figure 4 – ITU timeline for 5G spectrum harmonisation, 2014-2020
  • Figure 5 – High mmWave frequencies (e.g. 28GHz) don’t go through solid walls
  • Figure 6 – mmWave brings new technology and design challenges

MWC 2016: 5G and Wireless Networks

Getting Serious About 5G

MWC 2016 saw intense hype about 5G. This is typical for the run-up to a new “G”, but at least this year there was much less of the waffle about it being “a behaviour”, a “special generation”, the “last G”, or a “state of mind”. Instead, there was much more concrete activity from all stakeholders, including operators, technology vendors and standards bodies.

Nokia CEO Rajeev Suri, notably, set a 2017 target for 5G deployment to begin, which has been taken up by carriers including Verizon Wireless. This is still controversial, but the major barriers seem to be around standardisation and spectrum, rather than the technology. Most vendors had a demonstration of 5G in some form, although the emphasis and timeframes varied. However, the general theme is that even the 2018-2019 timeframe set by the Korean operators may now be overtaken by events.

An important theme at the show was that expectations for 5G have been revised:

  • They have been revised up, when it comes to the potential of future radio technology, which is seen as being capable of delivering a useful version of 5G much faster;
  • They have been revised down, when it comes to some of the more science-fictional visions of ‘one network to cover every imaginable use case’. 5G is likely to be focused on mobile broadband plus a couple of other IoT options.

This is in part thanks to a strong operator voice on 5G, coordinated through the Next Generation Mobile Networks Alliance (NGMN)1, reaching the standardisation process in 3GPP. It is also due to a strong presence by the silicon vendors in the standards process, which is important given the concentration of the device market into relatively few system-on-chip and even fewer RF component manufacturers.

Context: 3GPP 5G RAN Meeting Set the Scene for Faster Development

To understand the shift at MWC, it is useful to revisit what operators and vendors were focusing on at the September 2015 3GPP 5G RAN meeting in Phoenix. Operator concerns from the sessions can be summed up as the three Cs – cost (reducing total cost of ownership), capacity (more of it, specifically enhanced mobile broadband data and supporting massive numbers of IoT device connections), and carbon dioxide (less of it, through using less energy).

At that key meeting, most operators clearly wanted the three Cs, and most also highlighted a particular interest in one or another of the 5G benefit areas. Orange was interested in driving low-cost mobile broadband for its African operations. Deutsche Telekom was keen on network slicing and virtualisation for its enterprise customers. Verizon Wireless wanted more speed above all, to maintain its premium carrier status in the rich US cellular market. Vodafone was interested in the IoT/M2M aspects as a new growth opportunity.

This was reflected in operator views on timing of 5G standardisation and commercialisation. The more value a particular operator placed on capacity, the sooner they wanted “early 5G” and the more focused the specs would have to be, putting off the more visionary elements (device-to-device, no-cells networks, etc.) to a second phase.

A strong alliance between the silicon vendors – Qualcomm, Samsung, Mediatek, ARM, and Intel – and key network vendors, notably Nokia, emerged to push for an early 5G standardisation focused on a new radio access technology. This standard would be used in the context of existing 4G networks before the new 5G core network arrives2, and begins to deliver on the three Cs. On the other side of the discussion, Huawei (which was still talking about 5G in 2020 at MWC) was keen to keep the big expansive vision of an all-purpose multiservice 5G network alive, and to eke out 4G with incremental updates (LTE-A Pro) in the meantime.

Dino Flore, the Qualcomm executive who chairs 3GPP RAN, compromised by going for the early 5G radio access but keeping two of the special requests – for “massive” IoT and for “mission-critical” IoT – on the programme, while accepting continuing development of LTE as LTE-A Pro.


  • Executive Summary
  • Getting Serious About 5G
  • Context: 3GPP 5G RAN Meeting Set the Scene for Faster Development
  • MWC showed the early 5G camp is getting stronger
  • A special relationship: Nokia, Qualcomm, Intel
  • Conclusions

MWC 2016: The Cloud/NFV Transformation Needle Moves

Enter the open-source software leaders: IT takes telco cloud seriously

One of the most important trends from MWC 2016 was the increased presence, engagement, and enthusiasm of the key open-source software vendors. Companies like Red Hat, IBM, Canonical, HP Enterprise, and Intel are the biggest contributors of code, next to independent developers, to the key open-source projects like OpenStack, OPNFV, and Linux itself. Their growing engagement in telecoms software is a major positive for the prospects of NFV/SDN and telco re-engagement in cloud.

OpenStack, the open-source cloud operating system, is emerging as the key platform for telco cloud and also for NFV implementations. Figure 1, taken from the official OpenStack statistics tracker at Stackalytics.com, shows contributions to the current release of OpenStack by organisational affiliation and by module; this highlights both which companies are contributing heavily to OpenStack development, and which modules are attracting the most development effort.

AT&T’s specialist partner Mirantis shows up as a leading contributor of code for OpenStack, some of which we believe is developed inside AT&T Shannon Labs. Tellingly, among OpenStack modules, the single biggest focus area is Neutron, the OpenStack module which takes care of its networking functions. Anything NFV-related will tend to end up in here.

Figure 1: The contributor ecosystem for OpenStack (% of commits, bug fixes, and reviews by company and module)

Source: Stackalytics


  • Executive Summary
  • Enter the open-source software leaders: IT takes telco cloud seriously
  • And (some) telcos get serious about software
  • Open-source development is influencing the standards process
  • The cloud is the network is the cloud
  • Nokia and Intel: ever closer union?


  • Figure 1: The contributor ecosystem for OpenStack (% of commits, bug fixes, and reviews by company and module)
  • Figure 2: Mirantis contributes more to OpenStack networking than Red Hat or Cisco (% of commits, bug fixes, and reviews by company, for networking module)
  • Figure 3: Mirantis (and therefore AT&T) drive the key Fuel project forwards

4G Roll Out Analysis: Winning Strategies and 5G Implications

Identifying & Analysing Key Operators

In search of the best practice in 4G deployment, we first had to pick out the operators who did best on quantitative metrics, before we could drill down qualitatively to investigate why. We screened all the 40 MNOs that have so far launched 4G in the BRICS, the United States, the top 5 European markets, China, Japan, Taiwan, and South Korea, on the following indicators.

  • Monthly headline ARPU, converted to US dollars
  • Market share by subscribers
  • Quarterly net-adds
  • 4G adoption, % of the subscriber base
  • EBITDA margin %

Where possible, we also collected information on network density (i.e. subscribers per cell), and on spectrum holdings. In Figure 1, we plot EBITDA margin against the change in market share in percentage points since Q4 2012, sizing the bubbles by US dollar monthly ARPU. The axes are set to the average values for each metric.

Figure 1: 8 out of 40 MNOs made the cut for further analysis 


Source: STL Partners, themobileworld.com, company filings

The top-right quadrant shows those operators who are above average both on improving margins and gaining share. We picked those operators who got into the top-right quadrant – above-average EBITDA margin and positive share growth – for at least two quarters, and have a positive trend, for further research. Those are:

  • Chunghwa Telecom
  • Free Mobile
  • Verizon Wireless
  • AT&T Mobility
  • Wind
  • Bharti Airtel
  • 3UK
  • MTS

We expected to find that those operators who chose market share first, initiating the price disruptions in the US and in France, would have sacrificed margin as they chased share. An example would be T-Mobile USA, additionally marked in purple on the chart. This is essentially the scenario allegedly needing “market repair” which is dear to the hearts of European telco lobbyists. However, as Figure 2 shows, we found something very different. Profitability is actually gradually increasing with subscriber growth, but only for the top-performing operators. Again, bubbles are scaled to ARPU.


  • Executive Summary*
  • Identifying & Analysing Key Operators
  • A Design for Success*
  • Parameters*
  • Commercial Options*
  • What Strategy Did the Top Eight Adopt?*
  • Conclusions on the Network for the top Eight*
  • Conclusions on the Commercial Strategy*
  • Getting It Wrong*
  • Operator Case Studies
  • Conclusions and recommendations*

(* = not shown here)


  • Figure 1: 8 out of 40 MNOs made the cut for further analysis
  • Figure 2: The fastest-growing 4G operators are either holding or gradually increasing their EBITDA margins*
  • Figure 3: Scale helps, but less than you might think*
  • Figure 4: A strategy matrix for 4G operators*
  • Figure 5: An introduction to carrier aggregation*
  • Figure 6: Parameters of our 8 leading 4G deployers*
  • Figure 7: MTS holds onto margins as data volumes surge*
  • Figure 8: Wind’s data revenue gains now offset losses from voice entirely, at 37% margins*
  • Figure 9: VZW’s service margin soars despite the price disruption*
  • Figure 10: AT&T service margins are also high and rising*
  • Figure 11: Service margins are rising strongly at 3UK*
  • Figure 12: Six operators who are struggling to escape the lower-left quadrant*
  • Figure 13: Sprint and T-Mobile are playing the same game but only one is winning*
  • Figure 14: Sprint toned down the smartphone bonanza in 2015*
  • Figure 15: Vodafone’s European OpCos are improving, but it’s been a hard road*
  • Figure 16: Vodafone Germany’s turnaround plan – 1800MHz plus backhaul*
  • Figure 17: Project Spring still hasn’t filled the fibre gap*
  • Figure 18: Free, despite being the smallest and latest to start of the French MNOs, had an outstanding score on our latency index*
  • Figure 19: T-Mobile USA’s latency performance is market-leading on a blended 3G/4G basis*
  • Figure 20: T-Mobile USA generates fewer high latency events than any US operator*

(* = not shown here)

Huawei’s choice: 5G visionary, price warrior or customer champion?

Introduction: Huawei H1s

Huawei’s H1 2015 results caused something of a stir, as they seemed to promise a new cycle of rapid growth at the No.2 infrastructure vendor. The headline figure was that revenue for H1 was up 30% year-on-year, somewhat surprising as LTE infrastructure spending was thought to have passed the peak in much of the world. In context, Huawei’s revenue has grown at a 16% CAGR since 2010, while its operating profits have grown at 2%, implying very significant erosion of margins as the infrastructure business commoditises. Operating margins were in the region of 17-18% in 2010, before falling to 10-12% in 2012-2014.

Figure 1 – If Huawei’s H2 delivers as promised, it may have broken out of the commoditisation trap… for now

Source: STL Partners, Huawei press releases 

Our estimate, in Figure 1, uses the averages for the last 4 years to show two estimates for the full-year numbers. If the first, ‘2015E’, is delivered, this would take Huawei’s profitability back to the levels of 2010 and nearly double its operating profit. The second estimate ‘Alternate 2015E’, assumes a similar performance to last year’s, in which the second half of the year disappoints in terms of profitability. In this case, full-year margin would be closer to 12% rather than 18% and all the growth would be coming from volume. The H1 announcement promises margins for 2015 of 18%, which would therefore mean a very successful year indeed if they were delivered in H2. For the last few years, Huawei’s H2 revenue has been rather higher than H1, on average by about 10% for 2011-2014. You might expect this in a growing business, but profitability is much more erratic.

For reference, Figure 2 shows that the relationship between H1 and H2 profitability has varied significantly from year to year. While in 2012 and 2013 Huawei’s operating profits in H2 were higher than in H1, in 2011 and 2014, its H2 operating profits were much less than in H1. 2015E shows the scenario needed to deliver the 18% annual margin target; Alternate 2015E shows a scenario where H2 is relatively weak, in line with last year.

Figure 2 – Huawei’s H1 and H2 Profits have varied significantly year on year

Source: STL Partners, Huawei press releases 

Huawei’s annual report hints at some reasons for the weak H2 2014, notably poor sales in North America, stockbuilding ahead of major Chinese investment (inventory rose sharply through 2014), and the launch of the Honor low-cost device brand. However, although North American wireless investment was in fact low at the time, it’s never been a core market for Huawei, and Chinese carriers were spending heavily. It is plausible that adding a lot of very cheap devices would weigh on the company’s profitability. As we will see, though, there are reasons to think Huawei might not have got full value from strong carrier spending in this timeframe.

In any event, to hit Huawei’s ambitious 2015 target, it will need a great H2 2015 to follow from its strong H1. It hasn’t performed this particular ‘double’ for the last four years, so it will certainly be an achievement to do it in 2015. And if it does, how is the market looking for 2016 and beyond?

Where are we in the infrastructure cycle?

As Huawei is still primarily an infrastructure vendor, its business is closely coupled to operators’ CAPEX plans. In theory, these plans are meant to be cyclical, driven by the ever present urge to upgrade technology and build out networks. The theory goes that on one hand, technology drivers (new standards, higher-quality displays and camera sensors) and user behaviour (the secular growth in data traffic) drive operators to invest. On the other, financial imperatives (to derive as much margin from depreciating assets as possible) encourage operators to resist spending and sweat the assets.

Sometimes, the technology drivers get the upper hand; sometimes, the financial constraints. Therefore, the operator tends to “flip” between a high-investment and a low-investment state. Because operators compete, this behaviour may become synchronised within markets, causing large geographies to exhibit an infrastructure spending cycle.

In practice, there are other drivers that mitigate against the cyclical forces. There are ‘bottlenecks’ in integration and in scaling resources up and down, and generally, businesses prefer to keep expenditures as flat as possible to reduce variations and resulting ‘surprises’ for their shareholders. In general though, there is some ongoing variation in levels of capex investment in every market, as we examine in the following sections.

North America: operators take a breather before 5G

In North America, the tipping-point from sweating the assets to investment seems to have been reached roughly in 2011-2012, when the major carriers began a cycle of heavy investment in LTE infrastructure. This investment peaked in 2014. Recently, AT&T informed its shareholders to expect significantly lower CAPEX over the next few years, and in fact the actual numbers so far this year are substantially lower than the guidance of around 14-15% of revenue. Excluding the Mexican acquisitions, CAPEX/Revenue has been running around 13% since Q3 2014. From Q2 2013 to the end of Q2 2014, AT&T spent on average $5.7bn a quarter with the vendors. Since then, the average is $4.4bn, so AT&T has reduced its quarterly CAPEX by 21%.

Figure 3 – AT&T’s LTE investment cycle looks over.

Source: STL Partners, Huawei press releases

During 2013, AT&T, Sprint, and VZW were all in a higher spending phase, as Figure 3 shows. Since then, AT&T and Sprint have backed off considerably. However, despite its problems, Sprint does seem to be starting another round of investment, and VZW has started to invest again, while T-Mobile is rising gradually. We can therefore say that the investment pause in North America is overhyped, but does exist – compare the first half of 2013, when AT&T, Sprint, and T-Mobile were all near the top of the cycle while VZW was dead on the average.

Figure 4 – The investment cycle in North America.

Source: STL Partners

The pattern is somewhat clearer in terms of CAPEX as a percentage of revenue, shown in Figure 5. In late 2012 and most of 2013, AT&T, Sprint, and T-Mobile were all near the top of their historic ranges for CAPEX as a percentage of their revenue. Now, only Sprint is really pushing hard.

Figure 5 – Spot the outlier. Sprint is the only US MNO still investing heavily

Source: STL Partners, company filings

If there is cyclicality it is most visible here in Sprint’s numbers, and the cycle is actually pretty short – the peak-to-trough time seems to be about a year, so the whole cycle takes about two years to run. That suggests that if there is a more general cyclical uptick, it should be around H1 2016, and the one after that nicely on time for early 5G implementations in 2018.

  • Executive Summary
  • Introduction: Huawei H1s
  • Where are we in the infrastructure cycle?
  • North America: operators take a breather before 5G
  • Europe: are we seeing a return to growth?
  • China: full steam ahead under “special action mobilisation”
  • The infrastructure market is changing
  • Commoditisation on a historic scale
  • And Huawei is no longer the price leader
  • The China Mobile supercontract: a highly political event
  • Conclusion: don’t expect a surge in infrastructure profitability
  • Huawei’s 5G Strategy and the Standards Process
  • Huawei’s approach to 5G
  • What do operators want from 5G?
  • In search of consensus: 3GPP leans towards an simpler “early 5G” solution
  • Conclusions
  • STL Partners and Telco 2.0: Change the Game


  • Figure 1: In Q2, the Euro-5 out-invested Chinese operators for the first time
  • Figure 2: If Huawei’s H2 delivers as promised, it may have broken out of the commoditisation trap for now
  • Figure 3: Huawei’s H1 and H2 Profits have varied significantly year on year
  • Figure 4: AT&T’s LTE investment cycle looks over.
  • Figure 5: The investment cycle in North America.
  • Figure 6: Spot the outlier. Sprint is the only US MNO still investing heavily
  • Figure 7: 3 of the Euro-5 carriers are beginning to invest again
  • Figure 8: European investment levels are not as far behind as you might think
  • Figure 9: Chinese CAPEX/Revenue levels have been 10 percent higher than US or European ones – but this may be changing
  • Figure 10: Chinese infrastructure spending was taking a breather too, until Xi’s intervention
  • Figure 11: Chinese MNOs are investing heavily
  • Figure 12: LTE deployments have grown 100x while prices have fallen even more
  • Figure 13: As usual, Huawei is very much committed to a single radio solution
  • Figure 14: Huawei wants most 5G features in R15 by H2 2018
  • Figure 15: Huawei only supports priority for MBB very weakly and emphasises R16 and beyond
  • Figure 16: Chinese operators, Alcatel-Lucent, ZTE, and academic researchers disagree with Huawei
  • Figure 17: Orange’s view of 5G: distinctly practical
  • Figure 18: Telefonica is really quite sceptical about much of the 5G technology base
  • Figure 19: Qualcomm sees R15 as a bolt-on new radio in an LTE het-net
  • Figure 20: 3GPP RAN chairman Dino Flores says “yes” to prioritisation
  • Figure 21: Working as a group, the operators were slightly more ambitious
  • Figure 22: The vendors are very broadband-focused
  • Figure 23: Vodafone and Huawei