
5G SA: Is it too late for the slow movers to monetise?
In this annual update to our Telco Cloud Deployment Tracker we focus on 5G core, vRAN/open RAN and cloud-native container orchestration platform deployments by telcos.

In this annual update to our Telco Cloud Deployment Tracker we focus on 5G core, vRAN/open RAN and cloud-native container orchestration platform deployments by telcos.

The telecom industry is going through a period of material change in respect to the silicon it utilises. This report examines the key dynamics and considerations in the locations where processing demand is at its highest: the RAN and AI factories.

Welcome to this series analysing innovative B2B offerings by leading telcos worldwide. In this second edition, we turn our focus to a successful NaaS player in India.

The RAN is evolving towards greater openness and disaggregation, but the path is hybrid and incremental. This report explores the challenges operators face, early lessons from deployments, and why embedding openness and flexibility early is critical to long-term competitiveness.

Welcome to this series analysing network autonomy efforts by leading telcos worldwide. In this first edition, we put the spotlight on a successful operator journey coming from China.

Welcome to this series analysing innovative B2B offerings by leading telcos worldwide.
In this first edition, we turn our focus to a successful software-as-a-service (SaaS) offering coming from Singapore.

Telcos leading the development of mobile network APIs must set strategies now to scale the market beyond the first wave of customers and use cases. We explore three potential pathways for growth: courting new customers, creating new capabilities and a combination of both.

No one can foresee how and when import tariffs will stabilise – but some
long-term implications are starting to arise.

Most large-scale deployments of virtualised RAN (vRAN) at Tier 1 telcos are currently based on single-vendor architecture. But operators are deploying vRAN in innovative ways that aim to preserve many open RAN benefits. This report looks at the current status of vRAN and open RAN deployments as well as the increasing awareness of the importance of deploying cloud-native RAN across multiple containers-as-a-service (CaaS) layers.

It was no surprise that AI dominated MWC this year. But there were lots of other notable trends on the rise – including cybersecurity and data centres – and some that were disappointingly overlooked. Find out what the STL Partners team saw and missed at MWC 2025.

Ten years of private network deployments tracked in our global insights tool.
Telco cloud deployment activity slowed down in Q2 2024 with only 20 deployments added to the tracker, eight of which were completed in earlier years. The remaining 12 included five 5G NSA cores (four already launched) and three SA cores, all of which we expect to go live by the end of 2024. In this report we analyse the prospects for 5G SA including a deep-dive on the state of deployments on the public cloud.

DTW24 showed a telecoms industry ready to face reality and making quiet progress. This progress may not go far or fast enough to change the future of the industry, but either way AI will play a big role.

The telecoms industry is awash with talk of the revenue opportunity from network exposure. This report highlights the main findings from our recently released network API monetisation market forecast tool, focusing on the use cases and APIs which will generate long-term growth.

Vendors and hyperscalers want to serve telcos with cloud-native network functions that are public cloud-ready – but there are few takers. What should they do?
Telco cloud activity in 2024 is showing signs of growing momentum with 72 deployments in the year to date, in contrast to 90 for the whole of 2023. Even though many of these deployments are announced but yet to complete in 2024, there are improving prospects for vRAN and open RAN, alongside a positive outlook for 5G standalone.
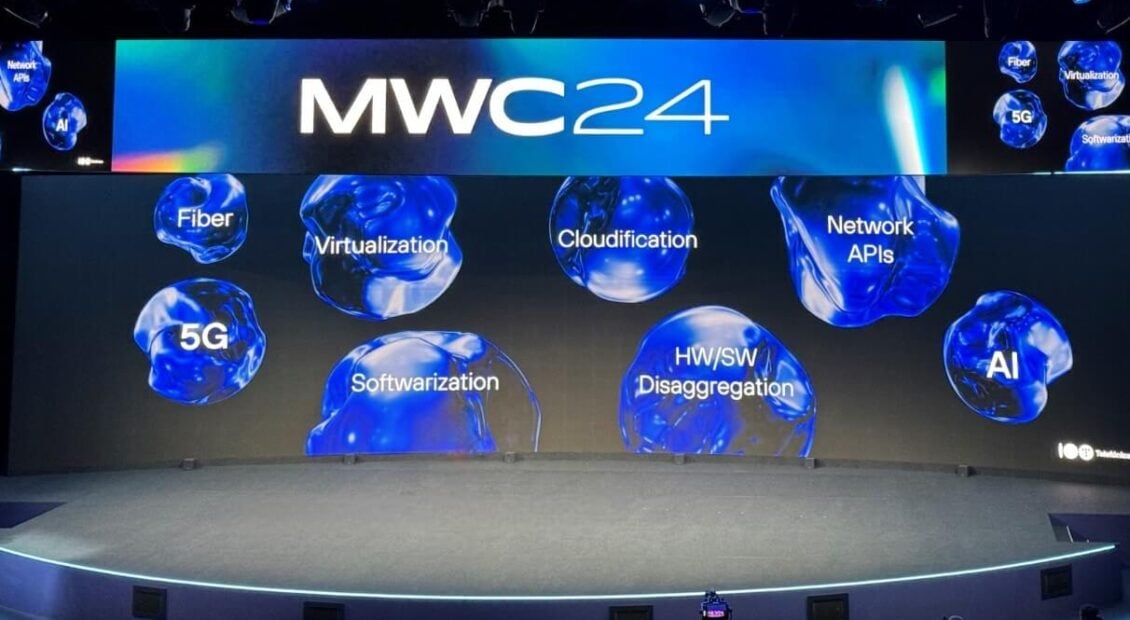
STL Partners’ Research team present their observations from and analysis of the biggest mobile industry event of the year. There was a lot of buzz around AI and API but behind the tech jargon, we saw evidence that our industry continues to morph to become more open and customer-focused.