How can telcos be loved?

Why should telcos care about being a ‘loved brand’?

If you are from an engineering or financial background, it can be tempting to look at branding and think it is a trivial or ‘soft’ aspect of business. This is valid in the sense that perceptions are inherently subjective, but this subjectivity does not mean that such perceptions are unimportant. People respond very strongly and instinctively to emotional stimuli. These responses are deep in our nature. We have evolved to quickly learn the characteristics of things that we want to repeat; the things we like. This extends to social behaviours too: Who do we want to be with, and be seen to be with? Which ‘tribe’ are we in, and who do we associate with?

Businesses have learnt a lot about this, because it has proved hugely valuable to the best practitioners, and the study and practices of marketing, advertising and branding have developed significantly in the past seventy years as a result. To be a ‘loved brand’ is a shorthand description of the ideal state.

What is a loved brand and what are the advantages?

Loved brands create strong emotional bonds with their customers, through a set of values and beliefs that customers can identify with and incorporate into their daily lives. In theory, businesses with loved brands have a range of advantages over others, which over time create significant financial benefits.

Business advantages for loved brands

Source: STL Partners

They enable businesses to charge a premium over other competitors as consumers pay less notice to the price of products sold by the loved brand.

  1. Loved brands can charge a premium over other competitors as consumers pay less notice to the price of products sold by the loved brand. Apple iPhones are generally more expensive than competitors’ phones with similar feature sets. However, many Apple customers remain loyal with the status of owning the latest iPhone outweighing the additional cost.
  2. The emotional bonds with loved brands can become so robust that their customers do not consider their competitors and forcefully defend the brand. Customers are even willing to forgive the brand for making some mistakes.In 2010, Ferrari recalled more than one thousand Italia 458 cars after reports that a design fault could cause them to catch fire.Despite the obvious negative publicity, which would have had a catastrophic consequence on many manufacturers, Ferrari’s strong emotional connection with its customers protected their position in the luxury car market.
  3. Customers become valuable promotors of loved brands on their social networks, pushing the benefits and encouraging others to join. Tesla provides a great illustration of this advantage, where many of the customers are not only delighted with their new electric vehicle, but they are also strong advocates in persuading their friends and family to purchase a Tesla for themselves.
  4. Loved brands attract the best talent, which helps the business to sustain its success.

Enter your details below to request an extract of the report

Table of Contents

  • Executive Summary
  • Loved brands
    • Why should telcos care about being a ‘loved brand’?
    • What is a loved brand and what are the advantages?
  • Challenges for telcos in being a loved brand
    • How are telcos viewed by their customers?
    • Why do telcos find it hard to be loved?
  • Common telco strategies that have had limited success to date
    • Focus on having the best network
    • Offering the lowest prices in the market
    • Differentiating on customer relationship
    • Offering content bundles
    • Launching new service innovation and diversification strategies
  • What strategies could telcos adopt to succeed going forward?
  • Case study 1: TELUS brand positioning
  • Case study 2: o2 Priority Moments
  • Case study 3: MTN – sustainable economic value
  • Case study 4: Telstra Health
  • Deep dive: What learnings can be drawn from successful strategies adopted by Orange
    • What has Orange done?
    • What has been the impact on Orange’s results?
    • How has strategy contributed to Orange being a loved brand?
    • What lessons are there for other operators?
  • How do others develop and sustain “the love”?
  • Recommendations for being a loved brand in the new era for telecoms
  • Index

Related research


AI & automation for telcos: Mapping the financial value

This is an update to STL Partners report A3 for telcos: Mapping the financial value, published in May 2020, which estimated the financial value of automation, AI and analytics (A3) through bottom up analysis of potential capex/opex savings or revenue uplift from integrating A3 into 150+ processes across a telco’s core operations.

The value is measured on an annual basis in dollar terms and as a proportion of total revenue for a “standard telecoms operator”. Access to the full methodology and definition of a standard telco is available in the report Appendix.

We categorise the value of automation, AI and analytics (A3) in telecoms across operational area, as well as type and purpose of A3 technology. Our graphic below summarises the value of A3 across the following six types of technology:

  1. Making sense of complex data: Analytics and machine learning used to understand large, mostly structured data sets, looking for patterns to diagnose problems and predict/prescribe resolutions.
  2. Automating processes: Intelligent automation and RPA to enable decision making, orchestration and task completion within telco processes.
  3. Personalising customer interactions: Analytics and machine learning used to understand customer data, create segmentation, identify triggers and prescribe actions to be taken.
  4. Support business planning: Analytics and machine learning used in forecasting and optimisation exercises.
  5. Augmenting human capabilities: AI solutions such as natural language processing and text analytics used to understand human intent or sentiment, to support interactions between customers or employees and telco systems.
  6. Frontier AI solutions: A number of individual AI solutions which have particular, specialist uses within a telco.

For further detail on this categorisation methodology, see STL Partners report The telco A3 application map

Enter your details below to request an extract of the report

What’s new in 2022

The colouring of the use case categories in the graphic below remains largely unchanged from May 2020. Some uses of A3 were reasonably mature in that timeframe and already rolled out in a typical telco, so their value was already well understood.

We estimate that the most valuable use case categories, primarily in networks and operations, deliver over $50 millions in annual benefits – and sometimes up to hundreds of millions. Throughout this report we express the value in dollar terms and as a percentage of savings within each domain. This is because while $50 million is clearly a significant sum, it accounts for just 0.33% of total revenues for our standard operator, so showing values for unique use case categories as a proportion of total revenues undermines the potential value A3 can add to individual teams, and in turn contribute to significant aggregate value across an operator.

Overview of the financial value of A3

financual-value-A3

Source: STL Partners, Charlotte Patrick Consult

In our May 2020 research, many of the more sophisticated uses of A3 were understood in theory but yet to be implemented. Researching these various newer uses cases throughout 2021 has revealed that many are now, at least partly, rolled out (although some are still waiting for cleaner data or more orchestration capabilities).

However, there were a few new case studies with financial benefits that necessitated more than small changes to the 2020 financial value calculations. Summarising the changes illustrated in the graphic above:

  • The most noticeable change in uptake for A3 was in the BSS domain. Vendors and telcos were not discussing much beyond RPA and basic analytics in 2020, but there are now a whole range of potential uses for ML (typically in the box labelled “Revenue management” in the graphic above). The question of how much additional financial value to assign to this is interesting – some of the A3 will ensure that the rating and charging systems can cope with the additional volume and complexity around 5G and IoT billing, so an allocation of revenue uplift has been assigned. However, this revenue benefit only accounts for around 6% of the additional $83 million in value from A3 in networks and operations estimated in this update.
  • We have added partner management as a new use case category, within operations. This is to allow A3 value to be added as telcos work with more partners and in new ecosystems, and accounts for 6% of additional value in networks and operations in this update.
  • An increase in the assumed value of A3 within marketing programs, owing to the addition of ML to improve the design of new offers.
  • The value of a previous use case category labelled “Troubleshooting” has been subsumed into “Unassisted channels”, as telcos find it difficult to implement troubleshooting tools for customers.
  • Some increase in financial benefit around customer chatbots and field services, due to new case studies showing financial value.

Our report includes a section for each of the first three columns of the graphic above (Networks and operations, customer channels, marketing and sales). The final column (other functions) doesn’t currently have financial calculations underpinning it as values are thought to be insubstantial in comparison to the first three columns.

Table of contents

  • Executive summary
  • Overview of the financial value of automation, AI and analytics (A3)
  • Financial value by business unit
    • BSS, OSS and networks
    • Customer channels
    • Sales and marketing
  • Appendix
    • Methodology for Calculating Financial Value
    • Augmented Analytics Capabilities

Related Research

Enter your details below to request an extract of the report

A3 in customer experience: Possibilities for personalisation

The value of A3 in customer experience

This report considers the financial value to a telco of using A3 technologies (analytics, automation and AI) to improve customer experience. It examines the key area which underpins much of this financial value – customer support channels – considering the trends in this area and how the area might change in future, shaping the requirement for A3.

Calculating the value of improving customer experience is complex: it can be difficult to identify the specific action that improved a customer’s perception of their experience, and then to assess the impact of this improvement on their subsequent behaviour.

While it is difficult to draw causal links between telcos’ A3 activities and customer perceptions and behaviours, there are still some clearly measurable financial benefits from these investments. We estimate this value by leveraging our broader analysis of the financial value of A3 in telecoms, and then zooming in on the specific pockets of value which relate to improved customer experience (e.g. churn reduction).

Enter your details below to request an extract of the report

The diagram below illustrates that there are two parts of the customer journey where A3 will add most value to customer experience:

  1. The performance of the network, services, devices and applications is increasingly dependent on automation and intelligence, with the introduction of 5G and cloud-native operations. Without A3 capabilities it will be difficult to meet quality of service standards, understand customer-affecting issues and turn up new services at speed.
  2. The contact centre remains one of the largest influencers of customer experience and one of the biggest users of automation, with the digital channels increasing in importance during the pandemic. Understanding the customer and the agent’s needs and providing information about issues the customer is experiencing to both parties are areas where more A3 should be used in future.

Where is the financial benefit of adding A3 within a typical telco customer journey?

A3 customer experience

Source: STL Partners, Charlotte Patrick Consult

As per this diagram, many of the most valuable uses for A3 are in the contact centre and digital channels. Improvements in customer experience will be tied with trends in both. These priority trends and potential A3 solutions are outlined the following two tables:
• The first shows contact centre priorities,
• The second shows priorities for the digital channels.

Priorities in the contact centre

A3 Contact centre

Priorities in the digital channel

A3 Digital channel

Table of Contents

  • Executive Summary
  • The value of A3 in customer experience
  • Use of A3 to improve customer experience
  • The most important uses of A3 for improving the customer experience
    • Complex data
    • Personalisation
    • Planning
    • Human-machine interaction
    • AI point solution
  • Conclusion
  • Appendix: Methodology for calculating financial value
  • Index

Related Research:

Enter your details below to request an extract of the report

The state of the art on work from home propositions

=======================================================================================

Download the additional file on the left for the PPT chart pack accompanying this report

=======================================================================================

WFH: From survival to strategy

The imposed shift to homeworking has divided many businesses. Some (including Facebook, Twitter, Slack, Microsoft, Indeed, AMEX, Mastercard) say they will never require office work again, whereas others are eager to bring back the personal element and re-introduce the “office dynamic”. The concept of ‘Zoom Fatigue’ has left some people pining for the office, and many companies find themselves on standby, aiming to reopen the offices to all staff during 2021.

A survey by Ipsos MORI found that the majority of people expect normality to return somewhere between six months to two years. One thing is apparent – the ability and timing to even consider a full return to work is uncertain.

Figure 1: Ipsos MORI survey of homeworkers in the UK

Ipsos Mori WFH survey

Source: Ipsos MORI

Enter your details below to request an extract of the report

When the lockdowns started, uncertainty caused paralysis to strategic initiatives as budgets diverted towards creating a Work From Home (WFH) culture. Survival became the priority for businesses, delaying planned spend on corporate connectivity and networking. That same survival instinct saw telcos and suppliers react and reposition products and services toward remote work.

As WFH continued throughout the pandemic various advantages came to the fore, such as reduction in pollution from travel and the ability to hire great talent which may not be located near a corporate office. Businesses started or accelerated a journey of massive (and sometimes painful) transformation but, from that, have either accelerated or embarked on a digital transformation journey. The gains in efficiency and business opportunity have the potential to be significant. WFH is no longer an approach to survival but instead, part of a broader strategy to optimise operations across a

increasingly complex physical and digital worlds. This growing need across all enterprises and consumers is one of the key elements within STL’s vision of the Coordination Age.

A hybrid approach is here to stay

Homeworking must continue for some time to come as we wait for the pandemic to subside. As we have adopted a homeworking culture, albeit forced upon us, the investments in people, technologies and processes have already been committed. Although there is much conflicting opinion about the long-term outcomes, there is no looking back. The workplace has transformed, and the connectivity and business enablement products to support it have become commonplace.

There are three considerations which will continue to drive the support and growth of WFH.

  1. Covid-19 does not have a defined end. The uncertainty and unfortunate lengthy road to fully managing the virus means that businesses will need to continue efforts towards supporting a large amount of remote work.
  2. Remaining relevant. Many businesses will embrace a no-office, online-only culture (including typical storefronts) in response to changing customer and employee preferences. To do business in such an environment will require the adoption of the latest online tools and practices.
  3. Investment in digital transformation. Before Covid-19 and independent to any prior appetite for home working, digital transformation has already led many businesses to adopt cloud services, online collaboration tools and uCaaS solutions for voice and video. It is now generally accepted that Covid-19 has accelerated and rapidly matured the integration of these solutions into many businesses. According to BT, the “technology/digital transformation journey” in the UK has been sped up by almost 5.5 years.

The support of WFH, fully or hybrid, is therefore strategic and something likely to feature in business plans for the foreseeable future. Even when offices do eventually begin to fill up again, work from home will transition and merge into the “work from anywhere” culture.

Telcos are in a unique position to provide all the connectivity and services required to assist in these projects, but to do that they need to offer appropriately positioned solutions. As consumer and business connectivity become intertwined, it creates a large area of uncertainty for businesses. As both consumer and business connectivity are core competencies for telcos, bringing the two together is the next natural step.

The telco role: An opportunity or obligation?

The adaptation of businesses towards increased homeworking is, of course, complex and touches nearly every part of the business, from people to processes and technology. Almost every business function will have invested considerable time and effort towards establishing new ways of working. In many cases, this would result in a change to the supporting technologies.

Underpinning all of this is a large assumption that each employee will be able to reliably connect to the new virtual business environment from wherever they want, and the technology will just work. To all but the most technically advanced businesses, the homeworker’s personal connectivity is just that – personal – and not an area that many businesses can currently manage.

The telco is in a unique position when it comes to WFH as it can touch every part of the service delivery chain. With many businesses unable to address the broad spectrum of WFH needs, the opportunity for telcos is to offer the enabling services. Telco solutions must now support businesses by providing the right mix of physical connectivity and enablement services.

Figure 2: The telco touchpoints in WFH service delivery

The touch points in telco WFH service delivery

Source: STL Partners

Telcos have had an obligation to provide continued service to businesses and homes, throughout the pandemic. Universal service obligations needed to be maintained while national charters to keep the country connected were agreed. When the pandemic started, the demand for connectivity within the business segment shifted to the consumer segment and telcos had to respond.

Businesses initially froze all internal connectivity projects and focused on the remote workforce — this impacted Q2 revenues in telcos’ business segments. At the same time telcos did everything they could to make the transition as easy as possible, removing data limits and speed caps and providing free trials of collaboration and communications tools. More detail is provided in STL Partners review of the initial telco responses.

Figure 3: Liberty Global Q3 2020 results illustrate the impact to the business segment

Liberty Global Q320 results

Source: Liberty Global

Eventually IT infrastructure projects re-started. Businesses with significant office-based operations (as opposed to, e.g. manufacturing) applied new focus on creating more flexible and agile networks which can support mass WFH. The dependency on digital collaboration and ensuring that homeworkers can work without disruption has now become a high priority. A Q3 improvement in business spending is partly down to collaboration enabling technologies creating new opportunities for telcos – to address the shifts from legacy business spend on connecting large sites towards a more distributed concept where households connectivity is both personal and business focused.

Consumer connectivity products must now simply articulate the support for all household needs, including WFH. Business products must enable the agility a business needs to adapt to any future changes, while easily embracing their employees’ consumer connectivity.


Table of Contents

  • Executive Summary
    • A six point plan for embracing WFH opportunities
    • How telcos responded to ‘work going home’ in 2020
    • Two essential areas in need of development
    • What next: Considerations for different types of telco
  • Introduction
    • WFH: From survival to strategy
    • A hybrid approach is here to stay
    • The telco role: An opportunity or obligation?
    • Embracing the consumer architecture
  • The WFH journey: From initial responses to strategic opportunities
    • Uncoordinated connectivity: The initial stakeholder responses
    • Intelligent networking for WFH
    • Long term WFH: The telco opportunity
  • Telco WFH propositions today
    • How telcos are positioning WFH services
    • Consumer broadband: Overlay services for the household
    • Dedicated WFH: Made-to-measure
    • WFH as part of wider transformation efforts
  • Conclusion and recommendations
    • The innovation opportunity

Enter your details below to request an extract of the report

A3 for telcos: Mapping the financial value

What is analytics, AI and automation worth to telecoms operators?

This report is the second in a two-part series mapping the process and assessing the financial value of automation, analytics and artificial intelligence (AI) in telecoms. In the first report, The value of analytics, automation and AI for telcos – Part 1: The telco A3 application map, we outlined which type of technology was best suited to which processes across a telco’s operations.

In this report, we assess the financial value of each of the operational areas, in dollar terms, for an average telco. Based on our assessment of operator financials and operational KPIs, the figure below outlines our assumptions on the characteristics of an “average” telco used as the basis for our financial modelling. The characteristics of this telco are as shown below, with a slight skew towards developed market operator characteristics since this is currently where most industry proof points used in our modelling have been implemented.

The characteristics of an average telco

characteristics of an average telco

Source: STL Partners, Charlotte Patrick Consult

The first report in the series analysed how each A3 technology could be applied similarly across different functional units of a telecoms operator, e.g. machine learning or automation each have similar processes in network management, channel management and sales and marketing.

Evaluating AI and automation use cases in four domains

To measure financial impact, this report returns to a traditional breakdown of value by functional unit within the telco, breaking down into four key areas:

  1. Network operations: Network deployment, management and maintenance, and revenue management
  2. Fraud: Including services, online, and internal fraud risks
  3. Customer care: Including all assisted and unassisted channels
  4. Marketing and sales: Understanding customers, managing products, marketing programs, lead management and sales processes.

Through an assessment of nearly 150 individual process areas across a telecoms operator’s core operations, we estimate that A3 can deliver the average telco more than $1 billion dollars in value per year, through a combination of revenue uplift and opex and capex savings, equivalent to 7% of total annual revenues.

As illustrated below, core network operations management accounts for by far the greatest proportion of the value.

The relative value of automation, AI and analytics across telco operations

The relative value of AI, automation and analytics across telco operations

Source: STL Partners, Charlotte Patrick Consult

This likely still underrepresents the total, long term potential value of A3 to telcos, since this first iteration does not model the value of A3 processes in areas less unique to telecoms, including supply chain, finance, IT and HR. No doubt that even within the core area of operations, there are potential process areas that have yet to be discovered or proven, and which we have overlooked in our initial attempt to model the value of A3 to telcos. Meanwhile, this is focused purely on telco’s internal operations so also excludes any potential revenue uplift from new A3-enabled services, such as data monetisation or development of AI-as-a-service type solutions.

That said, operators cannot implement all of these processes at once. The enormous challenge of restructuring processes to be more automated and data-centric, putting in place the data management and analytics capabilities, training employees and acquiring new skills, among many others, means that while many leading telcos are well on their way to capturing this value in some areas, very few – if any – have implemented A3 across all process areas. As a benchmark, Telefónica is an industry leader in leveraging automation and AI to improve operational efficiency, and in 2019 it reported total operational savings of €429mn across the entire group. While this is primarily focused on customer facing channels, so likely excludes the value of A3 in many network operations processes, for instance energy efficiency which is delivering significant value to Telefónica and others, it suggests there remains lots of value still to capture.

Enter your details below to request an extract of the report

Methodology

The financial modelling for the value of A3 was done through an individual assessment of each of the 150+ process areas to understand the main activities within that area of operations, and how automation, analytics and/or machine learning and other AI technologies could be used within those activities. From there, we assess the value of integrating these technologies to existing operational functions to make them more efficient and effective. This means that we do not attribute any additional value to telcos from implementing new technologies that include A3 as a core element of their functionality, e.g. a multi-domain service orchestrator, implemented as part of software-defined networking.

Our bottom up assessment of each process is also validated through real-world proof points from operators or vendors. This means that more speculative areas of A3 application in operators are calculated to offer relatively limited value. As more proof points emerge, we will incorporate them into future iterations.

Table of contents

  • Executive Summary
    • Where is the largest financial benefit from A3?
    • What should telcos prioritise in the short term?
    • How long will it take for telcos to realise this value?
    • What next?
  • Introduction
    • Methodology
  • Breaking down the value of A3 by operational area
    • Network, OSS and BSS
    • Fraud management
    • Care and commercial channels
    • Marketing and sales
  • Conclusions and recommendations

Enter your details below to request an extract of the report

Telco economics: The price of loyalty

The Cost of Churn for Mobile Operators

Customer churn continues to present a significant and costly challenge to the mobile industry. Churn rates for MNOs can range from less than 0.75% per month (c. 9% pa) to over 5% per month (80% pa). Postpay rates of churn are usually lower and typically lie between 0.75% and 3% per month (c. 9–43% pa), whereas prepay churn typically lies between 3% and 5% (30–80%pa), although it can be as low as 1% in some circumstances, for example when number portability is not permitted.

The costs of churn are felt in several ways. The major costs come from lost revenues from customers churning away and the costs of acquiring new customers to replace them. During periods of high growth operators can also lose significant market share, and hence revenues and profit, if much of their expenditure on acquiring new customers is devoted to replacing customers that have churned away, rather than on growing their subscriber base.

Analysis of data published by operators shows that average costs of acquisition (CoA) are about four times average monthly ARPU, and it will therefore typically take over four months’ revenue to repay the SAC incurred. The figure is slightly higher on average for postpay customers at about 4½, whereas prepay CoA is on average between 1½ and 1¾ times ARPU.

We estimate that the industry average EBITDA is around 25%, so for an individual postpay subscriber it will take on average 17 months to repay the investment from EBITDA. With typical contract lengths of 24 months, this does not leave much time to generate a positive margin.

These costs mean that it is important for operators to find ways of minimising churn and of maintaining it at a low level.

Some level of churn is inevitable, since customers may move to a new region or country, die, or perhaps acquire a new phone and subscription from their employers as part of their job. Other forms of churn are largely voluntary, and operators have to focus their efforts on these if they are to contain their costs of doing business.

In doing so, operators can find it worthwhile to take into account the different characteristics of their customers. Some people show a much greater propensity to churn and are always seeking improved tariffs or a better deal, but many others remain loyal. If the latter churn, they are more likely to do so for other reasons, such as poor quality of service.

Enter your details below to request an extract of the report

Mobile Operators Strategies for Reducing Churn

In an attempt to find an effective means of reducing churn, mobile operators have adopted a variety of churn reduction strategies. These include:

  • Offering financial or other incentives to customers who are about to churn, such as discounted handsets or tariff bundles.
  • Monitoring usage and using data analytics to predict which customers are likely to churn in the near future and offering them incentives and improved service bundles.
  • Using more flexible contracts to allow early upgrades or other changes.
  • Giving bonuses (e.g. extra minutes or increased data allowances) or other rewards for loyalty.
  • Offering multiple services, such as quad play, to increase the stickiness of their service.
  • Offering additional and popular services, such as Spotify or Netflix, at attractive rates or bundled with basic services, or discounted entry to events.
  • Improving overall customer experience and service quality to reduce the triggers for churn. This can include significant organisational and cultural changes and efficiency improvements including increased automation. Changes include transfer of customer support functions to marketing, and the introduction of chatbots and apps to speed up and improve handling of routine customer enquiries.

Causes of Customer Churn

This report reviews the causes of churn and the characteristics of customers that are most likely to churn. It draws on examples from operators’ experiences to illustrate different strategies used by operators to reduce churn and to establish which approaches have proved most successful in delivering reductions in the level of churn or in maintaining low levels that have already been achieved. It also looks at the costs associated with churn and their impact on revenues and profitability. Operators discussed include TELUS, O2 and Telstra, which provide examples of MNOs that have achieved low levels of churn, and Globe, which provides useful insight into the different customer behaviours found in a predominately prepay and multi-SIM market and an example of the relationship between churn and SAC.

Contents:

  • Executive Summary
  • Actions of successful operators
  • Financial implications of churn
  • Benchmarks
  • Introduction
  • Causes and costs of churn and remedies
  • Customer behaviours
  • Costs of churn
  • Common approaches to reducing churn
  • Case studies and results
  • TELUS: churn fell over five years
  • O2 outsourcing: changing approach to customer experience
  • Telstra: analytics and customer experience
  • Globe Telecom: costs of churn
  • Cricket: reducing churn in low-cost prepay
  • Adjacent and complementary services
  • Conclusions
  • Customer behaviours
  • Costs of churn
  • Actions of successful operators
  • Benchmarks
  • Resulting organisational and financial issues faced by operators
  • Recommendations

Figures:

  • Figure 1: Share of TELUS revenues taken by SAC and SRC
  • Figure 2: Costs of churn when CoA = 50% annual ARPU
  • Figure 3: Examples of reasons/triggers for customer churn
  • Figure 4: Mobile customer characteristics
  • Figure 5: Customer average lifetime versus lifetime value
  • Figure 6: Relative proportions of customer types in mature markets
  • Figure 7: Costs of churn when CoA = 50% annual ARPU
  • Figure 8: Costs of churn when CoA = 80% annual ARPU
  • Figure 9: Costs of churn when CoA = 10% annual ARPU
  • Figure 10: TELUS monthly churn
  • Figure 11: TELUS EBITDA
  • Figure 12: TELUS monthly ARPU 2007–2016
  • Figure 13: TELUS SAC and SRC % of revenues
  • Figure 14: TELUS costs of acquisition and ARPU
  • Figure 15: TELUS SAC, SRC and EBITDA
  • Figure 16: UK MNOs blended churn
  • Figure 17: O2 customer satisfaction
  • Figure 18: Telstra annual postpay churn 2012–2017
  • Figure 19: Telstra revenues by service
  • Figure 20: Telstra ARPU
  • Figure 21: Telstra EBITDA
  • Figure 22: Globe prepay customers 2011–2017
  • Figure 23: Globe postpay customers 2012–2017
  • Figure 24: Globe revenues 2012–2017
  • Figure 25: Globe and TM prepay and postpay monthly churn
  • Figure 26: Inverse relationship between Globe’s postpay SAC and churn
  • Figure 27: Examples of costs of churn and CoA

Enter your details below to request an extract of the report

Digital M&A and Investment Strategies – July 2017 update

Introduction

Digital M&A as a telco strategy

In June 2016 STL Partners published our inaugural Digital M&A and Investment Strategies report and accompanying database, focussing on key digital acquisitions and investments for 22 operators during the period 2012 – H1 2016. We have now updated this report to cover the following 12 months (H2 2016 – H1 2017), to examine new developments in telco digital M&A and a comparison with previous activities.

Communications service providers have long used M&A as a key growth strategy, with the most common approach being to acquire other operators to build scale organically. As growth in telecommunications slowed and user behaviour swung towards mobile, so M&A activity in the mobile sector has increased. However, acquisition opportunities in mature markets are becoming limited as consolidation reduces the number of telcos, whilst in Europe and North America the regulatory environment has made M&A consolidation strategies less viable.

As operators continue to build digital capabilities and strive to deliver digital services and content, M&A and investment beyond ‘traditional telecoms’ is increasing. Telcos need to move beyond a traditional, slow ‘infrastructure-only’ approach, to one focused on agility rather than stability, enablement rather than end-to-end ownership and delivery of solutions, and innovation as well as operational excellence. This report explores the drivers of digital M&A and the strategies of different operators including ‘deep-dive’ analysis of Verizon, AT&T and SoftBank. There is an accompanying database which tracks telco M&A activity for the period.

Drivers for operator M&A and majority investment

Figure 1: Drivers for operator M&A and majority investment – traditional and digital

digital M&A graphic

Source: STL Partners

Traditional/Telco 1.0 drivers: reach and scale

As illustrated in Figure 1, what we refer to as ‘traditional’ or ‘Telco 1.0’ drivers for M&A and investment are well-established:

  1. Extending geographic footprint is a common trend, as many operator groups look to:
    • Enter new markets that are adjacent geographically (e.g. DTAG’s numerous investments in CEE region operators, America Movil’s investments in LatAm),
    • Enter markets that are linked culturally or linguistically (e.g., Telefonica’s acquisitions and investments in Latin American operators),
    • Enter markets that simply offer good opportunities for expanded footprint and increased efficiencies of operation in emerging regions where demand for mobile services is still growing strongly (e.g., SingTel and Etisalat’s numerous investments in operators in Asia and Africa, respectively).
  2. Extending traditional communications offerings is currently the most significant trend, as mobile operators look to acquire fixed network assets and vice versa, to develop compelling multiplay and converged offers for their customers. The recent BT acquisition of EE in the UK is one example.
  3. Consolidation has slowed to some extent, as regulators and competitors fight against mergers or acquisitions that remove players from the market or concentrate too much market power in the hands of stronger service providers. This has been a particular issue in the European Union, where regulators have refused to approve several proposed telecoms M&A deals recently, including Telia and Telenor in Denmark in 2015, and the proposed Hutchison acquisition of Telefónica’s O2 to merge with its subsidiary 3 UK in 2016. Other deals, such as the proposed Orange-Bouygues Telecom merger in France which was abandoned in April 2016, have failed due to the parties involved failing to reach agreement. However, our research shows continued interest in operator M&A for consolidation, with recent examples including Orange’s acquisition of Sun Communications in Moldova in 2016, and Vodafone’s merger with Indian rival Idea in 2017.
  4. The acquisition of service partners – primarily channel partners, or partner companies providing systems integration and consultancy capabilities, typically for enterprise customers – has proved an important driver of M&A for many (mainly converged) operators.
  5. Finally, operator M&A is also being driven by the enthusiasm of sellers. Many operators are looking to sell off assets outside of their home markets, pulling back from markets that have proven too competitive, too small or simply too complicated, as part of a strategy to pay down debt and/or free up assets for investment in other higher-growth areas:
    • Telia’s pullback from its non-core markets has seen it sell off its majority stakes in Spanish operator Yoigo to Masmovil and in Kazakhstan’s Kcell to Turkcell in 2016
    • Telefonica’s attempt to sell its O2 UK mobile unit to CK Hutchison having failed, the Spanish operator is now looking to other ways of raising capital both to pay down its debt, including a planned IPO of O2 UK.

Contents:

  • Executive Summary
  • Evaluating operator digital investment strategies
  • Key findings
  • Recommendations
  • Introduction
  • Drivers for operator M&A and majority investment
  • Evaluating operator digital investment strategies
  • 22 players across 5 regions: US shows the most aggressive M&A activity
  • Comparison with previous period (H1 2012 – H1 2016)
  • European telcos remain largely focussed on Telco 1.0 M&A
  • Which sectors are attracting the most interest?
  • Telco M&A investment is falling behind other verticals
  • What are the cultural challenges to digital M&A in the boardroom?
  • Operator M&A Strategies in detail: Consolidation, content and technology
  • M&A as a telco growth strategy
  • Adapting telco culture to ensure digital M&A success
  • Recommendations

Figures:

  • Figure 1: Drivers for operator M&A and majority investment – traditional and digital
  • Figure 2: Number of operator digital acquisitions and majority investments, H2 2016-H1 2017
  • Figure 3: Largest 7 telco digital M&A and majority investments, H2 2016-H1 2017
  • Figure 4: Number of operator digital acquisitions and majority investments, H1 2012 – H1 2016
  • Figure 5: Operator digital acquisitions and majority investments, H1 2012-H1 2017
  • Figure 6: Largest 10 telco digital M&A and majority investments, H1 2012 – H1 2016
  • Figure 7: Mapping of operator digital M&A strategies
  • Figure 8: Number of digital M&A and majority investments by sector/category, H2 2016-H1 2017
  • Figure 9: Comparison of investment in digital M&A as a percentage of service revenues, 2012-H1 2017

Amazon, Apple, Facebook, Google, Netflix: Whose digital content is king?

Introduction

This report analyses the market position and strategies of five global online entertainment platforms – Amazon, Apple, Facebook, Google and Netflix.

It also explores how improvements in digital technologies, consumer electronics and bandwidth are changing the online entertainment market, while explaining the ongoing uncertainty around net neutrality. The report then considers how well each of the five major entertainment platforms is prepared for the likely technological and regulatory changes in this market. Finally, it provides a high level overview of the implications for telco, paving the way for a forthcoming STL Partners report going into more detail about potential strategies for telcos in online entertainment.

The rise and rise of online entertainment

As in many other sectors, digital technologies are shaking up the global entertainment industry, giving rise to a new world order. Now that 3.2 billion people around the world have Internet access, according to the ITU, entertainment is increasingly delivered online and on-demand.

Mobile and online entertainment accounts for US$195 million (almost 11%) of the US$1.8 trillion global entertainment market today. By some estimates, that figure is on course to rise to more than 13% of the global entertainment market, which could be worth US$2.2 trillion in 2019.

Two leading distributors of online content – Google and Facebook – have infiltrated the top ten media owners in the world as defined by ZenithOptimedia (see Figure 1). ZenithOptimedia ranks media companies according to all the revenues they derive from businesses that support advertising – television broadcasting, newspaper publishing, Internet search, social media, and so on. As well as advertising revenues, it includes all revenues generated by these businesses, such as circulation revenues for newspapers or magazines. However, for pay-TV providers, only revenues from content in which the company sells advertising are included.

Figure 1 – How Google and Facebook differ from other leading media owners

Source: ZenithOptimedia, May 2015/STL Partners

ZenithOptimedia says this approach provides a clear picture of the size and negotiating power of the biggest global media owners that advertisers and agencies have to deal with. Note, Figure 1 draws on data from the financial year 2013, which is the latest year for which ZenithOptimedia had consistent revenue figures from all of the publicly listed companies. Facebook, which is growing fast, will almost certainly have climbed up the table since then.

Figure 1 also shows STL Partners’ view of the extent to which each of the top ten media owners is involved in the four key roles in the online content value chain. These four key roles are:

  1. Programme: Content creation. E.g. producing drama series, movies or live sports programmes.
  2. Package: Content curation. E.g. packaging programmes into channels or music into playlists and then selling these packages on a subscription basis or providing them free, supported by advertising.
  3. Platform: Content distribution. E.g. Distributing TV channels, films or music created and curated by another entity.
  4. Pipe: Providing connectivity. E.g. providing Internet access

Increasing vertical integration

Most of the world’s top ten media owners have traditionally focused on programming and packaging, but the rise of the Internet with its global reach has brought unprecedented economies of scale and scope to the platform players, enabling Google and now Facebook to break into the top ten. These digital disruptors earn advertising revenues by providing expansive two-sided platforms that link creators with viewers. However, intensifying competition from other major ecosystems, such as Amazon, and specialists, such as Netflix, is prompting Google, in particular, to seek new sources of differentiation. The search giant is increasingly investing in creating and packaging its own content.  The need to support an expanding range of digital devices and multiple distribution networks is also blurring the boundaries between the packaging and platform roles (see Figure 2, below) – platforms increasingly need to package content in different ways for different devices and for different devices.

Figure 2 – How the key roles in online content are changing

Source: STL Partners

These forces are prompting most of the major media groups, including Google and, to a lesser extent, Facebook, to expand across the value chain. Some of the largest telcos, including Verizon and BT, are also investing heavily in programming and packaging, as they seek to fend off competition from vertically-integrated media groups, such as Comcast and Sky (part of 21st Century Fox), who are selling broadband connectivity, as well as content.

In summary, the strongest media groups will increasingly create their own exclusive programming, package it for different devices and sell it through expansive distribution platforms that also re-sell third party content. These three elements feed of each other – the behavioural data captured by the platform can be used to improve the programming and packaging, creating a virtuous circle that attracts more customers and advertisers, generating economies of scale.

Although some leading media groups also own pipes, providing connectivity is less strategically important – consumers are increasingly happy to source their entertainment from over-the-top propositions. Instead of investing in networks, the leading media and Internet groups lobby regulators and run public relations campaigns to ensure telcos and cablecos don’t discriminate against over-the-top services. As long as these pipes are delivering adequate bandwidth and are sufficiently responsive, there is little need for the major media groups to become pipes.

The flip-side of this is that if telcos can convince the regulator and the media owners that there is a consumer and business benefit to differentiated network services (or discrimination to use the pejorative term), then the value of the pipe role increases. Guaranteed bandwidth or low-latency are a couple of the potential areas that telcos could potentially pursue here but they will need to do a significantly better job in lobbying the regulator and in marketing the benefits to consumers and the content owner/distributor if this strategy is to be successful.

To be sure, Google has deployed some fibre networks in the US and is now acting as an MVNO, reselling airtime on mobile networks in the US. But these efforts are part of its public relations effort – they are primarily designed to showcase what is possible and put pressure on telcos to improve connectivity rather than mount a serious competitive challenge.

  • Introduction
  • Executive Summary
  • The rise and rise of online entertainment
  • Increasing vertical integration
  • The world’s leading online entertainment platforms
  • A regional breakdown
  • The future of online entertainment market
  • 1. Rising investment in exclusive content
  • 2. Back to the future: Live programming
  • 3. The changing face of user generated content
  • 4. Increasingly immersive games and interactive videos
  • 5. The rise of ad blockers & the threat of a privacy backlash
  • 6. Net neutrality uncertainty
  • How the online platforms are responding
  • Conclusions and implications for telcos
  • STL Partners and Telco 2.0: Change the Game


  • Google is the leading generator of online entertainment traffic in most regions
  • How future-proof are the major online platforms?
  • Figure 1: How Google and Facebook differ from other leading media owners
  • Figure 2: How the key roles in online content are changing
  • Figure 3: Google leads in most regions in terms of entertainment traffic
  • Figure 4: YouTube serves up an eclectic mix of music videos, reality TV and animals
  • Figure 5: Facebook users recommend videos to one another
  • Figure 6: Apple introduces apps for television
  • Figure 7: Netflix, Google, Facebook and Amazon all gaining share in North America
  • Figure 8: YouTube & Facebook increasingly about entertainment, not interaction
  • Figure 9: YouTube maintains lead over Facebook on American mobile networks
  • Figure 10: US smartphones may be posting fewer images and videos to Facebook
  • Figure 11: Over-the-top entertainment is a three-way fight in North America
  • Figure 12: YouTube, Facebook & Netflix erode BitTorrent usage in Europe
  • Figure 13: File sharing falling back in Europe
  • Figure 14: iTunes cedes mobile share to YouTube and Facebook in Europe
  • Figure 15: Facebook consolidates strong upstream lead on mobile in Europe
  • Figure 16: YouTube accounts for about one fifth of traffic on Europe’s networks
  • Figure 17: YouTube & BitTorrent dominate downstream fixed-line traffic in Asia-Pac
  • Figure 18: Filesharing and peercasting apps dominate the upstream segment
  • Figure 19: YouTube stretches lead on mobile networks in Asia-Pacific
  • Figure 20: YouTube neck & neck with Facebook on upstream mobile in Asia-Pac
  • Figure 21: YouTube has a large lead in the Asia-Pacific region
  • Figure 22: YouTube fends off Facebook, as Netflix gains traction in Latam
  • Figure 23: How future-proof are the major online platforms?
  • Figure 24: YouTube’s live programming tends to be very niche
  • Figure 25: Netflix’s ranking of UK Internet service providers by bandwidth delivered
  • Figure 26: After striking a deal with Netflix, Verizon moved to top of speed rankings

Apple Pay & Weve Fail: A Wake Up Call

Mobile payments: Now is the time

After many years of trials, pilots and uncertainty, the mobile industry is now making a major push to enable consumers to use their mobile phones to complete transactions in stores and other merchant venues. This year is shaping up to be a pivotal year with a number of major launches of commercial mobile payment services involving device makers, mobile operators, the payment networks and retailers.

Crucially, Apple’s move to add Near Field Communications (NFC) – a short-range communications technology – to iPhone 6 has vindicated the telecoms industry’s ongoing push to make NFC a de facto standard for mobile proximity payments. Although sceptics (including Apple executives) have previously derided the cost and complexity of the technology, Vodafone, Orange, China Mobile and other major telcos have continued to develop digital commerce propositions based on the technology.

Apple’s U-turn on NFC has changed the sentiment around the technology dramatically and given the industry a clear sense of direction. Just a year ago, research firms, such as Gartner and Juniper, scaled back their forecasts for the use of mobile handsets to complete transactions in-store, primarily because Apple didn’t include a NFC chip in the iPhone 5.

The widespread use of NFC in stores will add fuel to the mobile payments market which is already growing rapidly.  Some analysts are predicting mobile phones will be used to make transactions totalling more than US$721 billion worldwide by 2017 up from US$235 billion in 2013 (see Figure 1). Note, these figures include both remote/online and proximity/in-store transactions.

Figure 1: Global mobile payment transaction forecasts

Figure 1 - Global mobile payment transaction forecasts

Source: Gartner; Goldman Sachs (via Statista)

Although most consumers are happy paying in store using either cash or payment cards, there are two major reasons why mobile payments are gaining momentum in an increasingly digital economy:

  • Consumers will want to be able to receive and redeem offers, vouchers and loyalty points using their smartphones. A mobile payment service would enable them to do this in a straightforward way.
  • Mobile payments will generate valuable transaction data that could and should (with the consumer’s permission) be used to make highly personalised recommendations and offers.

In other words, mobile payments are an essential element of a compelling integrated digital commerce proposition.

The role of telcos

Although the big picture for mobile payments is improving, telcos are in danger of being side-lined in developed countries in this strategically important sector. (NB See the STL Partners Strategy Report, Digital Commerce 2.0: New $50bn Disruptive Opportunities for Telcos, Banks and Technology Players for a detailed study of how telcos could disrupt the key digital commerce brokers: Amazon, Google, Apple and Facebook.) In recent weeks, telcos’ efforts to lead the development of the mobile payments market suffered two major setbacks. Firstly, Apple’s fully formed mobile payments solution, called Apple Pay, effectively cuts telcos out of the mobile payments business in the Apple ecosystem.

Secondly, it emerged that Weve, the ground-breaking mobile commerce joint venture between U.K. mobile operators, has pulled back from plans to facilitate payments (in addition to its existing role of delivering targeted offers to UK mobile users).  As a rare example of a well thought through collaborative venture between mobile operators, Weve had been a promising initiative that could provide a playbook for collaboration among mobile operators in other developed markets. But Weve’s change of course suggests that mobile operators are still struggling to collaborate effectively in the digital commerce market.

Rewriting the Mobile Payments Playbook

The Apple Pay proposition

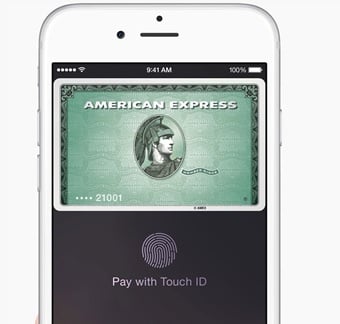
Unveiled along with the iPhone 6 and the Apple Watch in September, Apple Pay is an end-to-end mobile payments proposition developed by Apple. On the device side, the basic technical architecture is similar to that advocated by major telcos via the industry group the GSMA – the short-range wireless technology Near Field Communications (NFC) is used to transfer payment data from the device to the point of sale terminal, while a secure element (a segregated memory chip) is used to protect sensitive information from being hacked or corrupted by third-party apps. However, rather than using telcos’ SIM cards as a secure element, Apple has added its own dedicated piece of hardware to the iPhone 6 and bolstered security further with a fingerprint scanner.

Already used to organise boarding passes, tickets, coupons and other collateral, Apple’s Passbook acts as the primary interface for the Apple Pay service. In other words, Passbook is now a fully-fledged mobile wallet. Thanks to its iTunes service, Apple already has hundreds of millions of consumers’ credit and debit card details on file. These consumers can add a compatible payment card stored on iTunes to Passbook simply by entering the card security code. Alternatively, they can use the iPhone camera to scan a payment card into a handset or type in the details manually. If the consumer stores more than one card, Passbook allows them to change the default payment card that appears when they are about to make a transaction.


Figure 2: Apple has made it easy to add payment cards to Passbook

Figure 2 - Apple has made it easy to add payment cards to Passbook

Source: Apple

To make a payment in a store, the consumer simply holds their iPhone next to a NFC-enabled reader (attached to a point of sale terminal) with their finger on the handset’s Touch ID – the fingerprint reader embedded into the latest iPhones (see Figure 3). Unlike some mobile payment solutions, the consumer doesn’t need to open an app or enter a PIN code. The iPhone vibrates and beeps once the payment information has been sent. In this case, the payment information is protected by three layers of security: More than any existing mainstream mobile payments solution, including the SIM-secured NFC payments touted by telcos. These three layers are

  • Rather than transferring actual payment card details, Apple Pay transfers so-called tokens: a device-specific account number, together with a one-time security code.
  • These tokens are encrypted and stored on a secure element inside the iPhone – memory that is ring-fenced from access by any app other than Passbook. They aren’t stored on Apple’s servers, so are protected from online hacking.
  • The payment only happens if the Touch ID system recognises the consumer’s fingerprint, proving the consumer’s was in the store.

Figure 3: The consumer is authenticated via iPhone’s fingerprint scanner

Figure 3: The consumer is authenticated via the iPhone's fingerprint scanner

Source: Apple

If the consumer is using an Apple Watch, which also has a NFC chip and a secure element, they hold the face of the watch near the reader and double-click a button on the side of the watch. As the range of NFC is just a few centimetres, consumers will have to hold the face of their watch against the reader. This step doesn’t sound very intuitive and may cause confusion in stores.

Again, a vibration and beep confirm the transfer of the payment information. Note, the watch needs to have been linked to an iPhone with a compatible payment card stored in a Passbook app. Although Apple Watch isn’t equipped with the Touch ID fingerprint scanner in the iPhone, it does have alternative security mechanisms built in. Apple Watch is equipped with a biosensor that can detect when the watch is taken off and lock its payment function, according to a report by NFC World. Apparently, consumers will have to enter a code to re-enable the payment function when they put the handset back on.  These extra steps suggest making payments using Apple Watch will be more cumbersome and potentially less secure than using an iPhone 6 to make a payment.


Figure 4: You double-click a button to confirm a payment with Apple Watch

Figure 4 - You double-click a button to confirm a payment with Apple Watch

Source: Apple

Apple Pay can also be used to make online payments in compatible apps and this is how many consumers are likely to try the service initially. Apple said that several merchants, including Disney, Starbucks, Target and Uber, have adapted their apps to accept Apple Pay transactions (see Figure 5). In this case, the consumer selects Apple Pay and then places their finger on the Touch ID interface. Note, enabling online payments is an area that has been neglected by many telcos in developed countries targeting this market, but support for remote payments is an essential component of any holistic digital commerce solution  – consumers won’t want to use different digital wallets online and offline.


Figure 4: Various apps allow consumers to make payments via Apple Pay


Figure 5 - Various apps allow consumers to make payments via Apple Pay

 Source: Apple

If a consumer loses their iPhone, then they can use the Find My iPhone service to put their device into “lost mode” or they can opt to wipe the handset. The next time the iPhone goes online, it will be frozen or wiped, depending on the option the consumer selected. Note, this feature negates one of the advantages of using a SIM card, which can also be wiped remotely by a telco, as a secure element.

Although the consumer’s most recent purchases will be viewable in Passbook, Apple says it won’t save consumer’s transaction information. This is in stark contrast to the approach taken by Apple’s own iTunes service and Amazon, for example, which uses a consumer’s transaction history to make personalised product and service recommendations. With Apple Pay, it seems a consumer will only be able to check historic transactions by looking at their bank statements.

The big guns in the U.S. financial services industry are supporting Apple Pay – consumers can use credit and debit cards from the three major payment networks, American Express, MasterCard and Visa, issued by a range of leading banks, including Bank of America, Capital One Bank, Chase, Citi and Wells Fargo, representing 83% of credit card purchase volume in the US, according to Apple, which says additional banks, including Barclaycard, Navy Federal Credit Union, PNC Bank, USAA and U.S. Bank, are also planning to sign up. This is a much greater level of participation than that achieved by Softcard (formerly known as Isis), the mobile commerce joint venture between U.S. telcos AT&T Mobile, Verizon Wireless and T-Mobile USA (see next section for more on Softcard).

Apple says that more than 220,000 bricks and mortar stores will accept Apple Pay transactions. Some of the participating retailers include leading brands, such as McDonalds, Stables, Subway, ToysRUs and Walgreens. However, the retailers in the Merchant Customer Exchange (MCX) consortium, which is developing its own mobile commerce proposition, have not signed up to accept Apple Pay. These retailers include major players, such as WalMart, Best-Buy, 7-11, Gap and Sears. (See next section for more on MCX). Although only a handful of apps are supporting Apple Pay today, that number is likely to grow rapidly, as many consumers will find it easier to press the Touch ID than to type in a password.

To access the rest of this 28 page Telco 2.0 Report in full, including…

  • Introduction
  • Executive Summary
  • Mobile payments: Now is the time
  • Rewriting the Mobile Payments Playbook
  • The Apple Pay proposition
  • Will Apple Pay be a success? 
  • The implications of Apple Pay for telcos
  • The Weve U-Turn
  • How Weve broke new ground
  • Weve’s shareholders break ranks
  • Weve pulls back
  • Conclusions and recommendations

…and the following report figures…

  • Figure 1: Forecasts for the value of mobile proximity payments in the U.S 
  • Figure 2: Apple has made it easy to add payment cards to Passbook
  • Figure 3: The consumer is authenticated via the iPhone’s fingerprint scanner
  • Figure 4: You double-click a button to confirm a payment with Apple Watch
  • Figure 5: Various apps allow consumers to make payments via Apple Pay
  • Figure 6: MCX’s approach to security
  • Figure 7: Apple’s shrinking share of the global smartphone market
  • Figure 8: The Softcard wallet enables consumers to filter offers by their location
  • Figure 9: The virtuous circle Weve was aiming to create
  • Figure 10: Everything Everywhere’s Cash on Tap app is clunky to use


Mobile Marketing and Commerce: the technology battle between NFC, BLE, SIM, & Cloud

Introduction

In this briefing, we analyse the bewildering array of technologies being deployed in the on-going mobile marketing and commerce land-grab. With different digital commerce brokers backing different technologies, confusion reigns among merchants and consumers, holding back uptake. Moreover, the technological fragmentation is limiting economies of scale, keeping costs too high.

This paper is designed to help telcos and other digital commerce players make the right technological bets. Will bricks and mortar merchants embrace NFC or Bluetooth Low Energy or cloud-based solutions? If NFC does take off, will SIM cards or trusted execution environments be used to secure services? Should digital commerce brokers use SMS, in-app notifications or IP-based messaging services to interact with consumers?

STL defines Digital Commerce 2.0 as the use of new digital and mobile technologies to bring buyers and sellers together more efficiently and effectively (see Digital Commerce 2.0: New $Bn Disruptive Opportunities for Telcos, Banks and Technology Players).  Fast growing adoption of mobile, social and local services is opening up opportunities to provide consumers with highly-relevant advertising and marketing services, underpinned by secure and easy-to-use payment services. By giving people easy access to information, vouchers, loyalty points and electronic payment services, smartphones can be used to make shopping in bricks and mortar stores as interactive as shopping through web sites and mobile apps.

This executive briefing weighs the pros and cons of the different technologies being used to enable mobile commerce and identifies the likely winners and losers.

A new dawn for digital commerce

This section explains the driving forces behind the mobile commerce land-grab and the associated technology battle.

Digital commerce is evolving fast, moving out of the home and the office and onto the street and into the store. The advent of mass-market smartphones with touchscreens, full Internet browsers and an array of feature-rich apps, is turning out to be a game changer that profoundly impacts the way in which people and businesses buy and sell.  As they move around, many consumers are now using smartphones to access social, local and mobile (SoLoMo) digital services and make smarter purchase decisions. As they shop, they can easily canvas opinion via Facebook, read product reviews on Amazon or compare prices across multiple stores. In developed markets, this phenomenon is now well established. Two thirds of 400 Americans surveyed in November 2013 reported that they used smartphones in stores to compare prices, look for offers or deals, consult friends and search for product reviews.

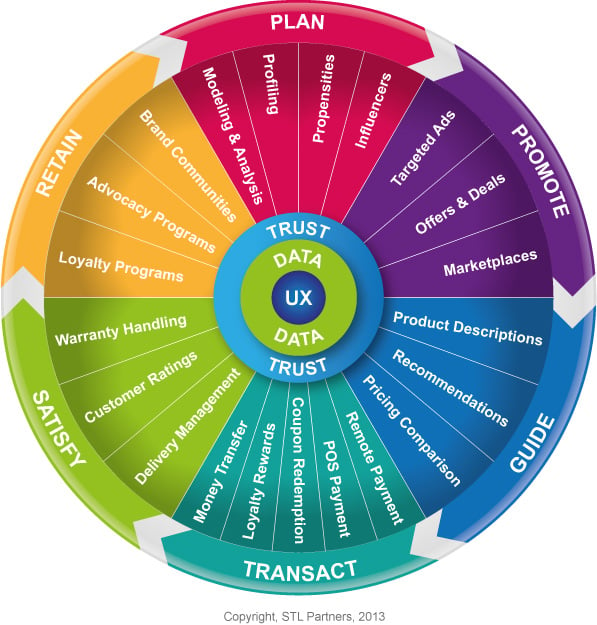
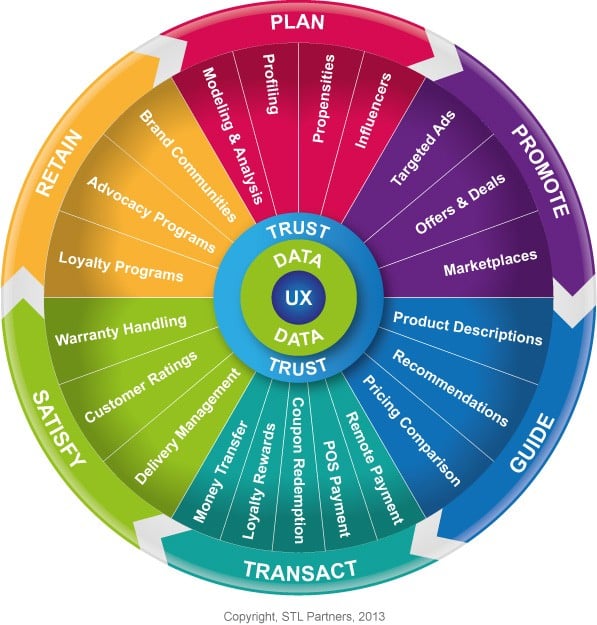
At the same time, the combination of Internet and mobile technologies, embodied in the smartphone, is enabling businesses to adopt new forms of digital marketing, retailing and payments that could dramatically improve their efficiency and effectiveness. The smartphones and the data they generate can be used to optimise and enable every part of the entire ‘wheel of commerce’ (see Figure 4).

Figure 4: The elements that make up the wheel of commerce

The elements that make up the wheel of commerce Feb 2014

Source: STL Partners

The extensive data being generated by smartphones can give companies’ real-time information on where their customers are and what they are doing. That data can be used to improve merchants’ marketing, advertising, stock management, fulfilment and customer care. For example, a smartphone’s sensors can detect how fast the device is moving and in what direction, so a merchant could see if a potential customer is driving or walking past their store.

Marketing that makes use of real-time smartphone data should also be more effective than other forms of digital marketing. In theory, at least, targeting marketing at consumers in the right geography at a specific time should be far more effective than simply displaying adverts to anyone who conducts an Internet search using a specific term.

Similarly, local businesses should find sending targeted vouchers, promotions and information, delivered via smartphones, to be much more effective than junk mail at engaging with customers and potential customers. Instead of paying someone to put paper-based vouchers through the letterbox of every house in the entire neighbourhood, an Indian restaurant could, for example, send digital vouchers to the handsets of anyone who has said they are interested in Indian food as they arrive at the local train station between 7pm and 9pm in the evening. As it can be precisely targeted and timed, mobile marketing should achieve a much higher return on investment (ROI) than a traditional analogue approach.

In our recent Strategy Report, STL Partners argued that the disruption in the digital commerce market has opened up two major opportunities for telcos:

  1. Real-time commerce enablement: The use of mobile technologies and services to optimise all aspects of commerce. For example, mobile networks can deliver precisely targeted and timely marketing and advertising to consumer’s smartphones, tablets, computers and televisions.
  2. Personal cloud: Act as a trusted custodian for individuals’ data and an intermediary between individuals and organisations, providing authentication services, digital lockers and other services that reduce the risk and friction in every day interactions. An early example of this kind of service is financial services web site Mint.com (profiled in the appendix of this report). As personal cloud services provide personalised recommendations based on individuals’ authorised data, they could potentially engage much more deeply with consumers than the generalised decision-support services, such as Google, TripAdvisor, moneysavingexpert.com and comparethemarket.com, in widespread use today.

These two opportunities are inter-related and could be combined in a single platform. In both cases, the telco is acting as a broker – matching buyers and sellers as efficiently as possible, competing with incumbent digital commerce brokers, such as Google, Amazon, eBay and Apple. The Strategy Report explains in detail how telcos could pursue these opportunities and potentially compete with the giant Internet players that dominate digital commerce today.

For most telcos, the best approach is to start with mobile commerce, where they have the strongest strategic position, and then use the resulting data, customer relationships and trusted brand to expand into personal cloud services, which will require high levels of investment. This is essentially NTT DOCOMO’s strategy.

However, in the mobile commerce market, telcos are having to compete with Internet players, banks, payment networks and other companies in land-grab mode – racing to sign up merchants and consumers for platforms that could enable them to secure a pivotal (and potentially lucrative) position in the fast growing mobile commerce market. Amazon, for example, is pursuing this market through its Amazon Local service, which emails offers from local merchants to consumers in specific geographic areas.

Moreover, a bewildering array of technologies are being used to pursue this land-grab, creating confusion for merchants and consumers, while fuelling fragmentation and limiting economies of scale.

In this paper, we weigh the pros and cons of the different technologies being used in each segment of the wheel of commerce, before identifying the most likely winners and losers. Note, the appendix of the Strategy Report profiles many of the key innovators in this space, such as Placecast, Shopkick and Square.

What’s at stake

This section considers the relative importance of the different segments of the wheel of commerce and explains why the key technological battles are taking place in the promote and transact segments.

Carving up the wheel of commerce

STL Partners’ recent Strategy Report models in detail the potential revenues telcos could earn from pursuing the real-time commerce and personal cloud opportunities. That is beyond the scope of this technology-focused paper, but suffice to say that the digital commerce market is large and is growing rapidly: Merchants and brands spend hundreds of billions of dollars across the various elements of the wheel of commerce. In the U.S., the direct marketing market alone is worth about $155 billion per annum, according to the Direct Marketing Association. In 2012, $62 billion of that total was spent on digital marketing, while about $93 billion was spent on traditional direct mail.

In the context of the STL Wheel of Commerce (see Figure 3), the promote segment (ads, direct marketing and coupons) is the most valuable of the six segments. Our analysis of middle-income markets for clients suggests that the promote segment accounts for approximately 40% of the value in the wheel of digital commerce today, while the transact segment (payments) accounts for 20% and planning (market research etc.) 16% (see Figure 5). These estimates draw on data released by WPP and American Express.

Note, that payments itself is a low margin business – American Express estimates that merchants in the U.S. spend four to five times as much on marketing activities, such as loyalty programmes and offers, as they do on payments.

Figure 5: The relative size of the segments of the wheel of commerce

The relative size of the segments of the wheel of commerce Feb 2014

Source: STL Partners


  • Introduction
  • Executive Summary
  • A new dawn for digital commerce
  • What’s at stake
  • Carving up the wheel of commerce
  • The importance of tracking transactions
  • It’s all about data
  • Different industries, different strategies
  • Tough technology choices
  • Planning
  • Promoting
  • Guiding
  • Transacting
  • Satisfying
  • Retaining
  • Conclusions
  • Key considerations
  • Likely winners and losers
  • The commercial implications
  • About STL Partners


  • Figure 1: App notifications are in pole position in the promotion segment
  • Figure 2: There isn’t a perfect point of sale solution
  • Figure 3: Different tech adoption scenarios and their commercial implications
  • Figure 4: The elements that make up the wheel of commerce
  • Figure 5: The relative size of the segments of the wheel of commerce
  • Figure 6: Examples of financial services-led digital wallets
  • Figure 7: Examples of Mobile-centric wallets in the U.S.
  • Figure 8: The mobile commerce strategy of leading Internet players
  • Figure 9: Telcos can combine data from different domains
  • Figure 10: How to reach consumers: The technology options
  • Figure 11: Balancing cost and consumer experience
  • Figure 12: An example of an easy-to-use tool for merchants
  • Figure 13: Drag and drop marketing collateral into Google Wallet
  • Figure 14: Contrasting a secure element with host-based card emulation
  • Figure 15: There isn’t a perfect point of sale solution
  • Figure 16: The proportion of mobile transactions to be enabled by NFC in 2017
  • Figure 17: Integrated platforms and point solutions both come with risks attached
  • Figure 18: Different tech adoption scenarios and their commercial implications

Digital Commerce 2.0: Disrupting the Californian Giants

Introduction

In this briefing, we analyse the Digital Commerce 2.0 strategy and progress of the incumbents – the big five Internet players in this market – Amazon, Apple, eBay/PayPal, Facebook and Google.

STL defines Digital Commerce 2.0 as the use of new digital and mobile technologies to bring buyers and sellers together more efficiently and effectively. Fast growing adoption of mobile, social and local services is opening up opportunities to provide consumers with highly-relevant advertising and marketing services, underpinned by secure and easy-to-use payment services. By giving people easy access to information, vouchers, loyalty points and electronic payment services, smartphones can be used to make shopping in bricks and mortar stores as interactive as shopping through web sites and mobile apps.

This executive briefing considers how the rise of smartphones and the personal data they generate is disrupting digital commerce, and explores the mobile commerce strategies of the big five, their strengths and weaknesses and their areas of vulnerability.

Digital Commerce Disruption

Today, California is undoubtedly the epicentre of digital commerce. Amazon, Google, eBay/PayPal, Facebook and Apple are the leading brokers of digital commerce between businesses and consumers in most of the world’s developed economies. Each one of them has used the Internet to carve out a unique and lucrative role matching online buyers and sellers.

But digital commerce is changing fast, forcing these incumbents to innovate rapidly both to keep pace with each other and fend off a new wave of challengers seeking to take advantage of the disruption resulting from the widespread adoption of smartphones, and the vast quantities of real-time personal data they generate. Smartphones with touchscreens, full Internet browsers and an array of feature-rich apps, are turning out to be a game changer that profoundly impacts the way in which people and businesses buy and sell: Digital commerce is moving out of the home and the office and on to the street and in to the store.

As they move around, many consumers are now using smartphones to access social, local and mobile (SoLoMo) digital services and make smarter purchase decisions. This is not a gradual shift – it is happening extraordinarily quickly. Almost 70% of Americans used their mobile devices to look up information while in retail stores between Thanksgiving and Christmas 2012, according to a survey of 6,200 people by customer experience analytics firm ForeSee.

At the same time, the combination of Internet and mobile technologies, embodied in the smartphone, is enabling bricks and mortar businesses to adopt new forms of digital marketing, retailing and payments that could dramatically improve their efficiency and effectiveness. The smartphones and the data they generate can be used to optimise and enable every part of the entire ‘wheel of commerce’ (see Figure 3).

Figure 3: The elements that make up the wheel of commerce

Digital Commerce 2.0 Wheel of Commerce

Source: STL Partners

The extensive data being generated by smartphones can give companies real-time information on where their customers are and what they are doing. That data can be used to improve merchants’ marketing, advertising, stock management, fulfilment and customer care. For example, a smartphone’s sensors can detect how fast the device is moving and in what direction, so a merchant could see if a potential customer is driving or walking past their store.

Marketing that makes use of real-time smartphone data should also be more effective than other forms of digital marketing. In theory at least, targeting marketing at consumers in the right geography at a specific time should be far more effective than simply displaying adverts to anyone who conducts an Internet search using a specific term.

Similarly, local businesses should find sending targeted vouchers, promotions and information, delivered via smartphones, to be much more effective than junk mail at engaging with customers and potential customers. Instead of paying someone to put paper-based vouchers through the letterbox of every house in the entire neighbourhood, an Indian restaurant could, for example, send digital vouchers to the handsets of anyone who has said they are interested in Indian food as they arrive at the local train station between 7pm and 9pm in the evening. As it can be precisely targeted and timed, mobile marketing should achieve a much higher return on investment (ROI) than a traditional analogue approach.

Although the big five – Amazon, Google, eBay/PayPal, Facebook and Apple – are the leading brokers of “traditional” online commerce, they play a far smaller role in brokering bricks and mortar commerce: Their services are typically used to provide just once element of the wheel of commerce. Consumers shopping in the physical world tend to use a mix of services from the leading Internet players, flitting between the different ecosystems. As they shop, they might use Google Maps to locate a store, Facebook to canvas the opinion of friends and Amazon to read product reviews or compare in-store prices with those online. They might even use Apple’s Passbook to redeem a voucher or PayPal to complete a transaction at point of sale.

Although they are all involved to a greater or lesser extent, none of the big five has yet secured a strong strategic position in this new form of digital commerce. Each of them risks seeing their position in the broader digital commerce market being disrupted by the rise of SoLoMo services that seek to meld merchants online and offline sites into a coherent proposition. As the digital commerce pie grows to encompass more and more bricks and mortar commerce, the big five may see their power and influence wane.

As it becomes clear that smartphones and personal data will transform the consumer experience of bricks and mortar shopping, the leading internet companies are being challenged by telcos, banks, payment networks and other companies racing to sign up merchants and consumers for nascent commerce platforms. In most cases, these new entrants are focusing on digitising traditional commerce, but will inevitably also have to compete with Amazon, Google, eBay/PayPal, Facebook and Apple in the online commerce space – consumers will want to use the same tools and platforms regardless of whether they are in the armchair or walking down a street. Similarly, a merchant will want to use the same platform to support its marketing online and in-store, so their customers can redeem vouchers, for example, digitally or in person.

The internet giants are, of course, expanding their SoLoMo propositions to cover more of the wheel of commerce. Amazon, for example, is pursuing this market through its Amazon Local service, which emails offers from local merchants to consumers in specific geographic areas. Google is combining its Search, Maps, Places, Offers and Wallet services into a local commerce platform for merchants and consumers. But global Internet companies based on economies of scale can find it hard to develop commerce services that take into the account the vagaries of local markets.

There is much at stake: Merchants and brands spend hundreds of billions of dollars across the various elements of the wheel of commerce. In the U.S., the direct marketing market alone is worth US$ 139 billion (more than three times the U.S. online advertising market, according to some estimates (see Figure 4).

Figure 4: A breakdown of the U.S. direct marketing and advertising market

Digital Commerce 2.0 US Direct Marketing and Advertising Market

Source: STL Partners

Another way to view the strategic opportunity is to consider the vast amount of money that is still spent on paper-based marketing in local commerce – householders still receive large numbers of flyers through their door, advertising local businesses. Moreover, many merchants still operate crude loyalty schemes that involve stamping a paper card.

Closing the loop: The importance of payments

One of the most important battlegrounds for the big five is the transact segment of the wheel of commerce. Although this segment is only half the size of the promote segment in terms of revenues, according to STL’s estimates (see Figure 5), it is strategically important. Merchants and brands want to know whether a specific marketing activity actually led to a sale. By bridging the online and offline worlds, mobile technologies can close that loop. If a consumer uses their smartphone to research a product and then pay at point of sale, the retailer can see exactly what kind of marketing results in transactions.

Note that payments itself is a low margin business – American Express estimates that merchants in the U.S. spend four to five times as much on marketing activities, such as loyalty programmes and offers, as they do on payments. But Google and Facebook, as leading marketing and advertising brokers, and some telcos, are moving into the payments space to provide merchants with visibility across the whole wheel of commerce.

In general their approach is to roll out digital wallets that can be used to complete both online transactions and point of sale transactions (either using a contactless technology, such as NFC, or a mobile network-based solution). The term digital wallet or mobile wallet generally refers to an application that can store debit and credit card information, loyalty points, electronic vouchers and value. A digital wallet can reside in the cloud or on a specific device or a combination of the two. The big five each have their own digital wallet.

Although Apple and Facebook have only enabled the use of their wallets within their online walled gardens, they are both gradually extending their transact propositions into bricks and mortar commerce.

Figure 5: The relative size of the segments of the wheel of commerce

Digital Commerce 2.0: Segments and Sizes

Source: STL Partners research drawing on WPP and American Express data

Digital wallets could be the key to unlock a broader and much more lucrative digital commerce proposition. Instead of asking merchants to pay per click, a digital commerce broker could ask them to pay per transaction – a no-risk and, therefore, very attractive proposition for the merchant.

Typically designed to support approximately half of the wheel of commerce (the promote, guide and transact segments), the digital wallet is widely-regarded as an important strategic platform. The theory is that digital wallet suppliers will be well-positioned to interact with consumers while they are shopping, brokering targeted offers and promotions.

Three of the big five – PayPal, Amazon and Apple – have each already signed up tens of millions of users for their online wallets, primarily because they reduce the number of keystrokes and clicks required to complete a transaction online. These Internet players are now weighing up how best to deploy these wallets at point of sale in physical stores. The leading online digital wallet, PayPal, faces increasing competition from leading players in the financial services industry, including Amex and MasterCard (see Figure 6), as well as innovative start-ups, such as Square.

Each of these players is taking a different approach, using different technologies to enabling transactions in store. They are also having to compete with other wallets from companies outside the financial services sector, such as Google, telcos and even retailers.

Figure 6: Examples of financial services-led digital wallets

Digital Commerce 2.0: Financial Services Wallet Examples

Source: STL Partners

In the transact segment, Google, the leading broker of search-related advertising, is scrambling to catch up, rolling out Google Wallet both to compete with PayPal online and enable payments at point of sale using Near Field Communications (NFC) technology. But the software has been through several iterations without gaining significant traction. At the same time, telcos, such as AT&T, Verizon and T-Mobile in the U.S. (the partners in the Isis mobile commerce joint venture), are developing mobile-centric wallets that use NFC to enable payments at point of sale, supported by the SIM card for authentication. Major retailers are also rolling out digital wallets either individually or as part of a consortium. Figure 7 compares three of the mobile-centric wallets available in the U.S. market.

Figure 7: Examples of Mobile-centric wallets in the U.S.

Digital Commerce 2.0: Mobile Centric Wallets

Source: STL Partners

Contents

  • Executive Summary
  • Introduction: Digital commerce disruption
  • Closing the loop: The importance of payments
  • Internet players’ mobile commerce strategies
  • Amazon – impressive interconnected flywheels
  • Apple – slowly assembling the pieces
  • eBay and PayPal – trying to get mobile
  • Facebook – the rising star of mobile commerce
  • Google – try, try and try again in transactions
  • Conclusions
  • Mobile commerce is still up for grabs
  • Competition from telcos and banks
  • Areas of vulnerability


  • Figure 1: The mobile commerce strengths and weaknesses of the Internet players
  • Figure 2: The unfulfilled gap in the digital commerce market
  • Figure 3: The elements that make up the wheel of commerce
  • Figure 4: A breakdown of the U.S. direct marketing and advertising market
  • Figure 5: The relative size of the segments of the wheel of commerce
  • Figure 6: Examples of financial services-led digital wallets
  • Figure 7: Examples of Mobile-centric wallets in the U.S.
  • Figure 8: Google’s big lead in mobile Internet ad spending
  • Figure 9: Google handles one third of all digital advertising
  • Figure 10: The mobile commerce strategy of leading Internet players
  • Figure 11: How the fundamental Amazon flywheel increases working capital
  • Figure 12: How the Amazon Payments flywheel has evolved
  • Figure 13: Deals on display in the Amazon Local app
  • Figure 14: Apple’s Passbook app stores vouchers and loyalty cards
  • Figure 15: Facebook’s daily active users continue to grow
  • Figure 16: Facebook’s mobile daily active users
  • Figure 17: How consumers can redeem a Google Offer
  • Figure 18: Who is best placed to win in facilitating local commerce?
  • Figure 19: Google Wallet no longer needs to work directly with banks
  • Figure 20: The mobile commerce strengths and weaknesses of the Internet players
  • Figure 21: The unfulfilled gap in the digital commerce market
  • Figure 22: Internet giants and start-ups best placed to be infomediaries
  • Figure 23: How Telefónica compares with leading Internet players


Digital Commerce 2.0: New $50bn Disruptive Opportunities for Telcos, Banks and Technology Players

Introduction – Digital Commerce 2.0

Digital commerce is centred on the better use of the vast amounts of data created and captured in the digital world. Businesses want to use this data to make better strategic and operational decisions, and to trade more efficiently and effectively, while consumers want more convenience, better service, greater value and personalised offerings. To address these needs, Internet and technology players, payment networks, banks and telcos are vying to become digital commerce intermediaries and win a share of the tens of billions of dollars that merchants and brands spend finding and serving customers.

Mobile commerce is frequently considered in isolation from other aspects of digital commerce, yet it should be seen as a springboard to a wider digital commerce proposition based on an enduring and trusted relationship with consumers. Moreover, there are major potential benefits to giving individuals direct control over the vast amount of personal data their smartphones are generating.

We have been developing strategies in these fields for a number of years, including our engagement with the World Economic Forum’s (WEF) Rethinking Personal Data project, and ongoing research into user data and privacy, digital money and payments, and digital advertising and marketing.

This report brings all of these themes together and is the first comprehensive strategic playbook on how smartphones and authenticated personal data can be combined to deliver a compelling digital commerce proposition for both merchants and consumers. It will save customers valuable time, effort and money by providing a fast-track to developing and / or benchmarking a leading edge strategy and approach in the fast-evolving new world of digital commerce.

Benefits of the Report to Telcos, Other Players, Investors and Merchants


For telcos, this strategy report:

  • Shows how to evaluate and implement a comprehensive and successful digital commerce strategy worth up to c.$50bn (5% of core revenues in 5 years)
  • Saves time and money by providing a fast-track for decision making and an outline business case
  • Rapidly challenges / validates existing strategy and services against relevant ‘best in class’, including their peers, ‘OTT players’ and other leading edge players.


For other players including Internet companies, technology vendors, banks and payment networks:

  • The report provides independent market insight on how telcos and other players will be seeking to generate $ multi-billion revenues from digital commerce
  • As a potential partner, the report will provide a fast-track to guide product and business development decisions to meet the needs of telcos (and others) that will need to make commensurate investment in technologies and partnerships to achieve their value creation goals
  • As a potential competitor, the report will save time and improve the quality of competitor insight by giving a detailed and independent picture of the rationale and strategic approach you and your competitors will need to take


For merchants building digital commerce strategies, it will:


  • Help to improve revenue outlook, return on investment and shareholder value by improving the quality of insight to strategic decisions, opportunities and threats lying ahead in digital commerce
  • Save vital time and effort by accelerating internal decision making and speed to market


For investors, it will:

  • Improve investment decisions and strategies returning shareholder value by improving the quality of insight on the outlook of telcos and other digital commerce players
  • Save vital time and effort by accelerating decision making and investment decisions
  • Help them better understand and evaluate the needs, goals and key strategies of key telcos and their partners / competitors

Digital Commerce 2.0: Report Content Summary

  • Executive Summary. (9 pages outlining the opportunity and key strategic options)
  • Strategy. The shape and scope of the opportunities, the convergence of personal data, mobile, digital payments and advertising, and personal cloud. The importance of giving consumers control. and the nature of the opportunity, including Amazon and Vodafone case studies.
  • The Marketplace. Cultural, commercial and regulatory factors, and strategies of the market leading players. Further analysis of Google, Facebook, Apple, eBay and PayPal, telco and financial services market plays.
  • The Value Proposition. How to build attractive customer propositions in mobile commerce and personal cloud. Solutions for banked and unbanked markets, including how to address consumers and merchants.
  • The Internal Value Network. The need for change in organisational structure in telcos and banks, including an analysis of Telefonica and Vodafone case studies.
  • The External Value Network. Where to collaborate, partner and compete in the value chain – working with telcos, retailers, banks and payment networks. Building platforms and relationships with Internet players. Case studies include Weve, Isis, and the Merchant Customer Exchange.
  • Technology. Making appropriate use of personal data in different contexts. Tools for merchants and point-of-sale transactions. Building a flexible, user-friendly digital wallet.
  • Finance. Potential revenue streams from mobile commerce, personal cloud, raw big data, professional services, and internal use.
  • Appendix – the cutting edge. An analysis of fourteen best practice and potentially disruptive plays in various areas of the market.


Digital Commerce: Time to redefine the Mobile Wallet

Summary: The ‘Mobile/Digital Wallet’ needs to evolve to support authentication, search and discovery, as well as payments, vouchers, tickets and loyalty programmes. Moreover, consumers will want to be able to tailor the functionality of this “commerce assistant” or “commerce agent” to fit with their own interests and preferences. Key findings and next steps from the Digital Commerce stream of our Silicon Valley 2013 brainstorm. (April 2013, Executive Briefing Service, Dealing with Disruption Stream.)

Who is best placed to win in local commerce April 2013

  Read in Full (Members only)   To Subscribe click here

Below are the high-level analysis and detailed contents from a 35 page Telco 2.0 Briefing Report that can be downloaded in full in PDF format by members of the Telco 2.0 Executive Briefing service and the Dealing with Disruption Stream  here. Digital Commerce strategies and the findings of this report will also be explored in depth at the EMEA Executive Brainstorm in London, 5-6 June, 2013. Non-members can find out more about subscribing here, or to find out more about this and/or the brainstorm by emailing contact@telco2.net or calling +44 (0) 207 247 5003.

To share this article easily, please click:


Introduction

Part of the New Digital Economics Executive Brainstorm 2013 series, the Digital Commerce 2.0 event took place at the InterContinental Hotel, San Francisco on the 20th March and looked at how to get the mobile commerce flywheel moving, how to digitise local commerce, how to improve digital advertising and how to effectively leverage customer data and personal data. The Brainstorm considered how to harness telco assets and capabilities, as well as those of banks and payment networks, to deliver Digital Commerce 2.0.

Analysis: Time to redefine the wallet?

The Executive Brainstorm uncovered widespread confusion and dissatisfaction with the concept of a digital or mobile wallet. Some executives feel that a wallet, with its connotations of a highly personal item that is controlled entirely by the consumer and used primarily for transactions, may be the wrong term. There is a view that the concept of a digital wallet may have to evolve into a more multi-faceted application that supports authentication, search and discovery, as well as payments, vouchers, tickets and loyalty programmes.

Moreover, consumers will likely want to be able to tailor the functionality of this “commerce assistant” or “commerce agent” to fit with their own interests and preferences, rather than having to use an inflexible off-the-shelf application. This gateway application may also act as a personal cloud/locker service, providing access to the individual’s media and content, as well as enabling them to control their privacy settings. In other words, ultimately, consumers may want an assistant or agent that amalgamates the personalised discovery services offered by apps, such as Google Now, online media services, such as iCloud, and the traditional functions of a wallet, such as payments, receipts, coupons and loyalty programmes.

Business model battles

The Brainstorm confirmed that the digital commerce market continues to be held back by the slow and familiar dance between the established interests of banks/payment networks, telcos, and retailers. Designing business models that sufficiently incentivise each partner is tough: big retailers, for example, are likely to resist digital commerce solutions that don’t address their dissatisfaction about transaction fees – there was some excitement about digital commerce solutions that workaround the major payment networks’ interchange systems.

Some of the participants in the Brainstorm held strongly entrenched views about which players can contribute to growth in digital commerce and should therefore benefit most from that growth. The arguments boiled down to:

  • The banking ecosystem believes it is well placed because of the requirement for transactions to be processed by entities with banking licenses and that comply with know your customer (KYC) regulations.
  • Telcos believe that, as digital commerce-related data travels over their networks, they will understand the market better than other players.
  • Retailers believe that they have the customer relationships and that digital commerce offers opportunities to strengthen those relationships and reduce the costs of transactions.

The length and complexity of the digital commerce value chain raises significant questions about whether one entity could and should own the customer relationship and manage customer care across the whole experience. Moreover, there may be a disconnect between elements of the value chain and the overall value proposition. For example, individual retailers may wish to offer fully-customised digital commerce experiences delivered through their own branded apps, but consumers may not want to see the complexity of the existing marketplace, in which they are asked to register and carry multiple loyalty cards, continue in an increasingly digitised world.

While the traditional players jostle for the best positions in the value chain, the door is wide open for market entrants to come with radically disruptive business models. Although telcos have the customer data to be play a pivotal role in digital commerce, other players will work around them unless telcos are prepared to move quickly and partner on equitable terms. In many cases, telcos (and other would-be digital commerce) brokers may have to compromise on margins to seed the market and ultimately gain scale – small merchants (the long tail), which have highly inefficient marketing today, have a greater incentive than large retailers to adopt such solutions. Participants in the Silicon Valley Brainstorm thought that either established Internet players or a start up would ultimately win over the banks and telcos in local commerce.

Who is best placed to win in local commerce April 2013

Consumers are most likely to adopt digital commerce services that offer convenience and breadth. Therefore, such services need to act as open and flexible brokers, which enable a wide range of merchants to use application programming interfaces (APIs) to plug in vouchers and loyalty schemes quickly and easily.

Mobile advertising – still very immature

Immature and messy, the mobile advertising market is still a long way from being as structured as, for instance, television advertising, in terms of standardising metrics for buyers and creating an efficient procurement process. The Brainstorm highlighted the profusion of different technologies and platforms that is making the mobile advertising market highly-fragmented and very resource-intensive for media buyers. In many cases, the advertising industry may be struggling to differentiate between mobile networks, mobile users and mobile devices. For example, a consumer using a tablet on a sofa may be seeing the same adverts as a smartphone user travelling to work on a train.

In essence, the creatives working in advertising agencies are not certain what messages and formats work on a mobile screen, as buyers don’t have reliable ROI data and the advertising networks continue to struggle to deliver precise targeting, stymied by multiple barriers, such as privacy fears, walled gardens and bandwidth constraints. As a result, there is widespread dissatisfaction among both media buyers and consumers with mobile advertising. The mobile advertising market needs robust tools and processes – standardised, proven formats and reliable, trusted metrics – to will enable brands to purchase advertising at scale and with confidence.

Some media buyers are looking for solutions that make the delivery of digital advertising more transparent to consumers, so they have a clearer understanding of why they are seeing a particular advert.

To address these issues, telcos, looking to broker advertising, need to create better platforms that are easy for media buyers to access, offer precise targeting and provide transparent metrics that are straightforward to monitor. Despite the formation of telco marketing and advertising joint ventures in some markets, such as the U.K., some advertising executives believe telcos don’t see a big enough revenue opportunity to build these platforms.

Instead of brand building and customer acquisition, which is the traditional use of mass advertising, it seems likely that the mobile channel will be used primarily for customer loyalty and retention. So-called active advertising (advertising that is designed to enable the individual to complete a specific task) may be well suited to mobile devices, which people typically use to get something done. As attention spans are short and screen space is limited in the mobile medium, the advertising value chain will need to change its mindset to put the needs of the consumer, rather than the brand, front and centre.

Big data – how to monetize?

The Brainstorm reinforced the sense that big data/personal data has the potential to create exceptional insights and disruptive new business models. But most people working in this space only have a high-level, theoretical view of how this might happen, rather than a collection of compelling case studies and use cases. Finding big data projects offering a respectable return on investment is going to be a hit and miss affair, requiring an open mind and the patience to experiment.

Although self-authenticated data could potentially make advertising and marketing more efficient, it may also increase transparency for consumers: The Internet has given consumers more control and is driving deflation in many sectors. The rise of personal data could have negative implications for companies’ profit margins as consumers use vendor relationship management systems to systematically secure the best price.

Many start-ups seem to still be pursuing advertising-funded business models, but big data and personal data business models may depend on a different approach. They should be asking: “How do you fund a search engine that is not ad-funded and can social networks not be ad-funded?” Computational contracts, which machines can execute and people can actually understand, could be part of the answer. Rather than trying to infer interests and movements, a social network might explicitly ask the following question. “If you give me your location and the brands you like, I’ll give you two coupons a day.” This is basically the Placecast model, which seems to be gaining traction in some markets. In any case, telcos and banks could and should use transparent and user-friendly privacy policies as a competitive weapon against Facebook and Google, which currently dominate the online advertising market.

The concept of companies interacting with individuals through the web presence of their objects, such as their car, their bike or their pet, seems sound. Both individuals and companies could benefit from a two-way flow of information around these objects. For example, a consumer with a specific make of printer or camera could benefit from personalised and timely discounts on accessories, such as cartridges and lenses.

Next steps for STL Partners

We will:

  • Continue to research and explore ‘Digital Commerce’ at our Executive Brainstorms, with particular emphasis on practical steps to create the Digital Wallet, enable ‘SoMoLo’, and the key role of personal data and trust frameworks;
  • Look further into the needs and applications of ‘Big Data’ into the field, as well as continuing our involvement in the World Economic Forum’s (WEF) work on Trust Networks for personal data;
  • Publish further research on the business case for personal data, and a full Strategy Report on the Digital Commerce area.


To read the note in full, including the following sections detailing additional analysis…

  • Closing the loop between advertising and payments
  • First stimulus presentation
  • Second stimulus presentation
  • Innovation showcase
  • Brainstorm
  • Key takeaways
  • Advertising & Marketing: Radical Game Change Ahead
  • First and Second stimulus presentations
  • Final stimulus presentation
  • Brainstorm
  • Key takeaways
  • Session 3: Big Data – Exploiting the New Oil for the New Economy
  • Stimulus Speakers and Panellists
  • Stimulus presentations
  • Voting, feedback, discussions
  • Key takeaways

…and the following figures…

  • Figure 1 – Customer Data is at the centre of Digital Commerce
  • Figure 2 – What will North American consumers value most from digital commerce?
  • Figure 3- Leading players’ strengths and weaknesses upstream and downstream
  • Figure 4 – The key elements of the digital commerce flywheel
  • Figure 5 – Vast majority of commerce is still offline
  • Figure 6 – Linking location-based offers to payment cards
  • Figure 7 – Participants’ views on likely winners in ‘local’ digital commerce
  • Figure 8 – Mobile ad spend doesn’t reflect the time people spend in this medium
  • Figure 9 – What does the advertising industry need to do to stay relevant?
  • Figure 10 – Why personal data isn’t like oil
  • Figure 11 – A strawman process for personal data
  • Figure 12 – A decentralised architecture for the Internet of My Things
  • Figure 13 – Kynetx: companies can connect through ‘things’

Members of the Telco 2.0 Executive Briefing Subscription Service and the Dealing with Disruption Stream can download the full 35 page report in PDF format here. Non-Members, please subscribe here. Digital Commerce strategies and the findings of this report will also be explored in depth at the EMEA Executive Brainstorm in London, 5-6 June, 2013. For this or any other enquiries, please email contact@telco2.net / call +44 (0) 207 247 5003.

Background & Further Information

Produced and facilitated by business innovation firm STL Partners, the Silicon Valley 2013 event brought together 150 specially-invited senior executives from across the communications, media, retail, banking and technology sectors, including:

  • Apigee, Arete Research, AT&T,ATG, Bain & Co, Beecham Research, Blend Digital Group, Bloomberg, Blumberg Capital, BMW, Brandforce, Buongiorno, Cablelabs, CenturyLink, Cisco, CITI Group, Concours Ventures, Cordys, Cox Communications, Cox Mobile, CSG International, Cycle Gear, Discovery, DoSomething.Org, Electronic Transactions Association, EMC Corporation, Epic, Ericsson, Experian, Fraun Hofer USA, GE, GI Partners, Group M, GSMA, Hawaiian Telecom, Huge Inc, IBM, ILS Technology, IMI Mobile Europe, Insight Enterprises, Intel, Ketchum Digital, Kore Telematics, Kynetx, MADE Holdings, MAGNA Global, Merchant Advisory Group, Message Systems, Microsoft, Milestone Group, Mimecast, MIT Media Lab, Motorola, MTV, Nagra, Nokia, Oracle, Orange, Panasonic, Placecast, Qualcomm, Rainmaker Capital, ReinCloud, Reputation.com, SalesForce, Samsung, SAP, Sasktel, Searls Group, Sesame Communications, SK Telecom Americas, Sprint, Steadfast Financial, STL Partners/Telco 2.0, SystemicLogic Ltd., Telephone & Data Systems, Telus, The Weather Channel, TheFind Inc, T-Mobile USA, Trujillo Group LLC, UnboundID, University of California Davis, US Cellular Corp, USC Entertainment Technology Center, Verizon, Virtustream, Visa, Vodafone, Wavefront, WindRiver, Xtreme Labs.

Around 40 of these executives participated in the ‘Digital Commerce’ session.

The Brainstorm used STL’s unique ‘Mindshare’ interactive format, including cutting-edge new research, case studies, use cases and a showcase of innovators, structured small group discussion on round-tables, panel debates and instant voting using on-site collaborative technology.

We’d like to thank the sponsors of the Brainstorm:
Silicon Valley 2013 Sponsors

Digital Commerce: Show me the (Mobile) Money

Introduction

STL defines Digital Commerce 2.0 as the use of new digital and mobile technologies to bring buyers and sellers together more efficiently and effectively. Fast growing adoption of mobile, social and local services is opening up opportunities to provide consumers with highly-relevant advertising and marketing services, underpinned by secure and easy-to-use payment services. By giving people easy access to information, vouchers, loyalty points and electronic payment services, smartphones can be used to make shopping in bricks and mortar stores as interactive as shopping through web sites and mobile apps.

To read the note in full, including the following sections detailing additional analysis…

  • Executive Summary
  • Overcoming the Barriers
  • 1. Understand the marketplace you are operating in
  • 2. Develop compelling service offerings
  • 3. The value network
  • 4. Technology
  • 5. Finance – the high-level business model
  • Conclusions and next steps
  • About STL Partners

…and the following figures…

  • Figure 1 – The Cycle and Functions of Digital Commerce
  • Figure 2 – Mobile wallets will take time to gain traction
  • Figure 3 – The mobile commerce flywheel
  • Figure 4 – The STL Partners Business Model Framework
  • Figure 5 – For banked consumers, digital wallets mainly offer convenience
  • Figure 6 – For the unbanked, digital wallets offer convenience and some savings
  • Figure 7 – For merchants, digital wallets help build deeper customer relationships
  • Figure 8 – Telcos’ potential revenue streams from a digital commerce service
  • Figure 9 – Telcos’ potential major costs in launching a digital commerce service
  • Figure 10 – Telcos’ mobile commerce revenues are likely to be modest
  • Figure 11 – Telcos have regular customer contact and real-time data
  • Figure 12 – Potential strategic actions for telcos
  • Figure 13 – Leading Internet companies have global reach and scale
  • Figure 14 – Potential strategic actions for Internet players
  • Figure 15 – Banks have local knowledge, payment networks trusted brands
  • Figure 16 – Potential strategic actions for banks and payment networks

The Great Compression: surviving the ‘Digital Hunger Gap’

Introduction

The Silicon Valley Brainstorm took place on 19-20 March 2013, at the Intercontinental Hotel, San Francisco.

Part of the New Digital Economics Executive Brainstorm & Innovation Series, it built on output from previous events in Singapore, Dubai, London and New York, and new market research and analysis, and focused on new business models and growth opportunities in digital commerce, content and the Internet of Things.

Summary Analysis: ‘The Great Compression’

In the next 10 years, many industries face the ‘Great Compression’ in which, in addition to the pressures of ongoing global economic uncertainty, there is also a major digital transformation that is destroying traditional value and moving it ‘disruptively’ to new areas and geographies, albeit at diminished levels.

In previous analyses (e.g. Dealing with the ‘Disruptors’: Google, Apple, Facebook, Microsoft/Skype and Amazon) we have shown how key technology players in particular compete with different objectives in different parts of the digital value chain. Figure 1 below shows via crossed dollar signs (‘New Non-Profit’) the areas in which companies are competing without the primary intention of driving profits, which means that traditional competitors in those areas can expect ‘disruptive’ competition from new business models.

Figure 1 – Digital disruption
Digital disruption occurring in many industries Mar 2013

Source: STL Partners ‘Dealing with the ‘Disruptors’: Google, Apple, Facebook, Microsoft/Skype and Amazon’


The Digital Hunger Gap

For the incumbent industry players we call the near-term results of this disruption ‘The Digital Hunger Gap’ – the widening deficit between past and projected revenues. Chris Barraclough, Chief Strategist STL Partners presented the classic Music Industry case study of the ‘Hunger Gap’ effects of digital disruption.

Figure 2 – The Music Industry’s ‘Hunger Gap’
The Music Industry's ‘Hunger Gap’ Mar 2013

Source: STL Partners


In a vote, 95% of participants agreed that something similar would happen in other industries.

Chris then presented our initial analysis of the ‘Hunger Gap’ for telcos (to be published in full shortly), and asked the participants where they thought the telco industry would be relative to its 2012 position in 2020.

Figure 3 – Participants’ views on forecasts for the telecoms industry
Participants' views on forecasts for the telecoms industry Mar 2013

Source: Silicon Valley 2013 Participants / STL Partners


As can be seen, participants’ views were widely spread, with a slight bias towards a more pessimistic outlook than that presented of a recovery to 2012 levels.

Chris argued that as the ‘hunger gap’ widens, and before new revenues are developed, there will be massive consolidation and cost-reduction among incumbent players, and opportunities for innovation in services, but the chances of success in the latter are very low and require a portfolio approach and either deep pockets, exceptional insight, or considerable good fortune.

Richard Kramer, Managing Partner of Arete Research, also presented a deflationary outlook for all but the leading consumer technology players in the handset and tablet arena.

Participants then voted on which areas needed the most significant changes in their business – and existing managements’ ‘mindset’ was voted as the top priority.

Figure 4 – ‘Mindset’ is the biggest barrier to transformation
'Mindset' is the biggest barrier to transformation Mar 2013

Source: Silicon Valley 2013 Participants / STL Partners


It is also notable that all categories averaged 3.0 or over – or needing ‘Significant Change’. This points to a significant transformation across all industries.

Content:

  • Opportunities
  • Telco 2.0 Strategies
  • Big Data and Personal Data
  • Digital Commerce
  • Digital Entertainment
  • Mobile Advertising & Marketing
  • The Internet of Things
  • Outlook by Industry
  • Next Steps


  • Figure 1 – Digital disruption
  • Figure 2 – The Music Industry’s ‘Hunger Gap’
  • Figure 3 – Participants’ views on forecasts for the telecoms industry
  • Figure 4 – ‘Mindset’ is the biggest barrier to transformation
  • Figure 5 – The ‘Telco 2.0’ opportunities for CSPs
  • Figure 6 – The impact of ‘Software Defined Networks’ (SDN)
  • Figure 7 – Will ‘Personal Data’ be more useful than ‘Big Data’?
  • Figure 8 – STL Partners’ ‘Wheel of Digital Commerce’
  • Figure 9 – Who will in ‘SoMoLo’?
  • Figure 10 – Significant changes in viewing habits
  • Figure 11 – Transformation needed in the advertising industry
  • Figure 12 – Growth projections for M2M ‘mobile’ (e.g. 3G/4G) connected devices

Mobile Advertising and Marketing: Operator and Market Growth Strategies 2010

Summary: The potential of mobile marketing has long been understood and yet unfulfilled. This new report gives our forecasts, plus how Telcos can make the most of the powerful assets available to them to take a valuable role in this market before it is too late. Report extract included.

Context: Mobile Advertising is Hot – Again

With Google’s planned acquisition of AdMob and the launch of Apple’s iAd advertising platform, mobile is back in fashion. But where is the real value in this market and what’s the best role for telcos?

A new Telco 2.0 Executive Briefing report, of which there is an introductory extract below, summarises the current status of Telco-enabled marketing channels, and Operators’ opportunities to grow the market. It was produced, in part, as context for the Telco 2.0 Use Case analysis for the Use Cases Report and the standalone Executive Briefing Mobile Advertising and Marketing: Text-based Local Search Use Case. Our original analysis on this topic is the 100+ Page Telco 2.0 Strategy Report – How to make the Telecoms Advertising Channel work a systematic approach to making it work for brands and profitable for telcos.

The report provides our forecast of the development of the market, and in particular on the near term opportunities for messaging based formats. [NB There will be more on both telco-enabled marketing and consumer data at the 9th Telco 2.0 Brainsrorm in London, April 28-29, 2010.]

Key Advertising Strategy Questions

Mobile advertising has long been touted as a major new revenue stream for the telecommunications industry. The role of fixed operators in online advertising has, so far at least, proved to be limited. Because the mobile device can be traced to an individual, however, mobile operators have substantial information about customers that is of potential value to marketers and advertisers.

So far, however, material mobile advertising revenue has proved to be elusive for operators because they have focused on a vertically integrated strategy that involves making money from advertising inventory that they own and control such as on-portal banner advertising. The problem with this is that the portion of inventory that they control is a small and diminishing portion of the total mobile advertising opportunity. We outline this issue in the chart below as well as the key questions facing operators in terms of increasing their addressable market in mobile advertising.

Can the Telco industry extract value from mobile advertising?

mob%20ad%20opp%20chart%20april%202010.png

The report described here analyses the current strengths and weaknesses and near-term opportunities of mobile advertising. In addition, some customers may also wish to consider participation in our Syndicated Research project, in which we will:

  • further explore differences between the major advertising formats: messaging, banner, video/TV, search, games and widgets
  • produce three different business models for the future mobile advertising and marketing ecosystem
  • map different advertising formats effectiveness in each business model
  • analyse how value would flow through each system as well as forecast potential transaction volumes and prices
  • explore how these different models will be deployed in different geographies within Europe and the US and the factors which will drive their uptake

For more information please see Defining the Telco 2.0 Ecosystems or email Chris Barraclough at contact@telco2.net.

Mobile Advertising Report Extract – Introduction

We’ve been here before: Lots of media attention

The mobile advertising and marketing hype appears to be starting up once again.  A few headlines illustrate the point:

  • ‘Like It Or Not, Mobile Advertising Is Coming’[1]
  • ‘Mobile phones a bright spot for Advertising’[2]
  • ‘Mobile Advertising – The Next Big Thing in Travel Marketing’[3]
  • ‘Mobile web adspend expected to reach $2B a year by 2014’[4]
  • ‘Mobile marketing has potential to grow in Asia Pacific, says MMA’[5]

Things have been quiet for a while after the great promises made for mobile advertising in 2006 but media interest is clearly picking up. 

The economic crisis and greater mobile marketing maturity

Mobile marketing is back in the spotlight for a couple of reasons:

1.     The global recession has focused marketers on media campaigns that have a demonstrable return on investment.  As it has become harder to generate sales, so marketing budgets have moved towards activities that can be shown to directly influence the customer’s purchase decision.  For example, in the UK online search advertising grew three times as fast as display advertising between 2007 and 2008 despite already being three times the size.

Figure 1: Internet search and display advertising sectors in the UK


Size, £ Millions
Growth
Format

2007
2008
£ Millions
%
Search

1,619
1,987
368
23
Display

592
637
45
8
Source: Internet Advertising Bureau

SMS advertising (including coupons and vouchers) is the biggest mobile segment and has similar characteristics to online search and traditional ‘direct response’ marketing in that an immediate customer action is sought and measured.  Display can, theoretically, do this too (by measuring clicks) but has tended to be used for raising awareness about a brand or product. 

Many companies have, therefore, turned to mobile to maximise sales during these tough times. High profile campaigns of this sort include Coca Cola, who ran a campaign in the UK in May and June 2009 with digital vouchers for free bottles of Fanta, Sprite and Dr. Pepper being sent to the mobile phones of around 100,000 targets. Recipients of the voucher simply had to text ‘YES’ and their date of birth to a specific number and would instantly receive a text with a code enabling them to redeem the voucher. Participating retailers would key the code into their Paypoint terminal (used for paying utility bills and toping up prepay mobile accounts) which would register the redemption. The use of Paypoint enabled Coca Cola to both monitor redemption rates real-time (87% over the course of the campaign) and pay the retailer within seven days.

Figure 2: Coca Cola’s SMS campaign for 10,000 stores and 100,000 consumers

Fig%202%20Coca%20cola%20SMS%20campaign%20Apr%202010.png

Source: www.presscentre.coca-cola.co.uk

2.     The mobile marketing and advertising market is maturing:

a.     There is greater demand from end users for mobile media:

  i.          The rise in flat rate data plans has increased the volume of media consumed on devices and removed the issue of subscribers potentially being charged to receive marketing and advertising;

   ii.          Mobile devices continue to become more sophisticated – more and more phones now have browsers.  This is important:  the volume of  smartphones in the market is directly correlated to web browsing adoption and usage and to data plan take-up;

   iii.          The combination of i. and ii. above has resulted in a substantial increase in mobile browsing in key markets.  Such browsing increased by 52% in the US from November 2007 to November 2008 and by 42% in the largest European markets (UK, France, Spain, Germany and Italy) according to comScore;

   iv.          SMS marketing has reached critical mass in the last eighteen months.  For example, in the US SMS marketing accounted for 60% ($192 million) of the $320 million spent on mobile advertising in 2008 (according to emarketer.com). Similarly, a survey in the US by the Direct Marketing Association in July 2008 found that 70% of consumers had responded to a text ad over a two month period:

Figure 3: Percentage of responders to a mobile offer

Fig%203%20Ad%20report%20percentage%20bar%20chart%20Apr%202010.png

Source: Direct Marketing Association

b.    There has been more industry-wide activity from the operator and advertising communities:

  i.          The Mobile Marketing Association has developed a mobile advertising code of conduct and guidelines and the Direct Marketing Association has also developed guidelines and ‘help notes’ to standardise mobile approaches for marketers;

  ii.          At the time of publication, the GSMA mobile metrics programme is on the cusp of delivering a complete and standardised picture of mobile internet usage in the UK (and later Germany) so that marketers have a 360º view of audience behaviour across mobile and can plan and buy campaigns accordingly;

c.     There has been more effort and activity (including acquisitions) from individual operators seeking to capitalise on this new revenue source, including:

  i.           In late 2007, Telefonica and Vodafone took minority stakes in Amobee a provider of solutions for operators to deliver ad-funded content and services;

  ii.          Vodafone Egypt bought the digital media agency Sarmardy Communication (Sarcom) in August 2008;

  iii.          In August 2009, Orange bought Unanimis, the digital media aggregator to extend its advertising reach;

  iv.          In May 2009, Vodafone announced that it had successfully rolled out mobile advertising to 18 markets in 18 months.  Services include incoming voice/text alerts, branded applications and location-based advertising.;

  v.          Microsoft paid Verizon Wireless around $600m in early 2009 for the right to supply local internet search and mobile advertising services to Verizon’s customers.

This increased activity, of course, leads observers to beg the question ‘why is mobile deemed to be so valuable and where does it fit into the wider marketing mix’?

Mobile as a part of the Marketing Mix

A framework for customer marketing

Traditionally the ‘marketing mix’ has been described in terms of the four levers that marketers can change to drive the success of their product or service: Product, Place, Price and Promotion (the ‘4 P’s).  More recently, advertising agency Ogilvy has suggested that these should be revised to the ‘4 E’s’ to reflect the impact of digitalisation: Experience (instead of Product), Everyplace (Place), Exchange (Price) and Evangelism (Promotion).

However, to understand the role that mobile can play for marketers it is perhaps more helpful to focus on the customer adoption process for a product or service and explore how mobile can enhance the interventions made by marketing during this process.  Again, there are several models exploring how customers first become aware of a product through to the time they are loyal customers.  We have amalgamated several approaches into 6 A’s: Awareness (& Interest), Assessment, Attempt, Adoption, Advocacy and Abandonment (outlined below).

Figure 4: The 6 A’s of a Customer Lifecycle

Stage

Description

Typical customer engagement

Awareness (& Interest)

Making the customer aware of (and interested in) a brand or product or service.

TV, Radio, Billboards, Internet banners

Assessment

Customer evaluates product or service against substitutes.

In-store, comparison websites, peer reviews

Attempt

Customer trials product or service.

In-store promotion, Direct mail, Internet search

Adoption

Customer regularly uses product or signs up for service.

Store, Direct mail, Telesales, Website

Advocacy

Customer is loyal and promotes product or service.

Refer-a-friend, social media viral growth

Abandonment

Customer stops buying product or does not renew service.

Telemarketing, Direct mail

Source: STL Partners/Telco 2.0

Mobile is a particularly interesting medium for marketers because it is ubiquitous and delivers a message to an individual that virtually guarantees their attention.  If marketers can deliver a relevant message or offer to the individual according to their 6 A’s stage via mobile, then they have a good chance of inducing a positive response.  And mobile can also provide a response channel for the individual enabling them to transact directly using the handset.  Of course, the quid pro quo of using a personal medium like mobile for marketing is that there is a real risk of upsetting customers who feel intruded upon or, worse, spammed.  We discuss this in more detail in the sections below on customer data and customer privacy.

Mobile advertising and marketing formats

The range of formats available on mobile also means that marketers can engage with customers in different ways through the lifecycle.  Other media have relatively few formats.  TV, for example, has traditionally been dominated by the commercial break although, more recently, direct TV sales channels and product placement within programmes have increased from a low base.  Mobile, by contrast, has a wide range of formats.

The key formats outlined in the body of the report are: SMS, MMS, Mobile Internet Banners,Apps & Widgets,QR Codes, Mobile TV & Video, Ad-Funded Content, Mobile Search.

The Relative Strengths of Telco-Enabled Marketing Media are Analysed in the Report

Picture1.jpg

Source: Telco 2.0 Mobile Advertising Growth Strategies Report

To read the rest of the report, covering…

  • The strengths and weaknesses of the various forms of mobile media
  • Applicability: How mobile supports customer engagement
  • Media Richness is inversely proportional to Reach
  • Mobile marketing forecasts by advertising format
  • Operator-centric vs ‘OTT’ approaches
  • Customer data and metadata
  • Customer Privacy: issues and approaches
  • The Operator as service provider or service enabler

…and including…

Figure 1: Internet search and display advertising sectors in the UK

Figure 2: Coca Cola’s SMS campaign for 10,000 stores and 100,000 consumers

Figure 3: Percentage of responders to a mobile offer (March & April 2008)

Figure 4: The 6 A’s of a Customer Lifecycle

Figure 5: Important mobile advertising and marketing formats

Figure 6: Blyk Connexions case study example

Figure 7: Arsenal Mobile: for fans of the mighty Gunners

Figure 8: Mobile marketing and advertising applicability: summary

Figure 9: SMS/MMS marketing: currently the most important format

Figure 10: US Mobile Advertising Market, $ Millions

Figure 11: Lots of data but not necessarily complete, accessible, shareable

Figure 12: Sense Networks’ clustering of users based on their location patterns

Figure 13: Customer data approaches for five example services

Figure 14: Technical approaches to addressing privacy

Figure 15: The two-sided Telecoms business model opportunity

Figure 16: Core Telco 2.0 principles followed in this use case

Figure 17: Telco 2.0 ‘Use Case’ Methodology

…Members of the Telco 2.0TM Executive Briefing Subscription Service and the Dealing with Disruption Stream can download the full 33 page report in PDF format here. Non-Members, please see here for how to subscribe, here to buy a single user license for for £995, and here to buy a license for up to 5 people for £1,450. Corporate-wide licenses are also available – please email contact@telco2.net or call +44 (0) 207 247 5003.

Special Offer

We reommend that non-member readers looking for a comprehensive overview of new Telco Business Models enabling advertising and marketing also consider the Telco 2.0 Briefing report Mobile Advertising and Marketing: Text-based Local Search Use Case and the special report Can Telcos Unlock the Value of their Consumer Data? Each report is available individually for single, group and corporate users, and a also in a package of all three reports at a 33% discount – £1,900 for a single user and £2,900 for all three reports for 5 users. Please email contact@telco2.net or call +44 (0) 207 247 5003 for more on these packages and interest in corporate-wide licenses.

Footnotes:


[1] www.informationweek.com

[2] www.inquirer.net

[3] www.travelmole.com/stories/1138044.php

[4]www.fiercemobilecontent.com/story/mobile-web-adspend-expected-reach-2b-year-2014/2009-08-25

[5] www.velti.com/index.cfm?page=1411&articleID=19334292

Full Article: Triple play, go away

We were running through four case studies from our new Broadband Business Models 2.0 Report looking at how the content aggregation and distribution businesses interact with one another. The four products we picked on are Joost, Iliad’s Free service, Sky Anytime and BT Vision, but of course we’ve been following many others. We’re seeing some common themes, plus some ideas of our own, that we thought we’d share with you:

  • You have to match the right content to the right distribution system. Get it wrong, for example by picking mass market content when you should be deep in the long tail, and you’ll fail. Get it right, for example by giving user generated content equal footing in the distribution system, and you’ll be rewarded.
  • Two-sided business models (with payment from users as well as merchants) generally beat one-sided models.
  • Scale matters in both content aggregation and distribution. Sponsors and advertisers demand it, and distribution efficiency needs it. Few businesses have both. Telcos trying to build both capabiliies as a “triple play? will mostly fail.
  • Indeed, always carry a wet fish with you. Whenever you hear someone say “triple play? (or “Quad? or “Quin? Play), slap them across the face with it until they wake up. It’s nonsense. A dream. If anything it’s “multiplex play? — how do I use my customer relationship and distribution assets to market and deliver content from relevant aggregators to targeted users? For example, how does an ISP serving the small business market offer multicast video from a business newscast partner?
  • The triple play is a vestige of what Umair Haque calls the “massconomy? — mass production of a standardised product, versus the “edgeconomy? where everything is personalised and also understands the user is a critical producer as well as consumer of value. Iliad’s TV Perso is a classic example here of going beyond bundling, by allowing users to create their own TV channels, including their own content.
  • Telcos have a cultural handicap: they’re obsessed with billable events. Consumers want bundles. The marketing skill is how to build and break bundles.
  • Speaking of bundling, consumers want to buy product and delivery together as a package (“FREE delivery!?). They also dislike endless small charges for calls and content — there’s a large “certainty premium? that they pay for bundles. However, the classical consumer surplus analysis of bundling only applies when you group dissimilar but complementary goods (e.g. TV and phone service). And it only works to reclaim some market power for yourself. If your basic product isn’t very good, because you’re stuck in a “massconomy? mindset, it doesn’t help.
  • That means operators need to open up their assets (network, logistics, customer data) to upstream partners to help them bundle the retail proposition.
  • Most vendors have nothing like the offering that the operators need. Nowhere near. Sorry.
  • Content still isn’t king. If you really want to make money, go re-invent the freephone number business.