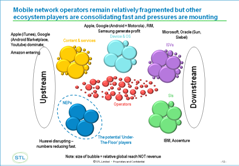
Connected car: From mobile broadband to genuine V2X

Connected cars are moving fast

Over the past two decades, vehicles have been making increasing use of cellular connectivity for a variety of purposes from pay-as-you-drive insurance and rentals to remote (un)locking and automated emergency calls. Now automobiles are beginning to harness C-V2X – versions of LTE and 5G specifically designed to meet the needs of connected cars.

This report outlines the growing momentum behind V2X connectivity, the various connectivity options and the strategies of leading connected car makers, before providing some forecasts for the growth in connected vehicles between now and 2028. It then considers many of the key use cases, categorising them according to how frequently the vehicle needs to obtain new data from external sources. Finally, the report profiles the efforts of several telcos that have achieved scale in this market, before drawing some conclusions.

Enter your details below to download an extract of the report

Who is driving the connected car market?

C-V2X connectivity is now being built into vehicles by various Chinese automakers, as well as GM, Ford and Audi, according to the 5G Automotive Association (5GAA), which is a global, cross-industry organisation representing companies from the automotive, technology, and telecommunications sectors.

The 5GAA has described 2023 as “a pivotal year for V2X deployment”, partly because the technology is increasingly being standardised and partly because of the regulatory drivers discussed later in this section.

While cellular connectivity is already used by tens of millions of vehicles worldwide, the deployment of C-V2X is still very nascent.

Direct mode C-V2X clearly depends on the deployment of 5.9GHz modems inside vehicles and in roadside units and other public infrastructure. The latter will need to be densely deployed, as the range of each unit could drop to around 100 metres when buildings are in the way. These roadside units typically employ either an Ethernet cable or a wireless link for backhaul.

As the business case rests primarily on a reduction in congestion and accidents, the rollout of this infrastructure is likely to be funded primarily by general taxation and/or road tolls. Therefore, much of the direct mode infrastructure will probably be deployed and controlled by municipalities and road operators, but this responsibility could be outsourced to telcos. In China, where the government retains close control over both the telecoms and transport sectors, this infrastructure is already widely deployed in some cities.

Increasingly sophisticated roadside units are also becoming available in the rest of the world from specialist companies, such as Applied Information, Askey, Commsignia, Harman Automotive (part of Samsung) and Yunex Traffic. Other vendors supplying road-side unit (RSU) hardware – or software for inclusion on third-party hardware – include Cohda Wireless, Capgemini, Kapsch TrafficCom, Grand-Tek and others. Chinese telecoms equipment suppliers Huawei and ZTE had solutions listed by 5GAA in a 2021 list of RSU suppliers, but Ericsson and Nokia did not, and they may choose to license products from other vendors.

In May 2022, Yunex Traffic, for example, launched the RSU2X, which can use DSRC or C-V2X signals to transmit speed limits, red light notices and wrong-way warnings to the onboard units in automakers’ 2023 model vehicles. The RSU2X can also capture the car’s speed, direction, and location for use by connected safety systems. Yunex says the unit is capable of handling 4,000 message verifications and 130 message signature operations per second. The RSU2X has four times the computing power of Yunex’s previous model.

Yunex Traffic claims its new RSU2X can handle 4,000 messages per second

Source: Yunex Traffic

Some of the latest roadside units, such as Harman Automotive’s Savari StreetWAVE, include support for 5G, as well as C-V2X and DSRC (5.855 to 5.925GHz), Wi-Fi and LoRaWAN.

C-V2X is also being integrated into new vehicles. For example, in September 2022, Autotalks, a fabless semiconductor company based in Israel, said two Chinese automakers had ordered its V2X communication solutions. In the press release, Autotalks said the first V2X-enabled car brand will be launched in China in the second half of 2023, while the other automaker will roll out the V2X-enabled car in both China and Europe starting in early 2024.

“China’s V2X market continues gearing up towards implementation of the government’s ambitious intelligent transportation strategy,” Autotalks said at the time. “All leading automakers, local and global, are expected to start massive deployment of V2X technology in China in the coming years. The market is moving towards massive adoption of V2X as most OEMs are preparing to launch V2X-powered vehicles by 2025.”

Table of contents

  • Executive Summary
  • The road to automated driving
  • Introduction: V2X market momentum
    • Who is driving the market?
    • Regulatory moves on both sides of the Atlantic
  • V2X connectivity options
    • History and background to automotive connectivity
    • Dedicated and localised V2X networks
    • National and wide-area V2X
    • How much data traffic can be expected?
    • The role of private/non-public mobile networks
    • Spectrum considerations
    • Summary of the connectivity options
  • Automakers’ adoption of connectivity
    • Ford aims to monetise connectivity
    • BMW continues to champion connectivity
    • Audi looks to harness 5G
    • Baidu explores V2X for self-driving
    • How many connected vehicles are there?
    • SK Telecom looks skyward
  • Connected vehicle use cases
    • Batch-based use cases
    • Pulse use cases
    • High-frequency use cases
    • Real-time applications
    • Reducing the need for onboard compute
    • Avoiding collisions
  • Telcos connecting vehicles at scale
    • Vodafone Automotive: 5,000 alerts a day
    • AT&T: Serving more than 60 million vehicles
    • Mobile: Delivering the internet of vehicles
  • Conclusions
  • Index

Related research

Enter your details below to download an extract of the report

Telco Cloud Deployment Tracker: 5G core deep dive

Deep dive: 5G core deployments 

In this July 2022 update to STL Partners’ Telco Cloud Deployment Tracker, we present granular information on 5G core launches. They fall into three categories:

  • 5G Non-standalone core (5G NSA core) deployments: The 5G NSA core (agreed as part of 3GPP Release in December 2017), involves using a virtualised and upgraded version of the existing 4G core (or EPC) to support 5G New Radio (NR) wireless transmission in tandem with existing LTE services. This was the first form of 5G to be launched and still accounts for 75% of all 5G core network deployments in our Tracker.
  • 5G Standalone core (5G SA core) deployments: The SA core is a completely new and 5G-only core. It has a simplified, cloud-native and distributed architecture, and is designed to support services and functions such as network slicing, Ultra-Reliable Low-Latency Communications (URLLC) and enhanced Machine-Type Communications (eMTC, i.e. massive IoT). Our Tracker indicates that the upcoming wave of 5G core deployments in 2022 and 2023 will be mostly 5G SA core.
  • Converged 5G NSA/SA core deployments: this is when a dual-mode NSA and SA platform is deployed; in most cases, the NSA core results from the upgrade of an existing LTE core (EPC) to support 5G signalling and radio. The principle behind a converged NSA/SA core is the ability to orchestrate different combinations of containerised network functions, and automatically and dynamically flip over from an NSA to an SA configuration, in tandem – for example – with other features and services such as Dynamic Spectrum Sharing and the needs of different network slices. For this reason, launching a converged NSA/SA platform is a marker of a more cloud-native approach in comparison with a simple 5G NSA launch. Ericsson is the most commonly found vendor for this type of platform with a handful coming from Huawei, Samsung and WorkingGroupTwo. Albeit interesting, converged 5G NSA/SA core deployments remain a minority (7% of all 5G core deployments over the 2018-2023 period) and most of our commentary will therefore focus on 5G NSA and 5G SA core launches.

Enter your details below to request an extract of the report

75% of 5G cores are still Non-standalone (NSA)

Global 5G core deployments by type, 2018–23

  • There is renewed activity this year in 5G core launches since the total number of 5G core deployments so far in 2022 (effective and in progress) stands at 49, above the 47 logged in the whole of 2021. At the very least, total 5G deployments in 2022 will settle between the level of 2021 and the peak of 2020 (97).
  • 5G in whichever form now exists in most places where it was both in demand and affordable; but there remain large economies where it is yet to be launched: Turkey, Russia and most notably India. It also remains to be launched in most of Africa.
  • In countries with 5G, the next phase of launches, which will see the migration of NSA to SA cores, has yet to take place on a significant scale.
  • To date, 75% of all 5G cores are NSA. However, 5G SA will outstrip NSA in terms of deployments in 2022 and represent 24 of the 49 launches this year, or 34 if one includes converged NSA/SA cores as part of the total.
  • All but one of the 5G launches announced for 2023 are standalone; they all involve Tier-1 MNOs including Orange (in its European footprint involving Ericsson and Nokia), NTT Docomo in Japan and Verizon in the US.

The upcoming wave of SA core (and open / vRAN) represents an evolution towards cloud-native

  • Cloud-native functions or CNFs are software designed from the ground up for deployment and operation in the cloud with:​
  • Portability across any hardware infrastructure or virtualisation platform​
  • Modularity and openness, with components from multiple vendors able to be flexibly swapped in and out based on a shared set of compute and OS resources, and open APIs (in particular, via software ‘containers’)​
  • Automated orchestration and lifecycle management, with individual micro-services (software sub-components) able to be independently modified / upgraded, and automatically re-orchestrated and service-chained based on a persistent, API-based, ‘declarative’ framework (one which states the desired outcome, with the service chain organising itself to deliver the outcome in the most efficient way)​
  • Compute, resource, and software efficiency: as a concomitant of the automated, lean and logically optimal characteristics described above, CNFs are more efficient (both functionally and in terms of operating costs) and consume fewer compute and energy resources.​
  • Scalability and flexibility, as individual functions (for example, distributed user plane functions in 5G networks) can be scaled up or down instantly and dynamically in response to overall traffic flows or the needs of individual services​
  • Programmability, as network functions are now entirely based on software components that can be programmed and combined in a highly flexible manner in accordance with the needs of individual services and use contexts, via open APIs.​

Previous telco cloud tracker releases and related research

Each new release of the tracker is global, but is accompanied by an analytical report which focusses on trends in given regions from time to time:

Enter your details below to request an extract of the report

Private networks: Lessons so far and what next

The private networks market is rapidly developing

Businesses across a range of sectors are exploring the benefits of private networks in supporting their connected operations. However, there are considerable variations between national markets, reflecting spectrum and other regulatory actions, as well as industrial structure and other local factors. US, Germany, UK, Japan and the Nordics are among the leading markets.

Enterprises’ adoption of digitalisation and automation programmes is growing across various industries. The demand from enterprises stems from their need for customised networks to meet their vertical-specific connectivity requirements – as well as more basic considerations of coverage and cost of public networks, or alternative wireless technologies.

On the supply side, the development in cellular standards, including the virtualisation of the RAN and core elements, the availability of edge computing, and cloud management solutions, as well as the changing spectrum regulations are making private networks more accessible for enterprises. That said, many recently deployed private cellular networks still use “traditional” integrated small cells, or major vendors’ bundled solutions – especially in conservative sectors such as utilities and public safety.

Many new players are entering the market through different vertical and horizontal approaches and either competing or collaborating with traditional telcos. Traditional telcos, new telcos (mainly building private networks or offering network services), and other stakeholders are all exploring strategies to engage with the market and assessing the opportunities across the value chain as private network adoption increases.

Following up on our 2019 report Private and vertical cellular networks: Threats and opportunities, we explore the recent developments in the private network market, regulatory activities and policy around local and shared spectrum, and the different deployment approaches and business cases. In this report we address several interdependent elements of the private networks landscape

Enter your details below to request an extract of the report

What is a private network?

A private network leverages dedicated resources such as infrastructure and spectrum to provide precise coverage and capacity to specific devices and user groups. The network can be as small as a single radio cell covering a single campus or a location such as a manufacturing site (or even a single airplane), or it can span across a wider geographical area such as a nationwide railway network or regional utility grids.

Private networks is an umbrella term that can includes different LAN (or WAN) connectivity options such as Wi-Fi and LPWAN. However, more commonly, the term is being associated with private cellular networks based on 3GPP mobile technologies, i.e. LTE or 5G New Radio (NR).

Private networks are also different from in-building densification solutions like small cells and DAS which extend the coverage of public network or strengthen its capacity indoors or in highly dense locations. These solutions are still part of the public network and do not support customised control over the local network access or other characteristics. In future, some may support local private networks as well as public MNOs’ services.

Besides dedicated coverage and capacity, private networks can be customised in other aspects such as security, latency and integration with the enterprise internal systems to meet business specific requirements in ways that best effort public networks cannot.

Unlike public networks, private networks are not available to the public through commercially available devices and SIM cards. The network owner or operator controls the authorisation and the access to the network for permissioned devices and users. These definitions blur somewhat if the network is run by a “community” such as a municipality.

Typically, devices will not work outside the boundaries of their private network. That is a requirement in many use cases, such as manufacturing, where devices are not expected to continue functioning outside the premise. However, in a few areas, such as logistics, solutions can include the use of dual-SIM devices for both public and private networks or the use of other wide area technologies such as TETRA for voice. Moreover, agreements with public networks to enable roaming can be activated to support certain service continuity outside the private network boundaries.

While the technology and market are still developing, several terms are being used interchangeably to describe 3GPP private networks such dedicated networks, standalone networks, campus networks, local networks, vertical mobile network and non-public networks (NPN) as defined by the 3GPP.

The emergence of new telcos

Many telcos are not ready to support private networks demands from enterprises on large scale because they lack sufficient resources and expertise. Also, some enterprises might be reluctant to work with telcos for different reasons including their concerns over the traditional telcos’ abilities in vertical markets and a desire to control costs. This gap is already catalysing the emergence of new types of mobile network service providers, as opposed to traditional MNOs that operate national or regional public mobile networks.

These players essentially carry out the same roles as traditional MNOs in configuring the network, provisioning the service, and maintaining the private network infrastructure. Some of them may also have access to spectrum and buy network equipment and technologies directly from network equipment vendors. In addition to “new telcos” or “new operators”, other terms have been used to describe these players such as specialist operators and alternative operators. Throughout this report, we will use new telcos or specialist operators when describing these players collectively and traditional/public operators when referring to typical wide area national mobile network provider. New players can be divided into the following categories:

Possible private networks service providers

private networks ecosystem

Source: STL Partners

Table of content

  • Executive Summary
    • What next
    • Trends and recommendations for telcos, vendors, enterprises and policymakers
  • Introduction
  • Types of private network operators
    • What is a private network?
    • The emergence of new telcos
  • How various stakeholders are approaching the market
    • Technology development: Choosing between LTE and 5G
    • Private network technology vendors
    • Regional overview
    • Vertical overview
    • Mergers and acquisitions activities
  • The development of spectrum regulations
    • Unlicensed spectrum for LTE and 5G is an attractive option, but it remains limited
    • The rise of local spectrum licensing threatens some telcos
    • …but there is no one-size fits all in local spectrum licensing
    • How local spectrum licensing shapes the market and enterprise adoption
    • Recommendations for different stakeholders
  • Assessing the approaches to network implementation
    • Private network deployment models
    • Business models and roles for telcos
  • Conclusion and recommendations
  • Index
  • Appendix 1:  Examples of private networks deployments in 2020 – 2021

Enter your details below to request an extract of the report

5G: Bridging hype, reality and future promises

The 5G situation seems paradoxical

People in China and South Korea are buying 5G phones by the million, far more than initially expected, yet many western telcos are moving cautiously. Will your company also find demand? What’s the smart strategy while uncertainty remains? What actions are needed to lead in the 5G era? What questions must be answered?

New data requires new thinking. STL Partners 5G strategies: Lessons from the early movers presented the situation in late 2019, and in What will make or break 5G growth? we outlined the key drivers and inhibitors for 5G growth. This follow on report addresses what needs to happen next.

The report is informed by talks with executives of over three dozen companies and email contacts with many more, including 21 of the first 24 telcos who have deployed. This report covers considerations for the next three years (2020–2023) based on what we know today.

“Seize the 5G opportunity” says Ke Ruiwen, Chairman, China Telecom, and Chinese reports claimed 14 million sales by the end of 2019. Korea announced two million subscribers in July 2019 and by December 2019 approached five million. By early 2020, The Korean carriers were confident 30% of the market will be using 5G by the end of 2020. In the US, Verizon is selling 5G phones even in areas without 5G services,  With nine phone makers looking for market share, the price in China is US$285–$500 and falling, so the handset price barrier seems to be coming down fast.

Yet in many other markets, operators progress is significantly more tentative. So what is going on, and what should you do about it?

Enter your details below to request an extract of the report

5G technology works OK

22 of the first 24 operators to deploy are using mid-band radio frequencies.

Vodafone UK claims “5G will work at average speeds of 150–200 Mbps.” Speeds are typically 100 to 500 Mbps, rarely a gigabit. Latency is about 30 milliseconds, only about a third better than decent 4G. Mid-band reach is excellent. Sprint has demonstrated that simply upgrading existing base stations can provide substantial coverage.

5G has a draft business case now: people want to buy 5G phones. New use cases are mostly years away but the prospect of better mobile broadband is winning customers. The costs of radios, backhaul, and core are falling as five system vendors – Ericsson, Huawei, Nokia, Samsung, and ZTE – fight for market share. They’ve shipped over 600,000 radios. Many newcomers are gaining traction, for example Altiostar won a large contract from Rakuten and Mavenir is in trials with DT.

The high cost of 5G networks is an outdated myth. DT, Orange, Verizon, and AT&T are building 5G while cutting or keeping capex flat. Sprint’s results suggest a smart build can quickly reach half the country without a large increase in capital spending. Instead, the issue for operators is that it requires new spending with uncertain returns.

The technology works, mostly. Mid-band is performing as expected, with typical speeds of 100–500Mbps outdoors, though indoor performance is less clear yet. mmWave indoor is badly degraded. Some SDN, NFV, and other tools for automation have reached the field. However, 5G upstream is in limited use. Many carriers are combining 5G downstream with 4G upstream for now. However, each base station currently requires much more power than 4G bases, which leads to high opex. Dynamic spectrum sharing, which allows 5G to share unneeded 4G spectrum, is still in test. Many features of SDN and NFV are not yet ready.

So what should companies do? The next sections review go-to-market lessons, status on forward-looking applications, and technical considerations.

Early go-to-market lessons

Don’t oversell 5G

The continuing publicity for 5G is proving powerful, but variable. Because some customers are already convinced they want 5G, marketing and advertising do not always need to emphasise the value of 5G. For those customers, make clear why your company’s offering is the best compared to rivals’. However, the draw of 5G is not universal. Many remain sceptical, especially if their past experience with 4G has been lacklustre. They – and also a minority swayed by alarmist anti-5G rhetoric – will need far more nuanced and persuasive marketing.

Operators should be wary of overclaiming. 5G speed, although impressive, currently has few practical applications that don’t already work well over decent 4G. Fixed home broadband is a possible exception here. As the objective advantages of 5G in the near future are likely to be limited, operators should not hype features that are unrealistic today, no matter how glamorous. If you don’t have concrete selling propositions, do image advertising or use happy customer testimonials.

Table of Contents

  • Executive Summary
  • Introduction
    • 5G technology works OK
  • Early go-to-market lessons
    • Don’t oversell 5G
    • Price to match the experience
    • Deliver a valuable product
    • Concerns about new competition
    • Prepare for possible demand increases
    • The interdependencies of edge and 5G
  • Potential new applications
    • Large now and likely to grow in the 5G era
    • Near-term applications with possible major impact for 5G
    • Mid- and long-term 5G demand drivers
  • Technology choices, in summary
    • Backhaul and transport networks
    • When will 5G SA cores be needed (or available)?
    • 5G security? Nothing is perfect
    • Telco cloud: NFV, SDN, cloud native cores, and beyond
    • AI and automation in 5G
    • Power and heat

Enter your details below to request an extract of the report

$1.4tn of benefits in 2030: 5G’s impact on industry verticals

Understanding the 5G opportunity in other industries

The aim of this report is to highlight the impact that 5G will have on global GDP between 2020 and 2030. To do this, we have focused on eight industries where we feel 5G will have the largest impact. Often when 5G is discussed, the focus is on the impact it will have on the consumer market. Here, we argue that 5G will unlock significant new revenue opportunities in the enterprise space, enabling innovative use cases that are currently impossible to scale commercially (with existing technologies).

Insight from this report is explored further in the following publications:

The document was researched and written independently by STL Partners, supported by Huawei. STL’s conclusions are entirely independent and built on ongoing research into the future of telecoms. STL Partners has written widely on the topic of 5G, including a recent two-part series into the short- and long-term opportunities unlocked by 5G, and lessons that can be learnt from early movers.

Comparing apples with apples: How to compare nascent 5G with established 4G

If you compare the technological specifications for 3GPP release 14 and 3GPP release 15 (the first 5G release), you might be underwhelmed. Despite the hype that 5G will be transformative, it does not appear to be delivering much more than incremental increases in speed and reliability. But, of course, 4G is now a mature form of connectivity (having been in-life for 6+ years) whereas 5G is still nascent.

To compare apples with apples, it makes sense to compare 5G release 16, where capabilities such as ultra-reliable low-latency and network slicing are being added, with LTE today.

Mature 5G benchmarked against the capabilities of mature 4G

Mature 5G benchmarked against mature 4G

Source: ITU, Nokia, ublox, gps world

Of course, these figures represent a best-case scenario occurring in a laboratory environment. This is true for both the 4G and 5G numbers. It’s also true that, in reality, it will take time before we see commercialised rollout of enhanced mobile broadband (“pure 5G”) rather than enhanced mobile broadband with 4G fall-back alongside fixed wireless access. Despite this, these figures make clear that when 5G reaches maturity, it will far outstrip the capabilities of 4G, and unlock new use cases.

Our assumption is that by 2025 5G technology will be mature, enabling massive M2M / IoT use cases as well as those that require ultra-reliable low-latency communications. Several of the 5G use cases we’ll go on to explore in more detail are reliant on this technology, so it is important to acknowledge that their commercialisation is only likely to start from around 2023 and in many markets they still won’t be fully deployed in 2030.

It’s not all about LTE: 5G must be compared to all available technology

Mobile is not the only form of connectivity used by enterprises. Plenty of industries are also making use of Wi-Fi, LPWAN, Zigbee, Bluetooth and fixed connectivity as part of their overall connectivity solution. When 5G is rolled out, in some cases, it will need to integrate with these existing technologies rather than replace them. The table below summarises some of the key benefits and shortcomings of current technologies, including highlighting the sorts of situations in which industries are making use of them.

Current technologies will not be entirely replaced by 5G, but it can address some of they key shortcomings

current technologies will not be entirely replaced by 5G, but it can address some of their key shortcomings

There are clear scenarios where 5G will be superior to existing technologies and bring significant benefits to industrial users. Ultimately, in particular, 5G will enable:

  1. Low latency and high bandwidth requirements for wireless connectivity
  2. Massive IoT through ability to handle high cell density
  3. Ultra-reliable and secure connectivity.

Table of Contents

  • Preface
  • Executive Summary
    • 5G enabled solutions are estimated to add c.$1.4 trillion to global GDP in 2030
    • Operators must embrace new business models to unlock significant revenues with 5G
    • Recommendations for operators: how to capitalise on the 5G opportunity
  • Introduction
    • Background
    • Comparing apples with apples: how to compare nascent 5G with established 4G
    • It’s not all about LTE: 5G must be compared to all available technology
    • 5G deployment: 5G will mature over the next ten years
  • 5G will add more than $1.4 trillion to the global economy by 2030
  • Mobile network operator strategic options with 5G
    • 5G alone will not change the game for operators
    • Strategic options for operators to add more value with 5G
  • 5G-enabled digital transformation in healthcare
    • Example 5G use case: Remote patient monitoring
    • Implications for telcos
  • 5G-enabled digital transformation in manufacturing
    • 5G can create $740bn in additional GDP by 2030
    • Example 5G use case: Advanced predictive maintenance
    • Implications for telcos
  • Conclusions for operators: how to capitalise on the 5G opportunity

Table of Figures

  • Figure 1: Mature 5G benchmarked against the capabilities of mature 4G
  • Figure 2: Current technologies will not be entirely replaced by 5G, but it can address some of their key shortcomings
  • Figure 3: Forecast of 5G deployment in major regions
  • Figure 4: Responses from industry surveys
  • Figure 5: 5G will contribute ~$1.4 trillion to global GDP by 2030
  • Figure 6: Manufacturing, energy & extractives and media, sports & entertainment industries will see the largest upticks to their industry thanks to 5G use cases
  • Figure 7: In 2030, manufacturing and construction will be the largest industry sectors (in 2030)
  • Figure 8: High income countries will see almost 75% of the benefit of 5G in 2025, but the share is more even across all geographies by 2030
  • Figure 9: 4G rollout did not produce sustainable revenue increase
  • Figure 10: What should telcos’ role be in 5G B2B?
  • Figure 11: As telcos move beyond just connectivity, they can increase their share of the wallet
  • Figure 12: Telcos must focus efforts in specific verticals – some are already doing this
  • Figure 13: Global impact of 5G on healthcare across four key contact points
  • Figure 14: Remote patient monitoring enables wearables to send data about the patient to the hospital for monitoring
  • Figure 15: Estimated impact of 5G-enabled remote patient monitoring
  • Figure 16: The potential roles for telcos can within healthcare
  • Figure 17: The TELUS Health Exchange as a point of coordination
  • Figure 18: There is opportunity for telcos’ to play multiple roles higher up the value chain in healthcare
  • Figure 19: Estimated impact of 5G on manufacturing GDP (USD Billions) by use case
  • Figure 20: Advanced predictive maintenance enables many sensors to send data about machinery for monitoring and optimisation

The 5G core and NFV: Different sides of the same coin?

The 5G core is an instance of standardised, operationalised NFV

The 5G mobile core network as defined by the 3rd Generation Partnership Project (3GPP) standards body, along with the other network functions specific to 5G mobile networks (e.g. the Radio Access Network, or RAN), is intended to be ‘fully’ virtualised.

There are four main reasons for this, as set out below. The first two in the list relate more particularly to what we describe in this report as Phase 1 of the NFV project, as well as to the so-called Non-Standalone (NSA) 5G core. The last two reasons are dependent on capabilities being introduced as part of Phase 2 NFV and the Standalone (SA) mobile core:

  1. Scalability: to enable the capacity of the mobile core – particularly that of the data plane – to be scaled up flexibly and dynamically to support rapidly growing data volumes, both for existing 4G services and especially the much higher volumes expected with 5G.
  2. Cost: the replacement of dedicated hardware appliances supporting network functions by Virtual Machines (VMs) – and other modes of Virtualised Network Function (VNF), such as micro-services and containers – running over COTS hardware in theory enables that scaling of capacity to be carried out much more cost-efficiently.
  3. Latency: virtualisation, along with separation of the control and user plane within the core, allows that dynamically scalable data-plane capacity to be brought physically closer to the end user and application. This is important in the case of latency-critical services.
  4. Network slicing: to enable dynamic, automated network-slicing capabilities, which depend on being able to spin up end-to-end virtual networks – including the core – on demand, based on the variable networking requirements of individual clients and use cases.

Enter your details below to download an extract of the report

There are serious questions as to whether the first two objectives in the above list have yet been adequately achieved, even in the context of 4G core (Evolved Packet Core: EPC) virtualisation let alone the context of the NSA 5G core (5GC). And in respect of the last two items in the list, there are many outstanding questions regarding the eventual technical and commercial models that will be adopted to support low-latency services from the network edge, and about the business models for network slicing in all its possible forms.Nonetheless, in the 3GPP 5G core, the industry has at least – and at last – reached agreement on a set of NFV standards, and has begun deploying and operating them as commercial 5G networks are rolled out. This is in stark contrast to the broader NFV project, where alignment around a set of industry-wide standards has proved elusive, although some momentum has built up around open-source programmes such as the Open Network Automation Platform (ONAP) and the Metro Ethernet Forum (MEF) in the past year or two.

The 5G networks that have been launched to date – which have all been done on the basis of the NSA core – are therefore an example of operationalised and standardised NFV that is finally delivering, albeit with the caveats expressed above.

3GPP has specified two 5G core standards: Non-standalone (NSA) and Standalone (SA)

In brief, 3GPP – and the many operators and vendors that have contributed to its work – have agreed on two 5GC standards. The first of these, the Non-Standalone (NSA) core (agreed as part of Release 15 of the standards, in December 2017), essentially involves using a virtualised and more ‘cloud-native’ version of the existing 4G core (or EPC) to support 5G New Radio (NR) wireless transmission in tandem with existing LTE services. This is illustrated in Figure 2 below:

NSA core and dual-mode LTE/5G NR operation

NSA Core and dual-mode LTE / 5G NR operation

Source: 3GPP

The purpose of the NSA core is to help facilitate a smooth and rapid introduction of 5G services by enabling telcos to reuse their existing virtual EPCs to support 5G NR, which in any case will be provided as a dual-band service – in combination with 4G, 3G and even 2G – for several years while 5G coverage is being built up.

The second of the 3GPP 5GC standards – the Standalone (SA) core – was first agreed in June 2018, also as part of Release 15. However, a further iteration of the SA specification is expected with Release 16, due in March 2020; and there may be further iterations in Release 17. As the name suggests, this is a completely new, 5G-only core. It has a simplified, ‘cloud-native’ and distributed architecture, and is designed to support services and functions such as network slicing, Ultra-Reliable Low-Latency Communications (URLLC) and enhanced Machine-Type Communications (eMTC, i.e. massive IoT).

Non-standalone 5G core basic architecture 

Non-standalone 5G core basic architecture

Source: 3GPP, STL Partners annotations in red

One major innovation compared with the 4G EPC is the decomposition of the Mobility Management Entity (MME) into two component parts: the Session Management Function (SMF) and the Access Management Function (AMF). This allows for optimisation of each of those functions to support increasingly complex use cases involving low-latency transmission of data, to and from multiple device types, across multiple network domains.

Each of the macro-level network functions illustrated in the above diagram are themselves composed of multiple ‘micro-services’ (smaller segments of software-based functionality) as part of the 5G core’s ‘cloud-native’ character. There are many formal, technical definitions of what ‘cloud-native’ means; but for our purposes, we take this term to mean that the software components forming part of a network function are disaggregated: broken up into loosely coupled ‘micro-services’ – containerised or otherwise – that are able in theory to be deployed, separately scaled and upgraded, orchestrated, and managed in innumerable permutations, configurations and distributions to support the demands of different use cases.

This means that not only the macro-level functions illustrated in the above diagram, but also the underlying micro-services, can in theory be adapted, recombined or exchanged with comparable micro-services from other vendors, to support the data-processing, security or mobility requirements of different use cases – although in the 3GPP standards, this can happen only within certain parameters in order not to compromise the integrity of specified services such as URLLC or eMTC.

The 5G core standards are designed for the ‘core’ telco business

The 3GPP standardisation effort has been driven by the desire to define and assure 5G network functionality, especially those aspects that relate to the ‘core’ telco business: connectivity. This is connectivity:

  • either as a service in its own right, e.g.
    • IP-based voice communications (as enabled by micro-services carrying forward the functionality of the current IP Multimedia Subsystem (IMS) in 3G and 4G networks), and
    • Enhanced Mobile Broadband (eMBB: the much higher-speed broadband services of 5G compared with 4G).

These are classic, core telco services of the first and second ‘ages’ of telecoms (the Communications Age and Information Age respectively), as described in a recent STL Partners report

  • or as the delivery mechanism for services created and monetised by others, e.g.
    • URLLC-dependent content services such as AR / VR, or
    • URLLC- and eMTC-dependent IoT / process optimisation services.

These IoT / process-optimisation use cases represent services of the ‘third’ telco age (the Coordination Age), while digital content-rich services such as AR and VR can be viewed as advanced Information Age services.

In other words, the 5G core standards embody and perpetuate the view that the core (fundamental) telco business is providing standardised, commoditised, universally available and accessible connectivity services and platforms, over which predominantly third parties – as opposed to telcos themselves – develop and deliver useful and entertaining, value-generating, digital and coordination services. The 5G standards are for standard telcos – but we believe the potential of 5G for telcos can eventually be much more.

Table of contents

  • Executive Summary
  • Introduction
    • The 5G core is an instance of standardised, operationalised NFV
    • 3GPP has specified two 5G core standards: Non-standalone (NSA) and Standalone (SA)
    • The 5G core standards are designed for the ‘core’ telco business
    • The 5G core standards are also defined with vendors’ interests very much to the fore
    • But the 5G core standards are in some respects inconsistent with the goals, status and methodology of the broader NFV project
    • Rakuten Mobile: The tension between cloud-nativity and operational NFV pragmatism
  • Rakuten Mobile: A case of (not quite yet) operational NFV – but not as virtualised and cloud-native as claimed
    • Is Rakuten’s network truly cloud-native, multi-vendor and fully virtualised?
    • The Rakuten Cloud Platform is a medium-term, pragmatic compromise – but not a long-term blueprint
  • An alternative, NFV-driven approach to 5G: What, how and when?
    • Alternative thinking: Telco-specific cores for new services and use cases
    • Telcos must adopt a ‘third age’ approach to 5G, not a ‘first age’ one
  • Conclusion: 5G and NFV – head and tail of the same coin?

Enter your details below to download an extract of the report

MobiNEX: The Mobile Network Experience Index, H1 2016

Executive Summary

In response to customers’ growing usage of mobile data and applications, in April 2016 STL Partners developed MobiNEX: The Mobile Network Experience Index, which ranks mobile network operators by key measures relating to customer experience. To do this, we benchmark mobile operators’ network speed and reliability, allowing individual operators to see how they are performing in relation to the competition in an objective and quantitative manner.

Operators are assigned an individual MobiNEX score out of 100 based on their performance across four measures that STL Partners believes to be core drivers of customer app experience: download speed, average latency, error rate and latency consistency (the proportion of app requests that take longer than 500ms to fulfil).

Our partner Apteligent has provided us with the raw data for three out of the four measures, based on billions of requests made from tens of thousands of applications used by hundreds of millions of users in H1 2016. While our April report focused on the top three or four operators in just seven Western markets, this report covers 80 operators drawn from 25 markets spread across the globe in the first six months of this year.

The top ten operators were from Japan, France, the UK and Canada:

  • Softbank JP scores highest on the MobiNEX for H1 2016, with high scores across all measures and a total score of 85 out of 100.
  • Close behind are Bouygues FR (80) and Free FR (79), which came first and second respectively in the Q4 2015 rankings. Both achieve high scores for error rate, latency consistency and average latency, but are slightly let down by download speed.
  • The top six is completed by NTT DoCoMo JP (78), Orange FR (75) and au (KDDI) JP (71).
  • Slightly behind are Vodafone UK (65), EE UK (64), SFR FR (63), O2 UK (62) and Rogers CA (62). Except in the case of Rogers, who score similarly on all measures, these operators are let down by substantially worse download speeds.

The bottom ten operators all score a total of 16 or lower out of 100, suggesting a materially worse customer app experience.

  • Trailing the pack with scores of 1 or 2 across all four measures were Etisalat EG (4), Vodafone EG (4), Smart PH (5) and Globe PH (5).
  • Beeline RU (11) and Malaysian operators U Mobile MY (9) and Digi MY (9) also fare poorly, but benefit from slightly higher latency consistency scores. Slightly better overall, but still achieving minimum scores of 1 for download speed and average latency, are Maxis MY (14) and MTN ZA (12).

Overall, the extreme difference between the top and bottom of the table highlights a vast inequality in network quality customer experience across the planet. Customer app experience depends to a large degree on where one lives. However, our analysis shows that while economic prosperity does in general lead to a more advanced mobile experience as you might expect, it does not guarantee it. Norway, Sweden, Singapore and the US market are examples of high income countries with lower MobiNEX scores than might be expected against the global picture. STL Partners will do further analysis to uncover more on the drivers of differentiation between markets and players within them.


MobiNEX H1 2016 – included markets

MobiNEX H1 2016 – operator scores

 Source: Apteligent, OpenSignal, STL Partners analysis


  • About MobiNEX
  • Changes for H1 2016
  • MobiNEX H1 2016: results
  • The winners: top ten operators
  • The losers: bottom ten operators
  • The surprises: operators where you wouldn’t expect them
  • MobiNEX by market
  • MobiNEX H1 2016: segmentation
  • MobiNEX H1 2016: Raw data
  • Error rate
  • Latency consistency
  • Download speed
  • Average latency
  • Appendix 1: Methodology and source data
  • Latency, latency consistency and error rate: Apteligent
  • Download speed: OpenSignal
  • Converting raw data into MobiNEX scores
  • Setting the benchmarks
  • Why measure customer experience through app performance?
  • Appendix 2: Country profiles
  • Country profile: Australia
  • Country profile: Brazil
  • Country profile: Canada
  • Country profile: China
  • Country profile: Colombia
  • Country profile: Egypt
  • Country profile: France
  • Country profile: Germany
  • Country profile: Italy
  • Country profile: Japan
  • Country profile: Malaysia
  • Country profile: Mexico
  • Country profile: New Zealand
  • Country profile: Norway
  • Country profile: Philippines
  • Country profile: Russia
  • Country profile: Saudi Arabia
  • Country profile: Singapore
  • Country profile: South Africa
  • Country profile: Spain
  • Country profile: United Arab Emirates
  • Country profile: United Kingdom
  • Country profile: United States
  • Country profile: Vietnam


  • Figure 1: MobiNEX scoring breakdown, benchmarks and raw data used
  • Figure 2: MobiNEX H1 2016 – included markets
  • Figure 3: MobiNEX H1 2016 – operator scores breakdown (top half)
  • Figure 4: MobiNEX H1 2016 – operator scores breakdown (bottom half)
  • Figure 5: MobiNEX H1 2016 – average scores by country
  • Figure 6: MobiNEX segmentation dimensions
  • Figure 7: MobiNEX segmentation – network speed vs reliability
  • Figure 8: MobiNEX segmentation – network speed vs reliability – average by market
  • Figure 9: MobiNEX vs GDP per capita – H1 2016
  • Figure 10: MobiNEX vs smartphone penetration – H1 2016
  • Figure 11: Error rate per 10,000 requests, H1 2016 – average by country
  • Figure 12: Error rate per 10,000 requests, H1 2016 (top half)
  • Figure 13: Error rate per 10,000 requests, H1 2016 (bottom half)
  • Figure 14: Requests with total roundtrip latency > 500ms (%), H1 2016 – average by country
  • Figure 15: Requests with total roundtrip latency > 500ms (%), H1 2016 (top half)
  • Figure 16: Requests with total roundtrip latency > 500ms (%), H1 2016 (bottom half)
  • Figure 17: Average weighted download speed (Mbps), H1 2016 – average by country
  • Figure 18: Average weighted download speed (Mbps), H1 2016 (top half)
  • Figure 19: Average weighted download speed (Mbps), H1 2016 (bottom half)
  • Figure 20: Average total roundtrip latency (ms), H1 2016 – average by country
  • Figure 21: Average total roundtrip latency (ms), H1 2016 (top half)
  • Figure 22: Average total roundtrip latency (ms), H1 2016 (bottom half)
  • Figure 23: Benchmarks and raw data used

MobiNEX: The Mobile Network Experience Index, Q4 2015

Executive Summary

In response to customers’ growing usage of mobile data and applications, STL Partners has developed MobiNEX: The Mobile Network Customer Experience Index, which benchmarks mobile operators’ network speed and reliability by measuring the consumer app experience, and allows individual players to see how they are performing in relation to competition in an objective and quantitative manner.

We assign operators an individual MobiNEX score based on their performance across four measures that are core drivers of customer app experience: download speed; average latency; error rate; latency consistency (the percentage of app requests that take longer than 500ms to fulfil). Apteligent has provided us with the raw data for three out of four of the measures based on billions of requests made from tens of thousands of applications used by hundreds of millions of users in Q4 2015. We plan to expand the index to cover other operators and to track performance over time with twice-yearly updates.

Encouragingly, MobiNEX scores are positively correlated with customer satisfaction in the UK and the US suggesting that a better mobile app experience contributes to customer satisfaction.

The top five performers across twenty-seven operators in seven countries in Europe and North America (Canada, France, Germany, Italy, Spain, UK, US) were all from France and the UK suggesting a high degree of competition in these markets as operators strive to improve relative to peers:

  • Bouygues Telecom in France scores highest on the MobiNEX for Q4 2015 with consistently high scores across all four measures and a total score of 76 out of 100.
  • It is closely followed by two other French operators. Free, the late entrant to the market, which started operations in 2012, scores 73. Orange, the former national incumbent, is slightly let down by the number of app errors experienced by users but achieves a healthy overall score of 70.
  • The top five is completed by two UK operators: EE (65) and O2 (61) with similar scores to the three French operators for everything except download speed which was substantially worse.

The bottom five operators have scores suggesting a materially worse customer app experience and we suggest that management focuses on improvements across all four measures to strengthen their customer relationships and competitive position. This applies particularly to:

  • E-Plus in Germany (now part of Telefónica’s O2 network but identified separately by Apteligent).
  • Wind in Italy, which is particularly let down by latency consistency and download speed.
  • Telefónica’s Movistar, the Spanish market share leader.
  • Sprint in the US with middle-ranking average latency and latency consistency but, like other US operators, poor scores on error rate and download speed.
  • 3 Italy, principally a result of its low latency consistency score.

Surprisingly, given the extensive deployment of 4G networks there, the US operators perform poorly and are providing an underwhelming customer app experience:

  • The best-performing US operator, T-Mobile, scores only 45 – a full 31 points below Bouygues Telecom and 4 points below the median operator.
  • All the US operators perform very poorly on error rate and, although 74% of app requests in the US were made on LTE in Q4 2015, no US player scores highly on download speed.

MobiNEX scores – Q4 2015

 Source: Apteligent, OpenSignal, STL Partners analysis

MobiNEX vs Customer Satisfaction

Source: ACSI, NCSI-UK, STL Partners


  • Introduction
  • Mobile app performance is dependent on more than network speed
  • App performance as a measure of customer experience
  • MobiNEX: The Mobile Network Experience Index
  • Methodology and key terms
  • MobiNEX Q4 2015 Results: Top 5, bottom 5, surprises
  • MobiNEX is correlated with customer satisfaction
  • Segmenting operators by network customer experience
  • Error rate
  • Quantitative analysis
  • Key findings
  • Latency consistency: Requests with latency over 500ms
  • Quantitative analysis
  • Key findings
  • Download speed
  • Quantitative analysis
  • Key findings
  • Average latency
  • Quantitative analysis
  • Key findings
  • Appendix: Source data and methodology
  • STL Partners and Telco 2.0: Change the Game
  • About Apteligent


  • MobiNEX scores – Q4 2015
  • MobiNEX vs Customer Satisfaction
  • Figure 1: MobiNEX – scoring methodology
  • Figure 2: MobiNEX scores – Q4 2015
  • Figure 3: Customer Satisfaction vs MobiNEX, 2015
  • Figure 4: MobiNEX operator segmentation – network speed vs network reliability
  • Figure 5: MobiNEX operator segmentation – with total scores
  • Figure 6: Major Western markets – error rate per 10,000 requests
  • Figure 7: Major Western markets – average error rate per 10,000 requests
  • Figure 8: Major Western operators – percentage of requests with total roundtrip latency greater than 500ms
  • Figure 9: Major Western markets – average percentage of requests with total roundtrip latency greater than 500ms
  • Figure 10: Major Western operators – average weighted download speed across 3G and 4G networks (Mbps)
  • Figure 11: Major European markets – average weighted download speed (Mbps)
  • Figure 12: Major Western markets – percentage of requests made on 3G and LTE
  • Figure 13: Download speed vs Percentage of LTE requests
  • Figure 14: Major Western operators – average total roundtrip latency (ms)
  • Figure 15: Major Western markets – average total roundtrip latency (ms)
  • Figure 16: MobiNEX benchmarks

Self-Disruption: How Sprint Blew It

Introduction

At the beginning of 2013, we issued an Executive Briefing on the proposed take-over of Sprint-Nextel by Softbank, which we believed to be the starting gun for disruption in the US mobile market.

At the time, not only was 68% of revenue in the US market controlled by the top two operators, AT&T and Verizon, it was also an unusually lucrative market in general, being both rich and high-spending (see Figure 1, taken from the The Future Value of Voice & Messaging strategy report). Further, the great majority of net-adds were concentrated among the top two operators, with T-Mobile USA flat-lining and Sprint beginning to lose subscribers. We expected Sprint to initiate a price war, following a plan similar to Softbank’s in Japan, separating the cost of devices from that of service, making sure to offer the hero smartphone of the day, and offering good value on data bundles.

Figure 1: The US, a rich country that spends heavily on telecoms

The US a rich country that spends heavily on telecoms feb 2014

Source: STL Partners

In the event, the fight for control of Sprint turned out to be more drawn out and complex than anyone expected. Add to this the complexity of Sprint’s major network upgrade, Network Vision, as shown in Figure 2, and the fact that the plans changed in order to take advantage of Softbank’s procurement of devices for the 2.5GHz band, and it is perhaps less surprising that we have yet to see a major strategic initiative from Sprint.

Figure 2: The Softbank deal brought with it major changes to Network Vision
The Softbank deal brought with it major changes to Network Vision feb 2014

Source: Sprint Q3 earnings report

Instead, T-Mobile USA implemented a very similar strategy, having completed the grieving process for the AT&T deal and secured investment from DTAG for their LTE roll-out and spectrum enhancements. So far, their “uncarrier” strategy has delivered impressive subscriber growth at the expense of slashing prices. The tale of 2013 in terms of subscribers can be seen in the following chart, updated from the original Sprint/Softbank note. (Note that AT&T, VZW, and T-Mobile have released data for calendar Q3, but Sprint hasn’t yet – the big question, going by the chart, will be whether T-Mobile has overtaken Sprint for cumulative net-adds.)

Figure 3: The duopoly marches on, T-Mobile recovers, Sprint in trouble

The duopoly marches on, T-Mobile recovers, Sprint in trouble Feb 2014

Source: STL Partners

However, Sprint did have a major strategic initiative in the last two years – and one that went badly wrong. We refer, of course, to the shutdown of the Nextel half of Sprint-Nextel.

Closing Nextel: The Optimistic Case

There is much that is good inside Sprint, which explains both why so much effort went into its “turnaround” and why Masayoshi Son was interested. For example, its performance in terms of ARPU is strong, to say the least. The following chart, Figure 4, illustrates the point. Total ARPU in post-paid, which is most of the business, is both high at just under $65/mo and rising steadily. ARPU in pre-paid is essentially flat around $25/mo. The problem was Nextel and specifically, Nextel post-paid – while pre-paid hovered around $35/mo, post-paid trended steadily down from $45/mo to parity with pre-paid by the end.

Figure 4: Sprint-Nextel ARPU

Sprint-Nextel ARPU feb 2014

Source: STL Partners

The difference between the two halves of Sprint that were doing the work here is fairly obvious. Nextel’s unique iDEN network was basically an orphan, without a development path beyond the equivalent of 2005-era WCDMA speeds, and without smartphones. Sprint CDMA, and later LTE, could offer wireless broadband and could offer the iPhone. Clearly, something had to be done. You can see the importance of smartphone adoption from the following graphic, Figure 5, showing that smartphones drove ARPU on Sprint’s CDMA network.

Figure 5: Sprint CDMA has reached 80% smartphone adoption

Sprint CDMA has reached 80% smartphone adoption feb 2014

Source: STL Partners

It is true that smartphones create opportunities to substitute OTT voice and messaging, but this is less of a problem in the US. As the following chart from the Future Value of Voice and Messaging strategy report shows, voice and messaging are both cheap in the US, and people spend heavily on mobile data.

Figure 6: US mobile key indicators

US mobile key indicators feb 2014

Source: STL Partners

So far, the pull effect of better devices on data usage has helped Sprint grow revenues, while it also drew subscribers away from Nextel. Sprint’s strategy in response to this was to transition Nextel subscribers over to the mainline platform, and then shut down the network, while recycling savings and spectrum from the closure of Nextel into their LTE deployment.


  • Closing Nextel: The Scoreboard
  • Recapture
  • The Double Dippers
  • The Competition: AT&T Targets the Double Dippers
  • Developers, Developers, Devices
  • Conclusions


  • Figure 1: The US, a rich country that spends heavily on telecoms
  • Figure 2: The Softbank deal brought with it major changes to Network Vision
  • Figure 3: The duopoly marches on, T-Mobile recovers, Sprint in trouble
  • Figure 4: Sprint-Nextel ARPU
  • Figure 5: Sprint mainline has reached 80% smartphone adoption
  • Figure 6: US mobile key indicators
  • Figure 7: Tale of the tape – something goes wrong in early 2012
  • Figure 8: Sprint’s “recapture” rate was falling during 3 out of the 4 biggest quarters for Nextel subscriber losses, when it needed to be at its best
  • Figure 9: Nextel post-paid was 72% business customers in 3Q 2011
  • Figure 10: The loss of high-value SMB customers dragged Sprint’s revenues into negative territory
  • Figure 11: The way mobile applications development used to be

Sprint-Softbank: how it will disrupt the US market

Summary:

The Japanese and French markets have both been disrupted through the entry of low-cost competitors offering substantial price reductions. We think that Softbank’s acquisition of Sprint is a signal that the same is to soon come in the US given Softbank’s experience as a successful disruptor in Japan. (January 2013, Executive Briefing Service)

Digital Commerce Flywheel December 2012
  Read in Full (Members only)  To Subscribe click here

Below is an extract from this 23 page Telco 2.0 Report that can be downloaded in full in PDF format by members of the Telco 2.0 Executive Briefing service here. Non-members can subscribe here or other enquiries, please email contact@telco2.net / call +44 (0) 207 247 5003.

We’ll also be discussing our findings at the New Digital Economics Brainstorm in Silicon Valley, 19-20 March, 2013.

Overview

Once upon a time…

Japan used to be a mobile market with two serious competitors, high ARPUs and margins, and three laggard players that nobody took too seriously. France’s mobile market had three operators, a highly tolerant regulator, and high margins. And the US mobile market once had a relatively laissez-faire regulator, high ARPUs, two mighty duopolists, and two laggards.

The Japanese and French markets have both been disrupted through the entry of low-cost competitors offering substantial price reductions, and in Japan’s case the disruptor was Softbank. The US now has a regulator seemingly more influenced by voices from Silicon Valley than ‘big telco’ lobbyists, the duopolists have attractive margins, and Softbank now stands behind Sprint. The scene appears set for a disruptive play.

The lessons of history

In Japan, back in 2006, when Vodafone sold its Japanese operation to Masayoshi Son’s Softbank, the mobile market was relatively stable with two large players – NTT Docomo and KDDI – and three much smaller ones including Softbank which were not making money (hence Vodafone’s decision to withdraw from Japan). Softbank spotted the disruptive possibilities of the Apple iPhone, the advantages of being Japan’s only operator on the UMTS world standard, and the fat margins of the duopolists. It became the iPhone exclusive carrier, benefited from world 3G infrastructure competition, and set keen prices on data to cut into the duopoly.  And the results have been spectacular: Operating income has increased 6 times since Softbank acquired the business from Vodafone, and net additions in 2012 were running 127% higher than those of NTT DoCoMo and 51% higher than KDDI.

In France back in 2011, three French operators shared out the market, under the eyes of ARCEP, a regulator much more enthusiastic about planning for infrastructure development than driving competition. That year, Free.fr, a company that had already disrupted the fixed ISP market through mastering software and therefore having the best customer premises devices and the lowest costs, finally got a 3G licence. Using a radical new network design based on small cells and WLAN-cellular integration, Free tore into the oligopolists at staggeringly low prices.

In the United States, between 2005 and 2009, the friendly regulator – FCC Chairman Kevin J. Martin – permitted three great mergers in wireless, creating the new AT&T, the new Verizon, and the new Sprint-Nextel. Out of those, execution was successful in the first two. Sprint-Nextel misjudged the importance of Nextel’s specialism in voice, made a bad bet on WiMAX, leaving itself excluded from the emerging smartphone arena, and anyway had the hardest integration challenge. This is now acknowledged by Daniel R. Hesse, Sprint-Nextel’s CEO.

“Hesse said that the AT&T’s failed attempt to consolidate two of the Big 4 made him realize that there was no longer such a thing as the Big 4. The industry had bifurcated into the Big 2 and everybody else.” … “With 20/20 hindsight, the Nextel merger was a mistake,” Hesse said. “The synergies, if you will, that we had hoped for and planned for didn’t materialize.” 

Source: GigaOm

AT&T and Verizon, however, made it across the merger swamp to found an effective duopoly, a dominating force that controls 68% of revenue in the world’s critical wireless market, and which regularly achieves 30+% margins while its rivals struggle to break even. Verizon’s decision to end the standards wars and go with LTE effectively killed the CDMA development path and left Sprint stuck with WiMAX. Was it strategy or happy accident?

So, what’s next?

Now, things have changed. Sprint has been bought out by none other than Softbank – the original Japanese disruptor. It is a reminder that strategic advantage is temporary and disruption is inevitable.

We expect that the new Sprint will take the pain to push ahead with its transition to LTE. The previous Softbank and Sprint experiences have shown that being outside the world standard is deadly from a devices point of view, which remains critical to success in mobile. We expect that they may make a much bigger effort with carrier WLAN, far better standardised, far more available, and in many ways technically more robust than WiMAX.

We also expect that Sprint/Softbank will aim for the simplest form of disruption, price war. Oligopolies are always either in a state of price stability or of price war. Whether a cartel controls the market, or a tacit balance of fear constrains action, stability reigns, until it doesn’t. Then, price war rages, as no-one can afford to resist. Customers will benefit. T-Mobile, trying to fight its way to the start-line, will suffer most of all.

Another lesson from Softbank, though, is that disruption on price needs a killer product if it is to be more than a race to the bottom. We explore some further strategy options for Sprint in the body of this report.

In addition to its impact on the core US telecoms market, the prospect of forthcoming disruption also raises the stakes on the question of whether the US telcos are transforming to new Telco 2.0 business models fast enough (see our report A Practical Guide to Implementing Telco 2.0). This is a topic that we will explore further in our research and at the next Silicon Valley Executive Brainstorm, March 19-20, 2013.

Orientation: The Softbank Experience

Masayoshi Son’s strategy at Softbank, after acquiring the Vodafone stake, was simple – sharp pricing, especially on data, and hot gadgets.

The iPhone: a disruptive innovation

Softbank was the launch partner for the iPhone in Japan and remained Apple’s exclusive carrier up to the release of the iPhone 4S. Softbank’s annual report shows the impact of the iPhone and repricing very clearly – the partnership with Apple was signed in June, 2008, and the iPhone 4S launch followed in Q3 2011. The disruption was transient, but it had lasting effects on the market, restoring Softbank as a serious competitor, in much the same way as it turbocharged AT&T in the US a year before.

Figure 1: iDisrupt – the June ‘08 iPhone launch reset the market in Japan

Softbank Results, January 2013Source: Softbank

The combination of keen pricing and iPhones had a lasting effect on subscriber growth, too. Throughout the exclusivity era, Softbank beat its rivals for net-adds handsomely.

The impact on price: enduring reduction in margins

However, this came at a price. On a quarterly basis, a steady erosion of operating margin is visible, driven partly by the pricing strategy and partly by the cost of the shiny, shiny gadgets. One way of mitigating this was to carve out the cost of the device from the cost of service. Rather than paying nothing up front, Softbank subscribers paid a monthly device charge, or else either paid cash or brought their own.

Softbank’s annual report says that their subscriber-acquisition cost was falling in their FY 2012 (i.e. 2011-12), but also that the average subscriber upgrade cost had increased – in a smartphone environment, users who were brought on board on a cheaper device will tend to eventually demand something better.

As a result, Softbank has been able to keep its share of net adds over 40%. In a market with four players, this is a major achievement. However, to do so, they have had to accept the erosion of their margins and pricing.

Figure 3: Softbank – keeping ahead of the competition…

Softbank Net Adds and Margins, January 2013Source: STL Partners, Softbank

Clearly, price disruption can work, and it is reasonable to think that something similar might happen in the US, a similar market. In the international context, US mobile operators are pricey: the US is the fourth-highest OECD market by ARPU.

On average, for instance, a triple-play package that bundles Internet, telephone and television sells for $160 a month with taxes. In France the equivalent costs just $38. For that low price the French also get long distance to 70 foreign countries, not merely one; worldwide television, not just domestic; and an Internet that’s 20 times faster uploading data and 10 times faster downloading it.

To read the note in full, including the following additional analysis…

  • Executive Summary
  • Orientation: The Softbank Experience
  • The iPhone: a disruptive innovation
  • The impact on price: enduring reduction in margins
  • The Disruption of EU High Price Markets
  • Target: The Duopoly
  • Context: Sources of the Duo
  • M&A Execution
  • AT&T: A Devil’s Bargain with Apple
  • Verizon – network leadership as a strategy
  • Sprint – post-merger distractions
  • The Future: Limits to the Duo
  • PSTN phaseout and Universal Service Fund transition
  • Very simply…a price war
  • Sprint: The Agenda
  • Recovering from the loss of the Nextel business
  • Future of the network
  • Future of the core
  • The spectrum issue
  • Sprint: the soft-shoe spectrum shuffle
  • Softbank: another 2.5GHz vision
  • Options for disruptive change
  • Happy Pipe
  • Telco 2.0
  • Comms-Focused
  • Conclusions


…and the following figures…

  • Figure 1: iDisrupt – the June ‘08 iPhone launch reset the market in Japan
  • Figure 2: Softbank accepted a drift-down in margins as the price of subscriber acquisition
  • Figure 3: Softbank – keeping ahead of the competition
  • Figure 4: Spain is a high-price market
  • Figure 5: Markets with premium pricing are the first to go
  • Figure 6: AT&T and Verizon Wireless dominate US mobile revenues and margins
  • Figure 7: The duopolists pull away in terms of subscribers
  • Figure 8: The duopolists’ subscriber gain has come without sacrificing ARPU
  • Figure 9: The duopolists dig in through capital investment
  • Figure 10: OneNet sent Vodafone UK powering ahead in the SMB market
  • Figure 11: Softbank Japan’s spectrum plan
  • Figure 12: Softbank and the US Carriers’ Spectrum Holdings
  • Figure 13: Softbank is more than confident on EBIT
  • Figure 14: Softbank ARPU – An “increasing trend” for one player, but only just


Members of the Telco 2.0 Executive Briefing Subscription Service can download the full 23 page report in PDF format hereNon-Members, please subscribe here or email contact@telco2.net / call +44 (0) 207 247 5003.

LTE: APAC and US ‘Leading The Experience’

Summary: LTE is gaining traction in Asia Pacific and the US, despite challenges with spectrum, voice, and handsets. In South Korea, for example, penetration is expected to exceed 50% within 18 months. Our report on the lessons learned at the 2012 NGMN conference. (July 2012, Executive Briefing Service, Future of the Networks Stream).

LTE in Korea

  Read in Full (Members only)   To Subscribe click here

Below is an extract from this 14 page Telco 2.0 Report that can be downloaded in full in PDF format by members of the Telco 2.0 Executive Briefing service and Future Networks here. Non-members can subscribe here and for this and other enquiries, please email contact@telco2.net / call +44 (0) 207 247 5003.

We will be looking further at the role of LTE as an element of the strategic transformation of the telco industry at the invitation only Executive Brainstorms in Dubai (November 6-7, 2012), Singapore (4-5 December, 2012), Silicon Valley (19-20 March 2013), and London (23-24 April, 2013). Email contact@stlpartners.com or call +44 (0) 207 243 5003 to find out more.

To share this article easily, please click:


Taking the pulse of LTE

Introduction – NGMN 2012

In June, Telco 2.0 attended the main annual conference of NGMN in San Francisco. NGMN is the “Next Generation Mobile Network” alliance, the industry group tasked with defining the requirements for 4G networks and beyond. (It is then up to 3GPP and – historically at least – other standards bodies, to define the actual technologies which meet those requirements). Set up in 2006, it evaluated a number of candidate technologies, it eventually settled on LTE as its preferred “next-gen” technology, after a brief flirtation including WiMAX as well.

The conference was an interesting mix of American and Asian companies, operators (with quite a CTO-heavy representation), major vendors and some niche technology specialists. Coincidentally, the event also took place at the same time as Apple’s flagship annual developer conference at the Moscone Center across the road.

Although it was primarily about current LTE networks, quite a lot of the features that feature in the next stage, “LTE-Advanced” were discussed too, as well as updates on the roles of HSPA+ and WiFi. Some of the material was outside Telco 2.0’s normal beat (for example the innards of base station antennas), but there were also quite a lot of references to evolving broadband business models, APIs and the broader Internet value chain.

Key Take-Outs

In some countries, LTE adoption is happening very quickly – in fact, faster than expected. This is impressive, and a testament to the NGMN process and 3GPP getting the basic radio technology standards right. However, rollout and uptake is very patchy, especially outside the US, Korea and Japan. They are still problems around the fragmentation of suitable spectrum bands, expensive devices, supporting IT systems and the thorny issue of how to deal with voice. In addition, many operators’ capex budgets are being constrained by macroeconomic uncertainty. What also seems true is that LTE has not (yet) resulted in any substantive new telco business models, although there is clearly a lot of work behind the scenes on APIs and new pricing and data-bundling approaches.  

We are also impressed by the continued focus of the NGMN itself on further evolution of 4G+ networks, in resolving the outstanding technical issues (e.g. helping to drive towards multiband-capable devices, working on mobilised versions of adaptive video streaming), continuing the evolution to ever-better network speeds and efficiencies, and helping to minimise operators’ capex and opex through programmes such as SON (self-optimising networks).

ngmm: the engine of broadband wireless innovation

LTE adoption: accelerating – but patchy

One key conclusion from the event was the surprisingly rapid switch-over of users from 3G to 4G where it is available, especially with a decent range of handsets and aggressive marketing. In particular, US, South Korean and Japanese operators are leading the way. The US probably has the largest absolute number of subscribers – almost certainly more than 10m by the end of Q2 2012 (Verizon had 8m by end-Q1, with MetroPCS and AT&T also having launched). But in terms of penetration, it looks like South Korea is going to be the prize-winner. SKTelecom already has more than 3m subscribers, and is expecting 6m by the end of the year. More meaningfully, the various Korean presenters at the event seemed to agree the penetration of LTE could be as high as 50% of mobile users by the end of next year. NTT DoCoMo’s LTE service (branded Xi) is also accelerating rapidly, recently crossing the 3m user threshold, with a broad range of LTE smartphones coming out this summer, in an attempt to take the wind out of Softbank’s iPhone hegemony.

Figure 1: South Korea will have 30m LTE subs at end-2013, vs 49m population

LTE in Korea
Source: Samsung Electronics

This growth is not really being mirrored elsewhere, however. At the end of Q1, TeliaSonera had just 100k subscribers (mostly USB dongles) across a 7-country footprint of LTE networks, despite being the first to launch at the end of 2009. This probably reflects the fact that smartphones suitable for European frequency bands (and supporting voice) have been slow in arriving, something that should change rapidly from now onwards. It is also notable that TeliaSonera has attempted to position LTE as a premium, higher-priced option compared to 3G, while operators such as Verizon have really just used 4G as a marketing ploy, offering faster speeds as a counter to AT&T – and also perhaps to give Android devices an edge against the more expensive-to-subsidise iPhone.

Once European and Chinese markets really start to market LTE smartphones in anger (which will likely be around the 2012 Xmas season), we should see another ramp-up in demand – although that will partly be determined by whether the next iPhone (likely due around September-October) finally supports LTE or not.

To read the note in full, including the following sections detailing support for the analysis…

  • New business models, or more of the same?
  • Are the new models working?
  • Wholesale LTE
  • Other hurdles for LTE
  • Spectrum fragmentation blues
  • Handsets and spectrum
  • Roaming and spectrum
  • But what about voice and messaging?
  • HetNets & WiFi – part of “Next-gen networks” or not?
  • LTE Apps?
  • Conclusions

…and the following figures…

  • Figure 1: South Korea will have 30m LTE subs at end-2013, vs 49m population
  • Figure 2 – Juniper: exposing network APIs to apps
  • Figure 3 – Yota is wholesaling LTE capacity, while acting as a 2G/3G MVNO
  • Figure 4 – A compelling argument to replace old public-safety radios with LTE
  • Figure 5 – NTT DoCoMo made a colourful argument about LTE spectrum fragmentation

Members of the Telco 2.0 Executive Briefing Subscription Service and Future Networks Stream can download the full 14 page report in PDF format hereNon-Members, please subscribe here. For this or other enquiries, please email contact@telco2.net / call +44 (0) 207 247 5003.

Mobile Broadband 2.0: The Top Disruptive Innovations

Summary: Key trends, tactics, and technologies for mobile broadband networks and services that will influence mid-term revenue opportunities, cost structures and competitive threats. Includes consideration of LTE, network sharing, WiFi, next-gen IP (EPC), small cells, CDNs, policy control, business model enablers and more.(March 2012, Executive Briefing Service, Future of the Networks Stream).

Trends in European data usage

  Read in Full (Members only)  Buy a single user license online  To Subscribe click here

Below is an extract from this 44 page Telco 2.0 Report that can be downloaded in full in PDF format by members of the Telco 2.0 Executive Briefing service and Future Networks Stream here. Non-members can subscribe here, buy a Single User license for this report online here for £795 (+VAT for UK buyers), or for multi-user licenses or other enquiries, please email contact@telco2.net / call +44 (0) 207 247 5003. We’ll also be discussing our findings and more on Facebook at the Silicon Valley (27-28 March) and London (12-13 June) New Digital Economics Brainstorms.

To share this article easily, please click:


Introduction

Telco 2.0 has previously published a wide variety of documents and blog posts on mobile broadband topics – content delivery networks (CDNs), mobile CDNs, WiFi offloading, Public WiFi, network outsourcing (“‘Under-The-Floor’ (UTF) Players: threat or opportunity? ”) and so forth. Our conferences have featured speakers and panellists discussing operator data-plan pricing strategies, tablets, network policy and numerous other angles. We’ve also featured guest material such as Arete Research’s report LTE: Late, Tempting, and Elusive.

In our recent ‘Under the Floor (UTF) Players‘ Briefing we looked at strategies to deal with some of of the challenges facing operators’ resulting from market structure and outsourcing

Under The Floor (UTF) Players Telco 2.0

This Executive Briefing is intended to complement and extend those efforts, looking specifically at those technical and business trends which are truly “disruptive”, either immediately or in the medium-term future. In essence, the document can be thought of as a checklist for strategists – pointing out key technologies or trends around mobile broadband networks and services that will influence mid-term revenue opportunities and threats. Some of those checklist items are relatively well-known, others more obscure but nonetheless important. What this document doesn’t cover is more straightforward concepts around pricing, customer service, segmentation and so forth – all important to get right, but rarely disruptive in nature.

During 2012, Telco 2.0 will be rolling out a new MBB workshop concept, which will audit operators’ existing technology strategy and planning around mobile data services and infrastructure. This briefing document is a roundup of some of the critical issues we will be advising on, as well as our top-level thinking on the importance of each trend.

It starts by discussing some of the issues which determine the extent of any disruption:

  • Growth in mobile data usage – and whether the much-vaunted “tsunami” of traffic may be slowing down
  • The role of standardisation , and whether it is a facilitator or inhibitor of disruption
  • Whether the most important MBB disruptions are likely to be telco-driven, or will stem from other actors such as device suppliers, IT companies or Internet firms.

The report then drills into a few particular domains where technology is evolving, looking at some of the most interesting and far-reaching trends and innovations. These are split broadly between:

  • Network infrastructure evolution (radio and core)
  • Control and policy functions, and business-model enablers

It is not feasible for us to cover all these areas in huge depth in a briefing paper such as this. Some areas such as CDNs and LTE have already been subject to other Telco 2.0 analysis, and this will be linked to where appropriate. Instead, we have drilled down into certain aspects we feel are especially interesting, particularly where these are outside the mainstream of industry awareness and thinking – and tried to map technical evolution paths onto potential business model opportunities and threats.

This report cannot be truly exhaustive – it doesn’t look at the nitty-gritty of silicon components, or antenna design, for example. It also treads a fine line between technological accuracy and ease-of-understanding for the knowledgeable but business-focused reader. For more detail or clarification on any area, please get in touch with us – email mailto:contact@stlpartners.com or call +44 (0) 207 247 5003.

Telco-driven disruption vs. external trends

There are various potential sources of disruption for the mobile broadband marketplace:

  • New technologies and business models implemented by telcos, which increase revenues, decrease costs, improve performance or alter the competitive dynamics between service providers.
  • 3rd party developments that can either bolster or undermine the operators’ broadband strategies. This includes both direct MBB innovations (new uses of WiFi, for example), or bleed-over from adjacent related marketplaces such as device creation or content/application provision.
  • External, non-technology effects such as changing regulation, economic backdrop or consumer behaviour.

The majority of this report covers “official” telco-centric innovations – LTE networks, new forms of policy control and so on,

External disruptions to monitor

But the most dangerous form of innovation is that from third parties, which can undermine assumptions about the ways mobile broadband can be used, introducing new mechanisms for arbitrage, or somehow subvert operators’ pricing plans or network controls. 

In the voice communications world, there are often regulations in place to protect service providers – such as banning the use of “SIM boxes” to terminate calls and reduce interconnection payments. But in the data environment, it is far less obvious that many work-arounds can either be seen as illegal, or even outside the scope of fair-usage conditions. That said, we have already seen some attempts by telcos to manage these effects – such as charging extra for “tethering” on smartphones.

It is not really possible to predict all possible disruptions of this type – such is the nature of innovation. But by describing a few examples, market participants can gauge their level of awareness, as well as gain motivation for ongoing “scanning” of new developments.

Some of the areas being followed by Telco 2.0 include:

  • Connection-sharing. This is where users might link devices together locally, perhaps through WiFi or Bluetooth, and share multiple cellular data connections. This is essentially “multi-tethering” – for example, 3 smartphones discovering each other nearby, perhaps each with a different 3G/4G provider, and pooling their connections together for shared use. From the user’s point of view it could improve effective coverage and maximum/average throughput speed. But from the operators’ view it would break the link between user identity and subscription, and essentially offload traffic from poor-quality networks on to better ones.
  • SoftSIM or SIM-free wireless. Over the last five years, various attempts have been made to decouple mobile data connections from SIM-based authentication. In some ways this is not new – WiFi doesn’t need a SIM, while it’s optional for WiMAX, and CDMA devices have typically been “hard-coded” to just register on a specific operator network. But the GSM/UMTS/LTE world has always relied on subscriber identification through a physical card. At one level, it s very good – SIMs are distributed easily and have enabled a successful prepay ecosystem to evolve. They provide operator control points and the ability to host secure applications on the card itself. However, the need to obtain a physical card restricts business models, especially for transient/temporary use such as a “one day pass”. But the most dangerous potential change is a move to a “soft” SIM, embedded in the device software stack. Companies such as Apple have long dreamed of acting as a virtual network provider, brokering between user and multiple networks. There is even a patent for encouraging bidding per-call (or perhaps per data-connection) with telcos competing head to head on price/quality grounds. Telco 2.0 views this type of least-cost routing as a major potential risk for operators, especially for mobile data – although it also possible enables some new business models that have been difficult to achieve in the past.
  • Encryption. Various of the new business models and technology deployment intentions of operators, vendors and standards bodies are predicated on analysing data flows. Deep packet inspection (DPI) is expected to be used to identify applications or traffic types, enabling differential treatment in the network, or different charging models to be employed. Yet this is rendered largely useless (or at least severely limited) when various types of encryption are used. Various content and application types already secure data in this way – content DRM, BlackBerry traffic, corporate VPN connections and so on. But increasingly, we will see major Internet companies such as Apple, Google, Facebook and Microsoft using such techniques both for their own users’ security, but also because it hides precise indicators of usage from the network operators. If a future Android phone sends all its mobile data back via a VPN tunnel and breaks it out in Mountain View, California, operators will be unable to discern YouTube video from search of VoIP traffic. This is one of the reasons why application-based charging models – one- or two-sided – are difficult to implement.
  • Application evolution speed. One of the largest challenges for operators is the pace of change of mobile applications. The growing penetration of smartphones, appstores and ease of “viral” adoption of new services causes a fundamental problem – applications emerge and evolve on a month-by-month or even week-by-week basis. This is faster than any realistic internal telco processes for developing new pricing plans, or changing network policies. Worse, the nature of “applications” is itself changing, with the advent of HTML5 web-apps, and the ability to “mash up” multiple functions in one app “wrapper”. Is a YouTube video shared and embedded in a Facebook page a “video service”, or “social networking”?

It is also really important to recognise that certain procedures and technologies used in policy and traffic management will likely have some unanticipated side-effects. Users, devices and applications are likely to respond to controls that limit their actions, while other developments may result in “emergent behaviours” spontaneously. For instance, there is a risk that too-strict data caps might change usage models for smartphones and make users just connect to the network when absolutely necessary. This is likely to be at the same times and places when other users also feel it necessary, with the unfortunate implication that peaks of usage get “spikier” rather than being ironed-out.

There is no easy answer to addressing these type of external threats. Operator strategists and planners simply need to keep watch on emerging trends, and perhaps stress-test their assumptions and forecasts with market observers who keep tabs on such developments.

The mobile data explosion… or maybe not?

It is an undisputed fact that mobile data is growing exponentially around the world. Or is it?

A J-curve or an S-curve?

Telco 2.0 certainly thinks that growth in data usage is occurring, but is starting to see signs that the smooth curves that drive so many other decisions might not be so smooth – or so steep – after all. If this proves to be the case, it could be far more disruptive to operators and vendors than any of the individual technologies discussed later in the report. If operator strategists are not at least scenario-planning for lower data growth rates, they may find themselves in a very uncomfortable position in a year’s time.

In its most recent study of mobile operators’ traffic patterns, Ericsson concluded that Q2 2011 data growth was just 8% globally, quarter-on-quarter, a far cry from the 20%+ growths seen previously, and leaving a chart that looks distinctly like the beginning of an S-curve rather than a continued “hockey stick”. Given that the 8% includes a sizeable contribution from undoubted high-growth developing markets like China, it suggests that other markets are maturing quickly. (We are rather sceptical of Ericsson’s suggestion of seasonality in the data). Other data points come from O2 in the UK , which appears to have had essentially zero traffic growth for the past few quarters, or Vodafone which now cites European data traffic to be growing more slowly (19% year-on-year) than its data revenues (21%). Our view is that current global growth is c.60-70%, c.40% in mature markets and 100%+ in developing markets.

Figure 1 – Trends in European data usage

 Trends in European Data Usage
 

Now it is possible that various one-off factors are at play here – the shift from unlimited to tiered pricing plans, the stronger enforcement of “fair-use” plans and the removal of particularly egregious heavy users. Certainly, other operators are still reporting strong growth in traffic levels. We may see resumption in growth, for example if cellular-connected tablets start to be used widely for streaming video. 

But we should also consider the potential market disruption, if the picture is less straightforward than the famous exponential charts. Even if the chart looks like a 2-stage S, or a “kinked” exponential, the gap may have implications, like a short recession in the economy. Many of the technical and business model innovations in recent years have been responses to the expected continual upward spiral of demand – either controlling users’ access to network resources, pricing it more highly and with greater granularity, or building out extra capacity at a lower price. Even leaving aside the fact that raw, aggregated “traffic” levels are a poor indicator of cost or congestion, any interruption or slow-down of the growth will invalidate a lot of assumptions and plans.

Our view is that the scary forecasts of “explosions” and “tsunamis” have led virtually all parts of the industry to create solutions to the problem. We can probably list more than 20 approaches, most of them standalone “silos”.

Figure 2 – A plethora of mobile data traffic management solutions

A Plethora of Mobile Data Traffic Management Solutions

What seems to have happened is that at least 10 of those approaches have worked – caps/tiers, video optimisation, WiFi offload, network densification and optimisation, collaboration with application firms to create “network-friendly” software and so forth. Taken collectively, there is actually a risk that they have worked “too well”, to the extent that some previous forecasts have turned into “self-denying prophesies”.

There is also another common forecasting problem occurring – the assumption that later adopters of a technology will have similar behaviour to earlier users. In many markets we are now reaching 30-50% smartphone penetration. That means that all the most enthusiastic users are already connected, and we’re left with those that are (largely) ambivalent and probably quite light users of data. That will bring the averages down, even if each individual user is still increasing their consumption over time. But even that assumption may be flawed, as caps have made people concentrate much more on their usage, offloading to WiFi and restricting their data flows. There is also some evidence that the growing numbers of free WiFi points is also reducing laptop use of mobile data, which accounts for 70-80% of the total in some markets, while the much-hyped shift to tablets isn’t driving much extra mobile data as most are WiFi-only.

So has the industry over-reacted to the threat of a “capacity crunch”? What might be the implications?

The problem is that focusing on a single, narrow metric “GB of data across the network” ignores some important nuances and finer detail. From an economics standpoint, network costs tend to be driven by two main criteria:

  • Network coverage in terms of area or population
  • Network capacity at the busiest places/times

Coverage is (generally) therefore driven by factors other than data traffic volumes. Many cells have to be built and run anyway, irrespective of whether there’s actually much load – the operators all want to claim good footprints and may be subject to regulatory rollout requirements. Peak capacity in the most popular locations, however, is a different matter. That is where issues such as spectrum availability, cell site locations and the latest high-speed networks become much more important – and hence costs do indeed rise. However, it is far from obvious that the problems at those “busy hours” are always caused by “data hogs” rather than sheer numbers of people each using a small amount of data. (There is also another issue around signalling traffic, discussed later). 

Yes, there is a generally positive correlation between network-wide volume growth and costs, but it is far from perfect, and certainly not a direct causal relationship.

So let’s hypothesise briefly about what might occur if data traffic growth does tail off, at least in mature markets.

  • Delays to LTE rollout – if 3G networks are filling up less quickly than expected, the urgency of 4G deployment is reduced.
  • The focus of policy and pricing for mobile data may switch back to encouraging use rather than discouraging/controlling it. Capacity utilisation may become an important metric, given the high fixed costs and low marginal ones. Expect more loyalty-type schemes, plus various methods to drive more usage in quiet cells or off-peak times.
  • Regulators may start to take different views of traffic management or predicted spectrum requirements.
  • Prices for mobile data might start to fall again, after a period where we have seen them rise. Some operators might be tempted back to unlimited plans, for example if they offer “unlimited off-peak” or similar options.
  • Many of the more complex and commercially-risky approaches to tariffing mobile data might be deprioritised. For example, application-specific pricing involving packet-inspection and filtering might get pushed back down the agenda.
  • In some cases, we may even end up with overcapacity on cellular data networks – not to the degree we saw in fibre in 2001-2004, but there might still be an “overhang” in some places, especially if there are multiple 4G networks.
  • Steady growth of (say) 20-30% peak data per annum should be manageable with the current trends in price/performance improvement. It should be possible to deploy and run networks to meet that demand with reducing unit “production cost”, for example through use of small cells. That may reduce the pressure to fill the “revenue gap” on the infamous scissors-diagram chart.

Overall, it is still a little too early to declare shifting growth patterns for mobile data as a “disruption”. There is a lack of clarity on what is happening, especially in terms of responses to the new controls, pricing and management technologies put recently in place. But operators need to watch extremely closely what is going on – and plan for multiple scenarios.

Specific recommendations will depend on an individual operator’s circumstances – user base, market maturity, spectrum assets, competition and so on. But broadly, we see three scenarios and implications for operators:

  • “All hands on deck!”: Continued strong growth (perhaps with a small “blip”) which maintains the pressure on networks, threatens congestion, and drives the need for additional capacity, spectrum and capex.
    • Operators should continue with current multiple strategies for dealing with data traffic – acquiring new spectrum, upgrading backhaul, exploring massive capacity enhancement with small cells and examining a variety of offload and optimisation techniques. Where possible, they should explore two-sided models for charging and use advanced pricing, policy or segmentation techniques to rein in abusers and reward those customers and applications that are parsimonious with their data use. Vigorous lobbying activities will be needed, for gaining more spectrum, relaxing Net Neutrality rules and perhaps “taxing” content/Internet companies for traffic injected onto networks.
  • “Panic over”: Moderating and patchy growth, which settles to a manageable rate – comparable with the patterns seen in the fixed broadband marketplace
    • This will mean that operators can “relax” a little, with the respite in explosive growth meaning that the continued capex cycles should be more modest and predictable. Extension of today’s pricing and segmentation strategies should improve margins, with continued innovation in business models able to proceed without rush, and without risking confrontation with Internet/content companies over traffic management techniques. Focus can shift towards monetising customer insight, ensuring that LTE rollouts are strategic rather than tactical, and exploring new content and communications services that exploit the improving capabilities of the network.
  • “Hangover”: Growth flattens off rapidly, leaving operators with unused capacity and threatening brutal price competition between telcos.
    • This scenario could prove painful, reminiscent of early-2000s experience in the fixed-broadband marketplace. Wholesale business models could help generate incremental traffic and revenue, while the emphasis will be on fixed-cost minimisation. Some operators will scale back 4G rollouts until cost and maturity go past the tipping-point for outright replacement of 3G. Restrictive policies on bandwidth use will be lifted, as operators compete to give customers the fastest / most-open access to the Internet on mobile devices. Consolidation – and perhaps bankruptcies – may ensure as declining data prices may coincide with substitution of core voice and messaging business

To read the note in full, including the following analysis…

  • Introduction
  • Telco-driven disruption vs. external trends
  • External disruptions to monitor
  • The mobile data explosion… or maybe not?
  • A J-curve or an S-curve?
  • Evolving the mobile network
  • Overview
  • LTE
  • Network sharing, wholesale and outsourcing
  • WiFi
  • Next-gen IP core networks (EPC)
  • Femtocells / small cells / “cloud RANs”
  • HetNets
  • Advanced offload: LIPA, SIPTO & others
  • Peer-to-peer connectivity
  • Self optimising networks (SON)
  • M2M-specific broadband innovations
  • Policy, control & business model enablers
  • The internal politics of mobile broadband & policy
  • Two sided business-model enablement
  • Congestion exposure
  • Mobile video networking and CDNs
  • Controlling signalling traffic
  • Device intelligence
  • Analytics & QoE awareness
  • Conclusions & recommendations
  • Index

…and the following figures…

  • Figure 1 – Trends in European data usage
  • Figure 2 – A plethora of mobile data traffic management solutions
  • Figure 3 – Not all operator WiFi is “offload” – other use cases include “onload”
  • Figure 4 – Internal ‘power tensions’ over managing mobile broadband
  • Figure 5 – How a congestion API could work
  • Figure 6 – Relative Maturity of MBB Management Solutions
  • Figure 7 – Laptops generate traffic volume, smartphones create signalling load
  • Figure 8 – Measuring Quality of Experience
  • Figure 9 – Summary of disruptive network innovations

Members of the Telco 2.0 Executive Briefing Subscription Service and Future Networks Stream can download the full 44 page report in PDF format hereNon-Members, please subscribe here, buy a Single User license for this report online here for £795 (+VAT for UK buyers), or for multi-user licenses or other enquiries, please email contact@telco2.net / call +44 (0) 207 247 5003.

Organisations, geographies, people and products referenced: 3GPP, Aero2, Alcatel Lucent, AllJoyn, ALU, Amazon, Amdocs, Android, Apple, AT&T, ATIS, BBC, BlackBerry, Bridgewater, CarrierIQ, China, China Mobile, China Unicom, Clearwire, Conex, DoCoMo, Ericsson, Europe, EverythingEverywhere, Facebook, Femto Forum, FlashLinq, Free, Germany, Google, GSMA, H3G, Huawei, IETF, IMEI, IMSI, InterDigital, iPhones,Kenya, Kindle, Light Radio, LightSquared, Los Angeles, MBNL, Microsoft, Mobily, Netflix, NGMN, Norway, NSN, O2, WiFi, Openet, Qualcomm, Radisys, Russia, Saudi Arabia, SoftBank, Sony, Stoke, Telefonica, Telenor, Time Warner Cable, T-Mobile, UK, US, Verizon, Vita, Vodafone, WhatsApp, Yota, YouTube, ZTE.

Technologies and industry terms referenced: 2G, 3G, 4.5G, 4G, Adaptive bitrate streaming, ANDSF (Access Network Discovery and Selection Function), API, backhaul, Bluetooth, BSS, capacity crunch, capex, caps/tiers, CDMA, CDN, CDNs, Cloud RAN, content delivery networks (CDNs), Continuous Computing, Deep packet inspection (DPI), DPI, DRM, Encryption, Enhanced video, EPC, ePDG (Evolved Packet Data Gateway), Evolved Packet System, Femtocells, GGSN, GPS, GSM, Heterogeneous Network (HetNet), Heterogeneous Networks (HetNets), HLRs, hotspots, HSPA, HSS (Home Subscriber Server), HTML5, HTTP Live Streaming, IFOM (IP Flow Mobility and Seamless Offload), IMS, IPR, IPv4, IPv6, LIPA (Local IP Access), LTE, M2M, M2M network enhancements, metro-cells, MiFi, MIMO (multiple in, MME (Mobility Management Entity), mobile CDNs, mobile data, MOSAP, MSISDN, MVNAs (mobile virtual network aggregators)., MVNO, Net Neutrality, network outsourcing, Network sharing, Next-generation core networks, NFC, NodeBs, offload, OSS, outsourcing, P2P, Peer-to-peer connectivity, PGW (PDN Gateway), picocells, policy, Policy and Charging Rules Function (PCRF), Pre-cached video, pricing, Proximity networks, Public WiFi, QoE, QoS, RAN optimisation, RCS, remote radio heads, RFID, self-optimising network technology (SON), Self-optimising networks (SON), SGW (Serving Gateway), SIM-free wireless, single RANs, SIPTO (Selective IP Traffic Offload), SMS, SoftSIM, spectrum, super-femtos, Telco 2.0 Happy Pipe, Transparent optimisation, UMTS, ‘Under-The-Floor’ (UTF) Players, video optimisation, VoIP, VoLTE, VPN, White space, WiFi, WiFi Direct, WiFi offloading, WiMAX, WLAN.

‘Under-The-Floor’ (UTF) Players: threat or opportunity?

Introduction

The ‘smart pipe’ imperative

In some quarters of the telecoms industry, the received wisdom is that the network itself is merely an undifferentiated “pipe”, providing commodity connectivity, especially for data services. The value, many assert, is in providing higher-tier services, content and applications, either to end-users, or as value-added B2B services to other parties. The Telco 2.0 view is subtly different. We maintain that:

  1. Increasingly valuable services will be provided by third-parties but that operators can provide a few end-user services themselves. They will, for example, continue to offer voice and messaging services for the foreseeable future.
  2. Operators still have an opportunity to offer enabling services to ‘upstream’ service providers such as personalisation and targeting (of marketing and services) via use of their customer data, payments, identity and authentication and customer care.
  3. Even if operators fail (or choose not to pursue) options 1 and 2 above, the network must be ‘smart’ and all operators will pursue at least a ‘smart network’ or ‘Happy Pipe’ strategy. This will enable operators to achieve three things.
  • To ensure that data is transported efficiently so that capital and operating costs are minimised and the Internet and other networks remain cheap methods of distribution.
  • To improve user experience by matching the performance of the network to the nature of the application or service being used – or indeed vice versa, adapting the application to the actual constraints of the network. ‘Best efforts’ is fine for asynchronous communication, such as email or text, but unacceptable for traditional voice telephony. A video call or streamed movie could exploit guaranteed bandwidth if possible / available, or else they could self-optimise to conditions of network congestion or poor coverage, if well-understood. Other services have different criteria – for example, real-time gaming demands ultra-low latency, while corporate applications may demand the most secure and reliable path through the network.
  • To charge appropriately for access to and/or use of the network. It is becoming increasingly clear that the Telco 1.0 business model – that of charging the end-user per minute or per Megabyte – is under pressure as new business models for the distribution of content and transportation of data are being developed. Operators will need to be capable of charging different players – end-users, service providers, third-parties (such as advertisers) – on a real-time basis for provision of broadband and maybe various types or tiers of quality of service (QoS). They may also need to offer SLAs (service level agreements), monitor and report actual “as-experienced” quality metrics or expose information about network congestion and availability.

Under the floor players threaten control (and smartness)

Either through deliberate actions such as outsourcing, or through external agency (Government, greenfield competition etc), we see the network-part of the telco universe suffering from a creeping loss of control and ownership. There is a steady move towards outsourced networks, as they are shared, or built around the concept of open-access and wholesale. While this would be fine if the telcos themselves remained in control of this trend (we see significant opportunities in wholesale and infrastructure services), in many cases the opposite is occurring. Telcos are losing control, and in our view losing influence over their core asset – the network. They are worrying so much about competing with so-called OTT providers that they are missing the threat from below.

At the point at which many operators, at least in Europe and North America, are seeing the services opportunity ebb away, and ever-greater dependency on new models of data connectivity provision, they are potentially cutting off (or being cut off from) one of their real differentiators.
Given the uncertainties around both fixed and mobile broadband business models, it is sensible for operators to retain as many business model options as possible. Operators are battling with significant commercial and technical questions such as:

  • Can upstream monetisation really work?
  • Will regulators permit priority services under Net Neutrality regulations?
  • What forms of network policy and traffic management are practical, realistic and responsive?

Answers to these and other questions remain opaque. However, it is clear that many of the potential future business models will require networks to be physically or logically re-engineered, as well as flexible back-office functions, like billing and OSS, to be closely integrated with the network.
Outsourcing networks to third-party vendors, particularly when such a network is shared with other operators is dangerous in these circumstances. Partners that today agree on the principles for network-sharing may have very different strategic views and goals in two years’ time, especially given the unknown use-cases for new technologies like LTE.

This report considers all these issues and gives guidance to operators who may not have considered all the various ways in which network control is being eroded, from Government-run networks through to outsourcing services from the larger equipment providers.

Figure 1 – Competition in the services layer means defending network capabilities is increasingly important for operators Under The Floor Players Fig 1 Defending Network Capabilities

Source: STL Partners

Industry structure is being reshaped

Over the last year, Telco 2.0 has updated its overall map of the telecom industry, to reflect ongoing dynamics seen in both fixed and mobile arenas. In our strategic research reports on Broadband Business Models, and the Roadmap for Telco 2.0 Operators, we have explored the emergence of various new “buckets” of opportunity, such as verticalised service offerings, two-sided opportunities and enhanced variants of traditional retail propositions.
In parallel to this, we’ve also looked again at some changes in the traditional wholesale and infrastructure layers of the telecoms industry. Historically, this has largely comprised basic capacity resale and some “behind the scenes” use of carriers-carrier services (roaming hubs, satellite / sub-oceanic transit etc).

Figure 2 – Telco 1.0 Wholesale & Infrastructure structure

Under The Floor (UTF) Players Fig 2 Telco 1.0 Scenario

Source: STL Partners

Content

  • Revising & extending the industry map
  • ‘Network Infrastructure Services’ or UTF?
  • UTF market drivers
  • Implications of the growing trend in ‘under-the-floor’ network service providers
  • Networks must be smart and controlling them is smart too
  • No such thing as a dumb network
  • Controlling the network will remain a key competitive advantage
  • UTF enablers: LTE, WiFi & carrier ethernet
  • UTF players could reduce network flexibility and control for operators
  • The dangers of ceding control to third-parties
  • No single answer for all operators but ‘outsourcer beware’
  • Network outsourcing & the changing face of major vendors
  • Why become an under-the-floor player?
  • Categorising under-the-floor services
  • Pure under-the-floor: the outsourced network
  • Under-the-floor ‘lite’: bilateral or multilateral network-sharing
  • Selective under-the-floor: Commercial open-access/wholesale networks
  • Mandated under-the-floor: Government networks
  • Summary categorisation of under-the-floor services
  • Next steps for operators
  • Build scale and a more sophisticated partnership approach
  • Final thoughts
  • Index


  • Figure 1 – Competition in the services layer means defending network capabilities is increasingly important for operators
  • Figure 2 – Telco 1.0 Wholesale & Infrastructure structure
  • Figure 3 – The battle over infrastructure services is intensifying
  • Figure 4 – Examples of network-sharing arrangements
  • Figure 5 – Examples of Government-run/influenced networks
  • Figure 6 – Four under-the-floor service categories
  • Figure 7: The need for operator collaboration & co-opetition strategies

LTE: Less Transforming than Expected

This is an extract from a report by Arete Research, a Telco 2.0TM partner specalising in investment analysis. The views in this article are not intended to constitute investment advice from Telco 2.0TM or STL Partners. We are reprinting Arete’s analysis to give our customers some additional insight into how some investors see the Telecoms market.

This report can be downloaded in full in PDF format by members of the Telco 2.0 Executive Briefing service and Future Networks Stream using the links below.

                            Read in Full (Members only)        To Subscribe

Please use the links or email contact@telco2.net or call +44 (0) 207 247 5003 to find out more.

To share this article easily, please click:


A New IPR Cold War Begins

Everyone in the technology industry loves “next gen” products: they solve all the problems of the previous iteration! In LTE: Late, Tempting, and Elusive in June ’09, we [Arete Research] forecast delays and said LTE would require intensive R&D and bring minimal near-term sales. Two years later, its impact is limited, mostly driven by market-specific reasons.  Now we see operators adopting LTE by moving to single RAN (radio access network) platforms, giving them a choice of how to use spectrum, and sparking de facto concentration of vendor market shares. 

The “single RAN” (including LTE) is another example of deflation in wireless infrastructure; peak shipments of HSPA may be five years off, but now come with LTE.  Collapsing networks onto single platforms (so-called “network modernisation”) prepares operators to re-farm spectrum, even if short-term spend goes up.  The vendor market is consolidating around Ericsson and Huawei (both financially stable), with ZTE and Samsung as new entrants, and ALU, NSN and NEC struggling to make profits (see Fig. 1) while “pioneering” new concepts. All vendors see LTE as their chance to gain share, a dangerous phase.  LTE also threatens to add costs in ’12 as networks need optimisation. A recent LTE Asia conference reinforced our three previous meanings for this nascent technology:

Still Late.  In ’09 we said “Late is Great,” with no business case for aggressive deployment.  Most operators are in “commercial trials”, awaiting firmer spectrum allocations, if not also devices.  LTE rollouts have been admirably measured in all but a few markets, and where accelerated, mostly done for market-specific reasons.

Less Tempting?  Operators are re-setting pricing and ending unlimited plans. LTE’s better spectral efficiency requires much higher device penetration.  Operators are gradually deploying LTE as part of a evolution to single RAN networks (allowing re-farming), but few talk of “enabling new business models” beyond 3G technology.

Elusive Economics.  As a new air interface, LTE needs work in spectrum, standards and handsets. Device makers are cagey about ramping LTE volumes at mid-range price points.  Vendors are still testing new concepts to lower costs in dense urban areas.  Network economics (of any G) are driven by single RAN rollouts, often by low-cost vendors.

Transformation Hardly Happens.  For all the US 4G hype, LTE is continuing a decade-old “revolution” in mobile data (DoCoMo launched 3G in ’01), boosted by smartphones since ’07.  LTE or not, operators struggle to add value beyond connectivity.  Investors should reward operators that reach the lowest long-term cash costs, even with upfront capex.

No Help to Vendor Margins.  Despite 175 “commitments” to launch LTE, single RANs will be no bonanza, inviting fresh attempts to “buy” share. In a market we see growing ~5-10% in ’12.  Ericsson and Huawei are the only vendors now generating returns above their capital costs: LTE will not make this better, while vendors like NSN and ALU must fend off aggressive new entrants like ZTE pricing low to win swaps deals.

Figure 1: Vendor “Pro-Forma” Margins ’07-’12E: Only Two Make Likely Cost of Capital

Arete Research Estimated Returns by Network Equipment Vendor 2011

To read the Briefing in full, including in addition to the above analysis of:

  • Operators: Better Late than Early!
  • Something New Here?
  • Standards/Spectrum: Much to Do
  • Vendors: Challenges ‘Aplenty
  • … Not Enough Profits for All
  • Devices: All to Come
  • Transformation… Not!

…and the following charts and tables…

  • Figure 1: Vendor “Pro-Forma” Margins ’07-’12E: Only Two Make Likely Cost of Capital
  • Figure 2: Verizon LTE Just in the Dots
  • Figure 3: Terminals Needed to Make LTE Work
  • Figure 4: “Scissor Effect” Facing Operators
  • Figure 5: Every Bit of the Air: Potential Spectrum to Be Used for LTE
  • Figure 6: Vendor Scale on ’11 Sales: Clear Gaps

Members of the Telco 2.0TM Executive Briefing Subscription Service and Future Networks Stream can download the full 7 page report in PDF format here. Non-Members, please see here for how to subscribe. Please email contact@telco2.net or call +44 (0) 207 247 5003 for further details.

Broadband 2.0: Mobile CDNs and video distribution

Summary: Content Delivery Networks (CDNs) are becoming familiar in the fixed broadband world as a means to improve the experience and reduce the costs of delivering bulky data like online video to end-users. Is there now a compelling need for their mobile equivalents, and if so, should operators partner with existing players or build / buy their own? (August 2011, Executive Briefing Service, Future of the Networks Stream).
Telco 2.0 Mobile CDN Schematic Small
  Read in Full (Members only)    Buy This Report    To Subscribe

Below is an extract from this 25 page Telco 2.0 Report that can be downloaded in full in PDF format by members of the Telco 2.0 Executive Briefing service and Future Networks Stream here. Non-members can buy a Single User license for this report online here for £595 (+VAT) or subscribe here. For multiple user licenses, or to find out about interactive strategy workshops on this topic, please email contact@telco2.net or call +44 (0) 207 247 5003.

To share this article easily, please click:

//

Introduction

As is widely documented, mobile networks are witnessing huge growth in the volumes of 3G/4G data traffic, primarily from laptops, smartphones and tablets. While Telco 2.0 is wary of some of the headline shock-statistics about forecast “exponential” growth, or “data tsunamis” driven by ravenous consumption of video applications, there is certainly a fast-growing appetite for use of mobile broadband.

That said, many of the actual problems of congestion today can be pinpointed either to a handful of busy cells at peak hour – or, often, the inability of the network to deal with the signalling load from chatty applications or “aggressive” devices, rather than the “tonnage” of traffic. Another large trend in mobile data is the use of transient, individual-centric flows from specific apps or communications tools such as social networking and messaging.

But “tonnage” is not completely irrelevant. Despite the diversity, there is still an inexorable rise in the use of mobile devices for “big chunks” of data, especially the special class of software commonly known as “content” – typically popular/curated standalone video clips or programmes, or streamed music. Images (especially those in web pages) and application files such as software updates fit into a similar group – sizeable lumps of data downloaded by many individuals across the operator’s network.

This one-to-many nature of most types of bulk content highlights inefficiencies in the way mobile networks operate. The same data chunks are downloaded time and again by users, typically going all the way from the public Internet, through the operator’s core network, eventually to the end user. Everyone loses in this scenario – the content publisher needs huge servers to dish up each download individually. The operator has to deal with transport and backhaul load from repeatedly sending the same content across its network (and IP transit from shipping it in from outside, especially over international links). Finally, the user has to deal with all the unpredictability and performance compromises involved in accessing the traffic across multiple intervening points – and ends up paying extra to support the operator’s heavier cost base.

In the fixed broadband world, many content companies have availed themselves of a group of specialist intermediaries called CDNs (content delivery networks). These firms on-board large volumes of the most important content served across the Internet, before dropping it “locally” as near to the end user as possible – if possible, served up from cached (pre-saved) copies. Often, the CDN operating companies have struck deals with the end-user facing ISPs, which have often been keen to host their servers in-house, as they have been able to reduce their IP interconnection costs and deliver better user experience to their customers.

In the mobile industry, the use of CDNs is much less mature. Until relatively recently, the overall volumes of data didn’t really move the needle from the point of view of content firms, while operators’ radio-centric cost bases were also relatively immune from those issues as well. Optimising the “middle mile” for mobile data transport efficiency seemed far less of a concern than getting networks built out and handsets and apps perfected, or setting up policy and charging systems to parcel up broadband into tiered plans. Arguably, better-flowing data paths and video streams would only load the radio more heavily, just at a time when operators were having to compress video to limit congestion.

This is now changing significantly. With the rise in smartphone usage – and the expectations around tablets – Internet-based CDNs are pushing much more heavily to have their servers placed inside mobile networks. This is leading to a certain amount of introspection among the operators – do they really want to have Internet companies’ infrastructure inside their own networks, or could this be seen more as a Trojan Horse of some sort, simply accelerating the shift of content sales and delivery towards OTT-style models? Might it not be easier for operators to build internal CDN-type functions instead?

Some of the earlier approaches to video traffic management – especially so-called “optimisation” without the content companies’ permission of involvement – are becoming trickier with new video formats and more scrutiny from a Net Neutrality standpoint. But CDNs by definition involve the publishers, so potentially any necessary compression or other processing can be collaboratively, rather than “transparently” without cooperation or willingness.

At the same time, many of the operators’ usual vendors are seeing this transition point as a chance to differentiate their new IP core network offerings, typically combining CDN capability into their routing/switching platforms, often alongside the optimisation functions as well. In common with other recent innovations from network equipment suppliers, there is a dangled promise of Telco 2.0-style revenues that could be derived from “upstream” players. In this case, there is a bit more easily-proved potential, since this would involve direct substitution of the existing revenues already derived from content companies, by the Internet CDN players such as Akamai and Limelight. This also holds the possibility of setting up a two-sided, content-charging business model that fits OK with rules on Net Neutrality – there are few complaints about existing CDNs except from ultra-purist Neutralists.

On the other hand, telco-owned CDNs have existed in the fixed broadband world for some time, with largely indifferent levels of success and adoption. There needs to be a very good reason for content companies to choose to deal with multiple national telcos, rather than simply take the easy route and choose a single global CDN provider.

So, the big question for telcos around CDNs at the moment is “should I build my own, or should I just permit Akamai and others to continue deploying servers into my network?” Linked to that question is what type of CDN operation an operator might choose to run in-house.

There are four main reasons why a mobile operator might want to build its own CDN:

  • To lower costs of network operation or upgrade, especially in radio network and backhaul, but also through the core and in IP transit.
  • To improve the user experience of video, web or applications, either in terms of data throughput or latency.
  • To derive incremental revenue from content or application providers.
  • For wider strategic or philosophical reasons about “keeping control over the content/apps value chain”

This Analyst Note explores these issues in more details, first giving some relevant contextual information on how CDNs work, especially in mobile.

What is a CDN?

The traditional model for Internet-based content access is straightforward – the user’s browser requests a piece of data (image, video, file or whatever) from a server, which then sends it back across the network, via a series of “hops” between different network nodes. The content typically crosses the boundaries between multiple service providers’ domains, before finally arriving at the user’s access provider’s network, flowing down over the fixed or mobile “last mile” to their device. In a mobile network, that also typically involves transiting the operator’s core network first, which has a variety of infrastructure (network elements) to control and charge for it.

A Content Delivery Network (CDN) is a system for serving Internet content from servers which are located “closer” to the end user either physically, or in terms of the network topology (number of hops). This can result in faster response times, higher overall performance, and potentially lower costs to all concerned.

In most cases in the past, CDNs have been run by specialist third-party providers, such as Akamai and Limelight. This document also considers the role of telcos running their own “on-net” CDNs.

CDNs can be thought of as analogous to the distribution of bulky physical goods – it would be inefficient for a manufacturer to ship all products to customers individually from a single huge central warehouse. Instead, it will set up regional logistics centres that can be more responsive – and, if appropriate, tailor the products or packaging to the needs of specific local markets.

As an example, there might be a million requests for a particular video stream from the BBC. Without using a CDN, the BBC would have to provide sufficient server capacity and bandwidth to handle them all. The company’s immediate downstream ISPs would have to carry this traffic to the Internet backbone, the backbone itself has to carry it, and finally the requesters’ ISPs’ access networks have to deliver it to the end-points. From a media-industry viewpoint, the source network (in this case the BBC) is generally called the “content network” or “hosting network”; the destination is termed an “eyeball network”.

In a CDN scenario, all the data for the video stream has to be transferred across the Internet just once for each participating network, when it is deployed to the downstream CDN servers and stored. After this point, it is only carried over the user-facing eyeball networks, not any others via the public Internet. This also means that the CDN servers may be located strategically within the eyeball networks, in order to use its resources more efficiently. For example, the eyeball network could place the CDN server on the downstream side of its most expensive link, so as to avoid carrying the video over it multiple times. In a mobile context, CDN servers could be used to avoid pushing large volumes of data through expensive core-network nodes repeatedly.

When the video or other content is loaded into the CDN, other optimisations such as compression or transcoding into other formats can be applied if desired. There may also be various treatments relating to new forms of delivery such as HTTP streaming, where the video is broken up into “chunks” with several different sizes/resolutions. Collectively, these upfront processes are called “ingestion”.

Figure 1 – Content delivery with and without a CDN

Mobile CDN Schematic, Fig 1 Telco 2.0 Report

Source: STL Partners / Telco 2.0

Value-added CDN services

It is important to recognise that the fixed-centric CDN business has increased massively in richness and competition over time. Although some of the players have very clever architectures and IPR in the forms of their algorithms and software techniques, the flexibility of modern IP networks has tended to erode away some of the early advantages and margins. Shipping large volumes of content is now starting to become secondary to the provision of associated value-added functions and capabilities around that data. Additional services include:

  • Analytics and reporting
  • Advert insertion
  • Content ingestion and management
  • Application acceleration
  • Website security management
  • Software delivery
  • Consulting and professional services

It is no coincidence that the market leader, Akamai, now refers to itself as “provider of cloud optimisation services” in its financial statements, rather than a CDN, with its business being driven by “trends in cloud computing, Internet security, mobile connectivity, and the proliferation of online video”. In particular, it has started refocusing away from dealing with “video tonnage”, and towards application acceleration – for example, speeding up the load times of e-commerce sites, which has a measurable impact on abandonment of purchasing visits. Akamai’s total revenues in 2010 were around $1bn, less than half of which came from “media and entertainment” – the traditional “content industries”. Its H1 2011 revenues were relatively disappointing, with growth coming from non-traditional markets such as enterprise and high-tech (eg software update delivery) rather than media.

This is a critically important consideration for operators that are looking to CDNs to provide them with sizeable uplifts in revenue from upstream customers. Telcos – especially in mobile – will need to invest in various additional capabilities as well as the “headline” video traffic management aspects of the system. They will need to optimise for network latency as well as throughput, for example – which will probably not have the cost-saving impacts expected from managing “data tonnage” more effectively.

Although in theory telcos’ other assets should help – for example mapping download analytics to more generalised customer data – this is likely to involve extra complexity with the IT side of the business. There will also be additional efforts around sales and marketing that go significantly beyond most mobile operators’ normal footprint into B2B business areas. There is also a risk that an analysis of bottlenecks for application delivery / acceleration ends up simply pointing the finger of blame at the network’s inadequacies in terms of coverage. Improving delivery speed, cost or latency is only valuable to an upstream customer if there is a reasonable likelihood of the end-user actually having connectivity in the first place.

Figure 2: Value-added CDN capabilities

Mobile CDN Schematic - Functionality Chart - Telco 2.0 Report

Source: Alcatel-Lucent

Application acceleration

An increasingly important aspect of CDNs is their move beyond content/media distribution into a much wider area of “acceleration” and “cloud enablement”. As well as delivering large pieces of data efficiently (e.g. video), there is arguably more tangible value in delivering small pieces of data fast.

There are various manifestations of this, but a couple of good examples illustrate the general principles:

  • Many web transactions are abandoned because websites (or apps) seem “slow”. Few people would trust an airline’s e-commerce site, or a bank’s online interface, if they’ve had to wait impatiently for images and page elements to load, perhaps repeatedly hitting “refresh” on their browsers. Abandoned transactions can be directly linked to slow or unreliable response times – typically a function of congestion either at the server or various mid-way points in the connection. CDN-style hosting can accelerate the service measurably, leading to increased customer satisfaction and lower levels of abandonment.
  • Enterprise adoption of cloud computing is becoming exceptionally important, with both cost savings and performance enhancements promised by vendors. Sometimes, such platforms will involve hybrid clouds – a mixture of private (Internal) and public (Internet) resources and connectivity. Where corporates are reliant on public Internet connectivity, they may well want to ensure as fast and reliable service as possible, especially in terms of round-trip latency. Many IT applications are designed to be run on ultra-fast company private networks, with a lot of “hand-shaking” between the user’s PC and the server. This process is very latency-dependent, and especially as companies also mobilise their applications the additional overhead time in cellular networks may otherwise cause significant problems.

Hosting applications at CDN-type cloud acceleration providers achieves much the same effect as for video – they can bring the application “closer”, with fewer hops between the origin server and the consumer. Additionally, the CDN is well-placed to offer additional value-adds such as firewalling and protection against denial-of-service attacks.

To read the 25 note in full, including the following additional content…

  • How do CDNs fit with mobile networks?
  • Internet CDNs vs. operator CDNs
  • Why use an operator CDN?
  • Should delivery mean delivery?
  • Lessons from fixed operator CDNs
  • Mobile video: CDNs, offload & optimisation
  • CDNs, optimisation, proxies and DPI
  • The role of OVPs
  • Implementation and planning issues
  • Conclusion & recommendations

… and the following additional charts…

  • Figure 3 – Potential locations for CDN caches and nodes
  • Figure 4 – Distributed on-net CDNs can offer significant data transport savings
  • Figure 5 – The role of OVPs for different types of CDN player
  • Figure 6 – Summary of Risk / Benefits of Centralised vs. Distributed and ‘Off Net’ vs. ‘On-Net’ CDN Strategies

……Members of the Telco 2.0 Executive Briefing Subscription Service and Future Networks Stream can download the full 25 page report in PDF format here. Non-Members, please see here for how to subscribe, here to buy a single user license for £595 (+VAT), or for multi-user licenses and any other enquiries please email contact@telco2.net or call +44 (0) 207 247 5003.

Organisations and products referenced: 3GPP, Acision, Akamai, Alcatel-Lucent, Allot, Amazon Cloudfront, Apple’s Time Capsule, BBC, BrightCove, BT, Bytemobile, Cisco, Ericsson, Flash Networks, Huawei, iCloud, ISPs, iTunes, Juniper, Limelight, Netflix, Nokia Siemens Networks, Ooyala, OpenWave, Ortiva, Skype, smartphone, Stoke, tablets, TiVo, Vantrix, Velocix, Wholesale Content Connect, Yospace, YouTube.

Technologies and industry terms referenced: acceleration, advertising, APIs, backhaul, caching, CDN, cloud, distributed caches, DNS, Evolved Packet Core, eyeball network, femtocell, fixed broadband, GGSNs, HLS, HTTP streaming, ingestion, IP network, IPR, laptops, LIPA, LTE, macro-CDN, micro-CDN, middle mile, mobile, Net Neutrality, offload, optimisation, OTT, OVP, peering proxy, QoE, QoS, RNCs, SIPTO, video, video traffic management, WiFi, wireless.

Mobile Broadband Economics: LTE ‘Not Enough’

Summary: Innovation appears to be flourishing in the delivery of mobile broadband. We saw applications that allow users to monitor and control their network usage and services, ‘dynamic pricing’, and other innovative pricing strategies at the EMEA Executive Brainstorm. Despite growing enthusiasm for LTE, delegates considered offloading traffic and network sharing at least as important commercial strategies for managing costs.

Members of the Telco 2.0 Subscrioption Service and Future Networks Stream can download a more comprehensive version of this report in PDF format here. Please email contact@telco2.net or call +44 (0) 207 247 5003 to contact Telco 2.0 or STL Partners for more details.

To share this article easily, please click:

//

Introduction

STL Partners’ New Digital Economics Executive Brainstorm & Developer Forum EMEA took place from 11-13 May in London. The event brought together 250 execs from across the telecoms, media and technology sectors to take part in 6 co-located interactive events: the Telco 2.0, Digital Entertainment 2.0, Mobile Apps 2.0, M2M 2.0 and Personal Data 2.0 Executive Brainstorms, and an evening AppCircus developer forum.

Building on output from the last Telco 2.0 events and new analysis from the Telco 2.0 Initiative – including the new strategy report ‘The Roadmap to New Telco 2.0 Business Models’ – the Telco 2.0 Executive Brainstorm explored latest thinking and practice in growing the value of telecoms in the evolving digital economy.

This document gives an overview of the output from the Mobile Broadband Economics session of the  Telco 2.0 stream.

Putting users in control

A key theme of the presentations in this session was putting users in more control of their mobile broadband service, by helping them to both understand what data they have used in an interactive environment, and giving them the option to choose to buy additional data capabilities on-demand when they need and can use it.

Delegates perceptions that key obstacles to building revenue were internal industry issues, and key cost issues involve better collaboration rather than technology (specifically, LTE) were both refreshing and surprising.

Ericsson presented a mobile Broadband Data ‘Fuel gauge’ app to show how users could be better informed of their usage and be interactively offered pricing and service offers.

Figure 1 – Ericsson’s Mobile Broadband ‘Fuel Gauge’

Telco 2.0 - Mobile Broadband Fuel Gauge

Source: Ericsson, 13th Telco 2.0 Executive Brainstorm, London, May 2011

Deutsche Telekom showed its new ‘self-care’ customer app, complete with WiFi finder, Facebook integration, and ad-funding options, and how they are changing from a focus on complex tariffs to essentially Small/Medium/Large options, with tiers of speed, caps, WiFi access, and varying levels of added-on bundled services.

While we admired the apparent simplicity of the UI design of many of the elements of the services shown, we retain doubts on the proposed use of RCS and various other operator-only “enablers”, and will be further examining the pros and cons of RCS in future analysis.

New pricing approaches

In addition to Ericsson’s concept of dynamic pricing, making offers to customers at times of most need and suitability, Openwave showed numerous innovative new approaches to charging by application, time/day, user group and event (e.g. ‘Movie Pass’), segmentation of plans by user type, and how to use data plan sales to sell other services.

Figure 2 – Innovative Mobile Broadband Offers

Telco 2.0 - Mobile Broadband Pricing Options

Source: Openwave, 13th Telco 2.0 Executive Brainstorm, London, May 2011

No single ‘Killer’ obstacle to growth – but lots of challenges

Delegates voted on the obstacles to mobile broadband revenues and the impact of various measures on the control of costs.

Figure 3 – Obstacles to growing Mobile Broadband Revenues

Telco 2.0 - Mobile Broadband Revenue Obstacles

Source: Delegate Vote, 13th Telco 2.0 Executive Brainstorm, London, May 2011

Our take on these results is that:

  • Overall, there appears to be no single ‘killer obstacle’ to growth;
  • Net Neutrality is increasingly seen as a lesser issue in EMEA, certainly than in the US;
  • Whilst securing the largest number of ’major issue’ votes, we are not certain that all delegates fully know the views, needs, expectations and knowledge of upstream customers, and although their expectations are seen as an issue, it does not particularly appear more challenging than organisational or technical ones;
  • Manageable technical and organisational issues (e.g. integration, organisational complexity) appear a bigger obstacle than unmanageable ones (e.g. inability to control devices), although;
  • Implementation issues vary by operator, as can be seen by the relatively large proportions who either do not see integration as an issue at all or see it as a major issue.

Managing Costs: Network Sharing, Offloads as important as LTE 

Figure 4 – Impact of Mobile Broadband Cost Reduction Strategies

Telco 2.0 - Mobile Broadband Cost Strategies

Source: Delegate Vote, 13th Telco 2.0 Executive Brainstorm, London, May 2011

Our take on these results is that the approaches fall into three groups:

  • Strategic, long-term solutions including network sharing, LTE and offloading;
  • Strategies with a potentially important but more moderate impact including pricing, network outsourcing, and video traffic optimisation;
  • And lower impact initiatives such as refreshing the 3G network.

It is interesting that network sharing deals were seen as a more strategic solution to long term cost issues than migration to LTE, although there is logic to this at the current stage of market development with the capital investments and longer time required to build out LTE networks. Similarly, data offload is currently an important cost management strategy.

We found it particularly interesting that network sharing (collaboration) deals are seen as significantly more effective than network outsourcing deals, and will be exploring this further in future analysis.

Next Steps

  • Further research and analysis in this area, including a report on the pros and cons of ‘Under the Floor’ (outsourced network) strategies.
  • More detailed Mobile Broadband sessions at upcoming Telco 2.0 Executive Brainstorms.


The Roadmap to New Telco 2.0 Business Models

$375Bn per annum Growth or Brutal Retrenchment? Which route will Telcos take?

Over the last three years, the Telco 2.0 Initiative has identified new business model growth opportunities for telcos of $375Bn p.a. in mature markets alone (see the ‘$125Bn Telco 2.0 ‘Two-Sided’ Market Opportunity’ and ‘New Mobile, Fixed and Wholesale Broadband Business Models’ Strategy Reports). In that time, most of the major operators have started to integrate elements of Telco 2.0 thinking into their strategic plans and some have begun to communicate these to investors.

But, as they struggle with the harsh realities of the seismic shift from being predominantly voice-centric to data-centric businesses, telcos now find themselves:

  • Facing rapidly changing consumer behaviours and powerful new types of competitors;
  • Investing heavily in infrastructure, without a clear payback;
  • Operating under less benign regulatory environments, which constrain their actions;
  • Being milked for dividends by shareholders, unable to invest in innovation.

As a result, far from yet realising the innovative growth potential we identified, many telcos around the world seem challenged to make the bold moves needed to make their business models sustainable, leaving them facing retrenchment and potentially ultimately utility status, while other players in the digital economy prosper.

In our new 284 page strategy report – ‘The Roadmap to Telco 2.0 Business Models’ – we describe the transformational path the telecoms industry needs to take to carve out a more valuable role in the evolving ‘digital economy’. Based on the output from 5 intensive senior executive ‘brainstorms’ attended by over 1000 industry leaders, detailed analysis of the needs of ‘upstream’ industries and ‘downstream’ end users markets, and with the input from members and partners of the Telco 2.0 Initiative from across the world, the report specifically describes:

  • A new ‘Telco 2.0 Opportunity Framework’ for planning revenue growth;
  • The critical changes needed to telco innovation processes;
  • The strategic priorities and options for different types of telcos in different markets;
  • Best practice case studies of business model innovation.

The ‘Roadmap’ Report Builds on Telco 2.0’s Original ‘Two-Sided’ Telecoms Business Model

Updated Telco 2.0 Industry Framework

Source: The Roadmap to New Telco 2.0 Business Models


Who should read this report

The report is for strategy decision makers and influences across the TMT (Telecoms, Media and Technology) sector. In particular, CxOs, Strategists, Technologists, Marketers, Product Managers, and Legal and Regulatory leaders in telecoms operators, vendors, consultants, and analyst companies. It will also be valuable to those managing or considering medium to long-term investment in the telecoms and adjacent industries, and to regulators and legislators.

It provides fresh, creative ideas to:

Grow revenues beyond current projections by:

  • Protecting revenues from existing customers;
  • Extending services to new customers;
  • Generating new service offering and revenues.

Stay relevant with customers through:

  • A broader range of services and offers;
  • More personalised services;
  • Greater interaction with customers.

Evolve business models by:

  • Moving from a one-sided to a two-sided business model;
  • Generating cross-platform network effects – between service providers and customers;
  • Exploiting existing latent assets, skills and relationships.


The Six Telco 2.0 Opportunity Areas

Six Telco 2.0 Opportunity Types

Source: The Roadmap to New Telco 2.0 Business Models

What are the Key Questions the Report Answers?

For Telcos:

  • Where should your company be investing for growth?
  • What is ‘best practice’ in telecoms Telco 2.0 business model innovation and how does your company compare to it?
  • Which additional strategies should you consider, and which should you avoid?
  • What are the key emerging trends to monitor?
  • What actions are required in the areas of value proposition, technology, value / partner network, and finances?

For Vendors and Partners:

  • How to segment telecoms operators?
  • How well does your offering support Telco 2.0 strategies and transformation needs in your key customers?
  • What are the most attractive new areas in which you could support telcos in business model innovation?

For Investors and Regulators:

  • What are and will be the main new categories of telcos/CSPs?
  • What are the principle opportunity areas for operators?
  • What are and will be operator’s main strategic considerations with respect to new business models?
  • What are the major regulatory considerations of new business models?
  • What are the main advantages and disadvantages that telcos have in each opportunity area?

Contents

  • Executive Summary & Introduction
  • Pressures on Operators
  • The new Telco 2.0 Framework
  • Principles of Innovation and Services Delivery
  • – Strategic Positioning
  • – Design
  • – Development and delivery
  • Categorising telcos
  • Category 1: Leading international operators
  • Category 2: Regional leaders
  • Category 3: Wholesale and business-focused telcos
  • Category 4: Challengers & disruptors
  • Category 5: Smaller national leaders
  • Conclusions and Recommendations