Innovation Leaders: Iliad – A Disruptive Operator Tackles The Cloud

Introduction

To understand how disruptive Iliad’s approach to cloud services is, it is useful to consider it within the wider context of operator cloud services and technology strategies.

Although telecoms operators have often talked a good game when it comes to offering enterprise cloud services, most have found it challenging to compete with the major dedicated and Internet-focused cloud providers like Rackspace, Google, Microsoft, and most of all, Amazon Web Services. Smaller altnets and challenger mobile operators – and even smaller incumbents – have struggled to find enough scale, while even huge operators like Telefonica or Verizon have largely failed to differentiate themselves from the competition. Further, the success of the software and Internet services cloud providers in building hyperscale infrastructure has highlighted a skills gap between telcos and these competitors in the data centre. Although telcos are meant to be infrastructure businesses, their showing on this has largely been rather poor.

In our earlier 2012 Strategy Report Cloud 2.0: Telco Strategies in the Cloud, we pointed to differentiation as the biggest single challenge for telco cloud services. The report argued that the more telcos bought into pre-packaged technology solutions from vendors like VMWare, the less control over the future development path of their software they would have, and the more difficult it would be for them to differentiate effectively. We show the distinction in Figure 1 (see the Technology section of the heatmap). Relying heavily on third-party proprietary technology solutions for cloud would give telcos a structural disadvantage relative to the major non-telco cloud players, who either develop their own, or contribute to fast-evolving open-source projects.

We also observed in that report that nearly all the operators we evaluated who were making any effort to compete in Infrastructure-as-a-Service (IaaS) or Platform-as-a-Service (PaaS), had opted to resell VMWare technology.

Looking back from 2016, we observe that the operators who went down this route – Verizon is a prime example – have not succeeded in the cloud. The ones that chose to own their technology, building the skills base internally by contributing to the key open-source projects, like AT&T (with its commitment to the OpenStack solution), or who became a preferred regional partner for the major cloud providers (like Telstra), have done much better.

Figure 1: Telco strategies in the cloud, 2012 – most providers go with VMWare-based solutions

Source: STL Partners, Cloud 2.0 Strategy Report

AT&T’s strategy of using the transition to cloud to take control of its own technology, move forward on the SDN/NFV tech transition, and re-organise its product line around its customers’ needs, has helped to set its revenue from strategic business services powering ahead of its key competitor, Verizon, as Figure 2 shows.

Figure 2: Getting the cloud right pays off at AT&T Strategic Business Services

Source: STL Partners

The above is the opening of the report’s introduction, which goes on to outline our views on the cloud market and reprise telcos’ opportunity and progress in it. To access the other 23 pages of this 26 page Telco 2.0 Report, including…

  • Executive Summary
  • Introduction
  • Iliad: A Champion Disruptor
  • Cloud at Iliad
  • Responding to cloud market disruption: Iliad draws on its hi-lo segmentation experience
  • Scaleway: Address the start-ups and scale-ups
  • Dedibox Power 8: doubling down on the high end
  • Nodebox: build-your-own network switches
  • Financial impact for Iliad
  • Conclusions

…and the following report figures…

  • Figure 1: Telco strategies in the cloud, 2012 – most providers go with VMWare-based solutions
  • Figure 2: Getting the cloud right pays off at AT&T Strategic Business Services
  • Figure 3: AWS is not just a price leader
  • Figure 4: STL Partners’ cloud adoption forecast
  • Figure 5: Free Mobile’s growth repeatedly surprises on the upside
  • Figure 6: Free Mobile’s 4G build overtakes SFR
  • Figure 7: Free Mobile is a top scorer on our network quality metrics
  • Figure 8: Free Mobile’s customer satisfaction ratings are excellent
  • Figure 9: Specs for ‘extreme performance’ Dedibox server models
  • Figure 10: The C1 ‘Pimouss’ microserver
  • Figure 11: 18 C1s close-packed in a standard server blade
  • Figure 12: Scaleway Hosted C1 Server Pricing
  • Figure 13: The case for more POWER8: IBM POWER8 vs Intel x86 E5
  • Figure 14: A Nodebox, Free’s internally developed network switch
  • Figure 15: A useful business, if no AWS

Five Principles for Disruptive Strategy

Introduction

Disruption has become a popular theme, and there are some excellent studies and theories, notably the work of Clayton Christensen on disruptive innovation.

This briefing is intended to add some of our observations, ideas and analysis from looking at disruptive forces in play in the telecoms market and the adjacent areas of commerce and content that have had and will have significant consequences for telecoms.

Our analysis centres on the concept of a business model: a relatively simple structure that can be used to describe and analyse a business and its strategy holistically. The structure we typically use is shown below in Figure 1, and comprises 5 key domains: The Marketplace; Service Offering; Value Network; Finance; and Technology.

Figure 1 – A business model is the commercial architecture of a business: how it makes money

Telco 2.0: STL Partners standard business model analysis Framework

Source: STL Partners

This structure is well suited to analysis of disruption, because disruptive competition is generally a case of conflict between companies with different business models, rather than competition between similarly configured businesses.

A disruptive competitor, such as Facebook for telecoms operators, may be in a completely different core business (advertising and marketing services) seeking to further that business model by disrupting an existing telecoms service (voice and messaging communications). Or it may be a broadly similar player, such as Free in France whose primary business is recognisably telecoms, using a radically different operational model to gain share from direct competitors.

We will look at some of these examples in more depth in this report, and also call on analysis of Google, Apple, Facebook and Amazon to illustrate principles

Digital value is often transient

KPN: a brief case study in disruption

KPN, a mobile operator in the Netherlands, started to report a gradual reduction in SMS / user statistics in early 2011, after a long period of near continuous growth.

Figure 2 – KPN’s SMS stats per user started to change at the end of 2010

Telco 2.0 Figure 2 KPNs SMS stats per user stated to change at the end of 2010

Source: STL Partners, Mobile World Database

KPN linked this change to the rapid rise of the use of WhatsApp, a so-called over-the-top (OTT) messaging application it had noticed among ‘advanced users’ – a set of younger Android customers, as shown in Figure 3.

Figure 3 – WhatsApp took off in certain segments at the end of 2010

Telco 2.0 Figure 3 WhatsApp took off in certain segments at the end of 2010

Source: KPN Corporate Briefing, May 2011

There was some debate at the time about the causality of the link, but the longer term picture of use and app penetration certainly supports the connection between the rise of WhatsApp take-up among KPN’s broader base (as opposed to ‘advanced users’ in Figure 3) and the rapid decline of SMS volumes as Figure 4 shows.

Figure 4 – KPN’s SMS volumes have continued to decline since 2010

Telco 2.0 Figure 4 KPN’s SMS volumes have continued to decline since 2010

Source: STL Partners estimates, Mobile World, Telecomspaper, Statista, Comscore, KPN.

How did that happen then?

KPN’s position was particularly suited to a disruptive attack by WhatsApp (and other messaging apps) in the Netherlands because:

  • It had relatively high unit prices per SMS.
  • KPN had not ‘bundled’ many SMSs into its packages compared to other operators, and usage was very much ‘pay as you go’ – so using WhatsApp offered immediate savings to users.
  • Its market of c.17 million people is technologically savvy with high early smartphone penetration, and densely populated for such a wealthy country, so well suited to the rapid viral growth of such apps.

KPN responded by increasing the number of SMSs in bundles and attempting to ‘sell up’ users to packages with bigger bundles. It has also embarked on more recent programmes of cost reduction and simplification. But as far as SMS was concerned, the ‘horse had bolted the stable’ and the decline continues as consumers gravitate away from a service perceived as losing relevance and value.

We will look in more depth at disruptive pricing and product design strategies in the section on ‘Free is not enough, nor is it the real issue’ later in this report. This case study also presents another challenge for strategists: why did the company not act sooner and more effectively?

Denial is not a good defence

One might be forgiven for thinking that the impact of WhatsApp on KPN was all a big surprise. And perhaps to some it was. But there were plenty of people that expected significant erosion of core revenues from such disruption. In a survey we conducted in 2011, the average forecast among 300 senior global telecoms execs was that OTT services would lead to a 38% decline in SMS over the next 3-5 years, and earlier surveys had shown similar pessimism.

Having said that, it is also true that there was some shock in the market at the time over KPN’s results, and subsequent findings in other markets in Latin America and elsewhere. It is only recently that it has become more of an accepted ‘norm’ in the industry that its core revenues are subject to attack and decline.

Perhaps the best narrative explanation is one of ‘corporate denial’, akin to the human process of grief. Before we reach acceptance of a loss, individuals (and consequently teams and organisations by this theory) go through various stages of emotional response before reaching ‘acceptance’ – a series of stages sometimes characterised as ‘denial, anger, negotiation and acceptance’. This takes time, and is generally considered healthy for people’s emotional health, if not necessarily organisations’ commercial wellbeing.

So what can be done about this? It’s hard to change nature, but it is possible to recognise circumstances and prepare forward plans differently. In the digital era, leaders, strategists, marketers, and product managers need to recognise that profit pools are increasingly transient, and if you are skilful or lucky enough to have one in your portfolio, it is critical to anticipate that someone is probably working on how to disrupt it, and to gather and act quickly on intelligence on realistic threats. There are also steps that can be taken to improve defensive positions against disruption, and we look at some of these in this report. It isn’t always possible because sometimes the start point is not ideal – but then again, part of the art is to avoid that position.


  • Executive Summary: five principles
  • Introduction
  • Digital value is often transient
  • KPN: a brief case study in disruption
  • How did that happen then?
  • Denial is not a good defence
  • Timing a disruptive move is critical
  • Disruption visibly destroys value
  • So when should strategists choose disruption?
  • Free is not enough, nor is it the real issue
  • How market winners meet needs better
  • How to compete with ‘free’?
  • Build the platform, feed the flywheel
  • Nurture the ecosystem
  • …don’t price it to death


  • Figure 1 – A business model is the commercial architecture of a business: how it makes money
  • Figure 2 – KPN’s SMS stats per user started to change at the end of 2010
  • Figure 3 – WhatsApp took off in certain segments at the end of 2010
  • Figure 4 – KPN’s SMS volumes have continued to decline since 2010
  • Figure 5 – Free’s disruptive play is destroying value in the French Market, Q1 2012-Q3 2014
  • Figure 6 – Verizon is winning in the US – but most players are still growing too, Q1 2011-Q1 2014
  • Figure 7 – How ‘OTT’ apps meet certain needs better than core telco services
  • Figure 8 – US and Spain: different approaches to disruptive defence
  • Figure 9 – The Amazon platform ‘flywheel’ of success

Free-T-Mobile: Disruptive Revolution or a Bridge Too Far?

Free’s Bid for T-Mobile USA 

The future of the US market and its 3rd and 4th operators has been a long-running saga. The market, the world’s richest, remains dominated by the duopoly of AT&T and Verizon Wireless. It was long expected that Softbank’s acquisition of Sprint heralded disruption, but in the event, T-Mobile was simply quicker to the punch.

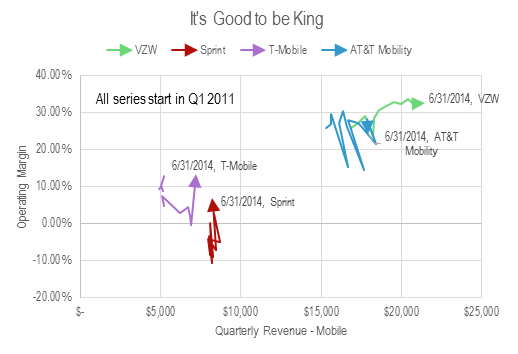
Since the launch of T-Mobile’s “uncarrier” price-war strategy, we have identified signs of a “Free Mobile-like” disruption event, for example, substantial net-adds for the disruptor, falling ARPUs, a shakeout of MVNOs and minor operators, and increased industry-wide subscriber growth. However, other key indicators like a rapid move towards profitability by the disruptor are not yet in evidence, and rather than industry-wide deflation, we observe divergence, with Verizon Wireless increasing its ARPU, revenues, and margins, while AT&T’s are flat, Sprint’s flat to falling, and T-Mobile’s plunging.

This data is summarised in Figure 1.

Figure 1: Revenue and margins in the US. The duopoly is still very much with us


Source: STL Partners, company filings

Compare and contrast Figure 2, which shows the fully developed disruption in France. 


Figure 2: Fully-developed disruption. Revenue and margins in France


Source: STL Partners, company filings

T-Mobile: the state of play in Q2 2014

When reading Figure 1, you should note that T-Mobile’s Q2 2014 accounts contain a negative expense item of $747m, reflecting a spectrum swap with Verizon Wireless, which flatters their margin. Without it, the operating margin would be 2.99%, about a third of Sprint’s. Poor as this is, it is at least positive territory, after a Q1 in which T-Mobile lost money. It is not quite true to say that T-Mobile only made it to profitability thanks to the one-off spectrum deal; excluding it, the carrier would have made $215m in operating income in Q2, a $243m swing from the $28m net loss in Q1. This is explained by a $223m narrowing of T-Mobile’s losses on device sales, as shown in Figure 2, and may explain why the earnings release makes no mention of profits instead of adjusted EBITDA despite it being a positive quarter.

Figure 3: T-Mobile’s return to underlying profitability – caused by moderating its smartphone bonanza somewhat

Source: STL Partners, company filings

T-Mobile management likes to cite its ABPU (Average Billings per User) metric in preference to ARPU, which includes the hire-purchase charges on device sales under its quick-upgrade plans. However, as Figure 3 shows, this is less exciting than it sounds. The T-Mobile management story is that as service prices, and hence ARPU, fall in order to bring in net-adds, payments for device sales “decoupled” from service plans will rise and take up the slack. They are, so far, only just doing so. Given that T-Mobile is losing money on device pricing, this is no surprise.


  • Executive Summary
  • Free’s Bid for T-Mobile USA
  • T-Mobile: the state of play in Q2 2014
  • Free-Mobile: the financials
  • Indicators of a successful LBO
  • Free.fr: a modus operandi for disruption
  • Surprise and audacity
  • Simple products
  • The technical edge
  • Obstacles to the Free modus operandi
  • Spectrum
  • Fixed-mobile synergy
  • Regulation
  • Summary
  • Two strategic options
  • Hypothesis one: change the circumstances via a strategic deal with the cablecos
  • Hypothesis two: 80s retro LBO
  • Problems that bite whichever option is taken
  • The other shareholders
  • Free’s management capacity and experience
  • Conclusion


  • Figure 1: Revenue and margins in the US. The duopoly is still very much with us
  • Figure 2: Fully-developed disruption. Revenue and margins in France
  • Figure 3: T-Mobile’s return to underlying profitability – caused by moderating its smartphone bonanza somewhat
  • Figure 4: Postpaid ARPU falling steadily, while ABPU just about keeps up
  • Figure 5: T-Mobile’s supposed “decoupling” of devices from service has extended $3.5bn of credit to its customers, rising at $1bn/quarter
  • Figure 6: Free’s valuation of T-Mobile is at the top end of a rising trend
  • Figure 7: Example LBO
  • Figure 8: Free-T-Mobile in the context of notable leveraged buyouts
  • Figure 9: Free Mobile’s progress towards profitability has been even more impressive than its subscriber growth


Disruptive Strategy: ‘Uncarrier’ T-Mobile vs. AT&T, VZW, and Free.fr

Introduction

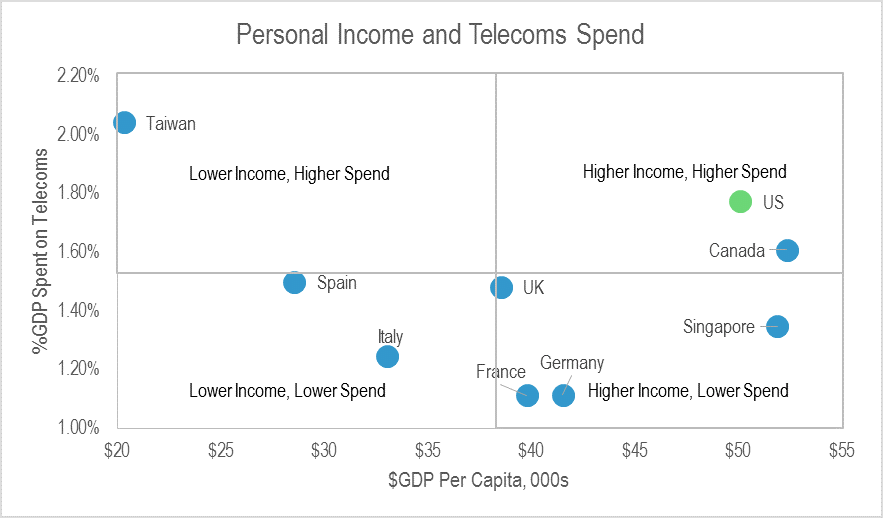
Ever since the original Softbank bid for Sprint-Nextel, the industry has been awaiting a wave of price disruption in the United States, the world’s biggest and richest mobile market, and one which is still very much dominated by the dynamic duo, Verizon Wireless and AT&T Mobility.

Figure 1: The US, a rich and high-spending market

The US a rich and high-spending market

Source: Onavo, Ofcom, CMT, BNETZA, TIA, KCC, Telco accounts, STL Partners

However, the Sprint-Softbank deal saga delayed any aggressive move by Sprint for some time, and in the meantime T-Mobile USA stole a march, implemented its own very similar ‘uncarrier’ proposition strategy, and achieved a dramatic turnaround of their customer numbers.

As Figure 2 shows, the duopoly marches on, with Verizon in the lead, although the gap with AT&T has closed a little lately. Sprint, meanwhile, looks moribund, while T-Mobile has closed half the gap with the duopolists in an astonishingly short period of time.

Figure 2: The duopolists hold a lead, but a new challenger arises…

The duopolists hold a lead but a new challenger arises
Source: STL Partners

Now, a Sprint-T-Mobile merger is seriously on the cards. Again, Softbank CEO Masayoshi Son is on record as promising to launch a price war. But to what extent is a Free Mobile-like disruption event already happening? And what strategies are carriers adopting?

For more STL analysis of the US cellular market, read the original Sprint-Softbank EB , the Telco 2.0 Transformation Index sections on Verizon  and AT&T , and our Self-Disruption: How Sprint Blew It EB . Additional coverage of the fixed domain can be found in the Triple-Play in the USA: Infrastructure Pays Off EB  and the Telco 2.0 Index sections mentioned above

The US Market is Changing

In our previous analysis Self-Disruption: How Sprint Blew It, we used the following chart, Figure 3, under the title “…And ARPU is Holding Up”. Updating it with the latest data, it becomes clear that ARPU – and in this case pricing – is no longer holding up so well. Rather than across-the-board deflation, though, we are instead seeing increasingly diverse strategies.

Figure 3: US carriers are pursuing diverse pricing strategies, faced with change

US carriers are pursuing diverse pricing strategies, faced with change

Source: STL Partners

AT&T’s ARPU is being very gradually eroded (it’s come down by $5 since Q1 2011), while Sprint’s plunged sharply with the shutdown of Nextel (see report referenced above for more detail). Since then, AT&T and Sprint have been close to parity, a situation AT&T management surely can’t be satisfied with. T-Mobile USA has slashed prices so much that the “uncarrier” has given up $10 of monthly ARPU since the beginning of 2012. And Verizon Wireless has added almost as much monthly ARPU in the same timeframe.

Each carrier has adopted a different approach in this period:

  • T-Mobile has gone hell-for-leather after net adds at any price.
  • AT&T has tried to compete with T-Mobile’s price slashing by offering more hardware and bigger bundles and matching T-Mobile’s eye-catching initiatives, while trying to hold the line on headline pricing, perhaps hoping to limit the damage and wait for Deutsche Telekom to tire of the spending. For example, AT&T recently increased its device activation fee by $4, citing the increased number of smartphone activations under its early-upgrade plan. This does not appear in service-ARPU or in headline pricing, but it most certainly does contribute to revenue, and even more so, to margin.
  • Verizon Wireless has declined to get involved in the price war, and has concentrated on maintaining its status as a premium brand, selling on coverage, speed, and capacity. As the above chart shows, this effort to achieve network differentiation has met with a considerable degree of success.
  • Sprint, meanwhile, is responding tactically with initiatives like its “Framily” tariff, while sorting out the network, but is mostly just suffering. The sharp drop in mid-2012 is a signature of high-value SMB customers fleeing the shutdown of Nextel, as discussed in Self-Disruption: How Sprint Blew It.

Figure 4: Something went wrong at Sprint in mid-2012

Something went wrong at Sprint in mid-2012

Source: STL Partners, Sprint filings


  • Executive Summary
  • Contents
  • Introduction
  • The US Market is Changing
  • Where are the Customers Coming From?
  • Free Mobile: A Warning from History?
  • T-Mobile, the Expensive Disruptor
  • Handset subsidy: it’s not going anywhere
  • Summarising change in the US and French cellular markets
  • Conclusions


  • Figure 1: The US, a rich and high-spending market
  • Figure 2: The duopolists hold a lead, but a new challenger arises…
  • Figure 3: US carriers are pursuing diverse pricing strategies, faced with change
  • Figure 4: Something went wrong at Sprint in mid-2012
  • Figure 5: US subscriber net-adds by source
  • Figure 6: The impact of disruption – prices fall across the board
  • Figure 7: Free’s spectacular growth in subscribers – but who was losing out?
  • Figure 8: The main force of Free Mobile’s disruption didn’t fall on the carriers
  • Figure 9: Disruption in France primarily manifested itself in subscriber growth, falling ARPU, and the death of the MVNOs
  • Figure 10: T-Mobile has so far extended $3bn of credit to its smartphone customers
  • Figure 11: T-Mobile’s losses on device sales are large and increasing, driven by smartphone volumes
  • Figure 12: Size and profitability still go together in US mobile – although this conceals a lot of change below the surface
  • Figure 13: Fully-developed disruption, in France
  • Figure 14: Quality beats quantity. Sprint repeatedly outspent VZW on its network