Edge computing market sizing forecast: Second release

This is the second release of STL’s edge computing revenue forecast

In this release, we update the forecast and include regional edge

The edge computing market continues to invite different types of players including telcos, hyperscalers, data centre operators and enterprise connectivity providers. The varying requirements across verticals, business sizes and use cases create an opportunity that can accommodate all these different players. However, it is important for any edge provider to understand how to position its service in the space and what areas of the market to pursue vertically and horizontally.

Through quantitative analysis, this report aims to help telcos and others to identify where opportunities lie. This report presents the key findings of STL Partners’ demand forecast model for edge computing services. Its purpose is to:

  • Assess the demand from 20 use cases which currently rely on edge or will require edge to fully develop;
  • Identify the total revenue across the value chain: device, connectivity, application, edge infrastructure (regional, network and on-premise), and integration and support;
  • Output a full set of results for over 90 countries over the 2020–2030 period per use case and per vertical.

This report is accompanied by a dashboard which presents a summary of our model output and the associated graphics for the world’s regions and for 20 major markets. The dashboard also presents the full revenue output for the 97 countries.

Download the accompanying spreadsheet 

Edge computing addressable revenue will reach US$445 billion by 2030

High-level findings from the model indicate that:

  • The total edge computing addressable market will grow from US$9 billion in 2020 to US$445 billion in 2030 at a CAGR of 48% over the 10-year period.
  • We now forecast regional edge in addition to network and on-prem edge. Regional edge refers to local edge data centres that are outside the telecoms operators’ network. Examples of these include internet exchange data centres, small data centres in Tier 2/3 cities, AWS Local Zones, etc.
  • The vertical opportunities in on-prem and distributed edge are quite different. Telcos and other providers that are looking into the various types of infrastructure to offer edge services should evaluate these differences and assess their own capabilities and willingness to compete in these verticals.
  • The growth in the number of connected devices, as well as the need for higher levels of automation, operational efficiency and cost reduction, will drive the adoption of edge computing across many use cases and verticals over the next 10 years. This will result in increased spend across the value chain.

Enter your details below to download an extract of the report

Total edge computing addressable revenue 2020–2030

This forecast is part of our Edge Insights Service which also includes:

Enter your details below to download an extract of the report

AI & automation for telcos: Mapping the financial value

This is an update to STL Partners report A3 for telcos: Mapping the financial value, published in May 2020, which estimated the financial value of automation, AI and analytics (A3) through bottom up analysis of potential capex/opex savings or revenue uplift from integrating A3 into 150+ processes across a telco’s core operations.

The value is measured on an annual basis in dollar terms and as a proportion of total revenue for a “standard telecoms operator”. Access to the full methodology and definition of a standard telco is available in the report Appendix.

We categorise the value of automation, AI and analytics (A3) in telecoms across operational area, as well as type and purpose of A3 technology. Our graphic below summarises the value of A3 across the following six types of technology:

  1. Making sense of complex data: Analytics and machine learning used to understand large, mostly structured data sets, looking for patterns to diagnose problems and predict/prescribe resolutions.
  2. Automating processes: Intelligent automation and RPA to enable decision making, orchestration and task completion within telco processes.
  3. Personalising customer interactions: Analytics and machine learning used to understand customer data, create segmentation, identify triggers and prescribe actions to be taken.
  4. Support business planning: Analytics and machine learning used in forecasting and optimisation exercises.
  5. Augmenting human capabilities: AI solutions such as natural language processing and text analytics used to understand human intent or sentiment, to support interactions between customers or employees and telco systems.
  6. Frontier AI solutions: A number of individual AI solutions which have particular, specialist uses within a telco.

For further detail on this categorisation methodology, see STL Partners report The telco A3 application map

Enter your details below to request an extract of the report

What’s new in 2022

The colouring of the use case categories in the graphic below remains largely unchanged from May 2020. Some uses of A3 were reasonably mature in that timeframe and already rolled out in a typical telco, so their value was already well understood.

We estimate that the most valuable use case categories, primarily in networks and operations, deliver over $50 millions in annual benefits – and sometimes up to hundreds of millions. Throughout this report we express the value in dollar terms and as a percentage of savings within each domain. This is because while $50 million is clearly a significant sum, it accounts for just 0.33% of total revenues for our standard operator, so showing values for unique use case categories as a proportion of total revenues undermines the potential value A3 can add to individual teams, and in turn contribute to significant aggregate value across an operator.

Overview of the financial value of A3

financual-value-A3

Source: STL Partners, Charlotte Patrick Consult

In our May 2020 research, many of the more sophisticated uses of A3 were understood in theory but yet to be implemented. Researching these various newer uses cases throughout 2021 has revealed that many are now, at least partly, rolled out (although some are still waiting for cleaner data or more orchestration capabilities).

However, there were a few new case studies with financial benefits that necessitated more than small changes to the 2020 financial value calculations. Summarising the changes illustrated in the graphic above:

  • The most noticeable change in uptake for A3 was in the BSS domain. Vendors and telcos were not discussing much beyond RPA and basic analytics in 2020, but there are now a whole range of potential uses for ML (typically in the box labelled “Revenue management” in the graphic above). The question of how much additional financial value to assign to this is interesting – some of the A3 will ensure that the rating and charging systems can cope with the additional volume and complexity around 5G and IoT billing, so an allocation of revenue uplift has been assigned. However, this revenue benefit only accounts for around 6% of the additional $83 million in value from A3 in networks and operations estimated in this update.
  • We have added partner management as a new use case category, within operations. This is to allow A3 value to be added as telcos work with more partners and in new ecosystems, and accounts for 6% of additional value in networks and operations in this update.
  • An increase in the assumed value of A3 within marketing programs, owing to the addition of ML to improve the design of new offers.
  • The value of a previous use case category labelled “Troubleshooting” has been subsumed into “Unassisted channels”, as telcos find it difficult to implement troubleshooting tools for customers.
  • Some increase in financial benefit around customer chatbots and field services, due to new case studies showing financial value.

Our report includes a section for each of the first three columns of the graphic above (Networks and operations, customer channels, marketing and sales). The final column (other functions) doesn’t currently have financial calculations underpinning it as values are thought to be insubstantial in comparison to the first three columns.

Table of contents

  • Executive summary
  • Overview of the financial value of automation, AI and analytics (A3)
  • Financial value by business unit
    • BSS, OSS and networks
    • Customer channels
    • Sales and marketing
  • Appendix
    • Methodology for Calculating Financial Value
    • Augmented Analytics Capabilities

Related Research

Enter your details below to request an extract of the report

Forecasting capacity of network edge computing

We have updated this forecast. Check the latest report here

Telco edge build has been slower than expected

Telecoms operators have been planning the deployment of edge computing sites for at least the last three years.

Initially, the premise of (mobile) edge computing was to take advantage of the prime real estate telecoms operators had. Mobile operators, in particular, had undergone a process of evolving their network facilities from sites which housed purpose-built networking equipment to data centres as they adopted virtualisation. The consolidation of networking equipment meant there would be spare capacity in these data centres that could easily host applications for enterprises and developers.

That evolution has now been accelerated by the advent of 5G, a mobile generation built on a software-based architecture and IT principles. The result will be a proliferation of edge data centres that will be used for radio access network and core network hardware and software.

However, the reality is that it has taken time for telcos to deploy these sites. There are multiple reasons for this:

  1. Cost: There is a cost to renovate an existing telco site and ensure it meets requirements common for world-class data centres.
  2. Demand: Telcos are hesitant to take on the risk of building out the infrastructure until they are certain of the demand for these data centres.
  3. 5G roll-out: Mobile operators have been prioritising their 5G RAN roll-out in the last two years, over the investment in edge data centres.
  4. Partnership decisions: The discussion around who to partner with to build the edge data centres has become more complicated, because of the number of partners vying for the role and the entrance of new partners (e.g. hyperscalers) which has slowed down decision-making

Enter your details below to request an extract of the report

Early adopters have taken significant strides in their edge strategy in 2021

2020 and 2021 have been seen as inflection points as a number of leading telecoms operators have launched edge sites: e.g. AT&T, Verizon, Cox Communications, SK Telecom and Vodafone. Arguably, this was triggered by AWS announcing partnerships on AWS Wavelength with four telecoms operators in November 2019, with more recently announced (e.g. Telstra in 2021).

Going forward, key questions remain on the trajectory of telco edge build:

  • How many edge data centres will telcos build and make available for consumer/enterprise applications?
  • How much capacity of telco edge computing will there be globally?
  • How much of telco edge computing will be used for distributed core network functions vs. consumer/enterprise applications?
  • What proportion of telco edge data centre capacity will be taken up by hyperscalers’ platforms?

This report seeks to forecast the capacity at telecoms operators’ edge data centres until 2025 and provide clarity on the nature and location of these sites. In other words, how many sites and servers will be available for running applications and where will these sites be located, both physically and logically in the telecoms operators’ networks.

Before reading this report, we would recommend reading STL Partners’ previous publications on telco edge computing to provide context for some of the key themes addressed, for example:

The report focuses on network edge computing sites

Edge computing comprises of a spectrum of potential location and technologies designed to bring processing power closer to the end-device and source of data, outside of a central data centre or cloud. This report focuses on forecasting capacity at the network edge – i.e. edge computing at edge data centres owned (and usually operated) by telecoms operators.

The initial version of the forecast models capacity at these sites for non-RAN workloads. In other words, processing for enterprise or consumer applications and the distributed core network functions required to support them. Future versions of the forecast will expand to RAN.

Forecast scope in terms of edge locations and workload types

The report covers two out of three scenarios for building the network edge

Table of content

  • Executive summary
  • Introduction
  • There are 3 key factors determining telco edge data centre build out
  • Logically, most network edge will be in the transport aggregation layer
  • Geographically, we will see a shift in the concentration of network edge data centres
  • The limited capacity at network edge DCs will largely be used for edge applications
  • Most telecoms operators are taking a hybrid approach to building their edge
  • Conclusions and next steps
  • Appendix: Methodology

Enter your details below to request an extract of the report

Edge computing market sizing forecast

We have updated this forecast. Check the latest report here

Introducing STL Partners’ edge computing market sizing forecast

This report presents the key findings of STL Partners’ new demand forecast model for edge computing services. Its purpose is to:

  • Assess the demand from 20 use cases which currently rely on edge or will require edge to fully develop;
  • Identify the total revenue across the value chain: hardware, connectivity, application, edge infrastructure (network and on-premise), and integration and support;
  • Output a full set of results for over 180 countries over the 2020–2030 period per use case and per vertical.

This report is accompanied by a dashboard which presents a summary of our model output and the associated graphics for the world’s regions and for 20 major markets. The dashboard also presents the full revenue output for the 180+ countries.

Enter your details below to request an extract of the report

Edge computing addressable revenue will reach US$543 billion by 2030

High-level findings from the model indicate that:

  • The growth in the number of connected devices, as well as the need for higher levels of automation, operational efficiency and cost reduction, will drive the adoption of edge computing across many use cases and verticals over the next 10 years. This will result in increased spend across the value chain.
  • The total edge computing addressable market will grow from US$10 billion in 2020 to US$543 billion in 2030 at a CAGR of 49% over the 10-year period.
  • The total value chain breaks into five main components which are hardware, connectivity, application, integration & support, in addition to the edge infrastructure which includes both on-prem edge and network edge.

Total edge computing addressable revenue

Edge computing

Source: STL Partners

Table of contents

  • Executive Summary
  • Methodology
  • Revenue by value chain component
  • Revenue by use case
  • Revenue by vertical
  • Revenue by region
  • Appendix

For more information on STL Partners’ edge-related services, please go to our Edge Insights Service page.

The new forecast is intended to complement:

<

Enter your details below to download an extract of the report

O-RAN: What is it worth?

Introducing STL Partners’ O-RAN Market Forecast

This capex forecast is STL Partners’ first attempt at estimating the value of the O-RAN market.

  • This is STL Partners’ first O-RAN market value forecast
  • It is based on analysis of telco RAN capex and projected investment pathways for O-RAN
  • The assumptions are informed by public announcements, private discussions and the opinions of our Telco Cloud team
  • We look forward to developing it further based on client feedback

Enter your details below to request an extract of the report

What is O-RAN?

We define O-RAN as virtualised, disaggregated, open-interface architectures.

  • Our O-RAN capex forecasts cover virtualised, disaggregated, open-interface architectures in the Radio Access Network
  • They do not include vRAN or O-RAN compliant but single vendor deployments

O-RAN definition open RAN

O-RAN will account for 76% of active RAN capex by 2030

As mobile operators upgrade their 4G networks and invest in new 5G infrastructure, they can continue purchasing single vendor legacy RAN equipment or opt for multi-vendor open-standard O-RAN solutions.

Each telco will determine its O-RAN roadmap based on its specific circumstances (footprint, network evolution, rural coverage, regulatory pressure, etc)1. For the purpose of this top-level O-RAN capex forecast, STL has defined four broad pathways for transitioning from legacy RAN/vRAN to O-RAN and categorised each of the top 40 mobile operators in one of the pathways, based on their announced or suspected O-RAN strategy.

Through telcos’ projected mobile capex and the pathway categorisation, we estimate that by 2026 annual sales of O-RAN active network elements (including equipment and software) will reach USD12 billion, or 21% of all active RAN capex (excluding passive infrastructure). By 2030, these will reach USD43 billion and 76%, respectively.

Total annual O-RAN capex spend

Table of content

  • Executive summary
    • O-RAN forecast 2020-2030
    • Brownfield vs greenfield
    • Four migration pathways
  • Modelling assumptions
  • Migration pathways
    • Committed O-RAN-philes
    • NEP-otists
    • Leap-froggers
    • Industrial O-RAN
  • Next steps


Enter your details below to request an extract of the report

The $300bn COVID digital health dividend

This report introduces a new sizing model for digital healthcare that reflects the recent impact of the COVID pandemic on the sector, with the goal of identifying the new opportunities and risks presented to operators and others attempting or considering investment in the market. A key finding is that market development has been accelerated four years ahead of its prior trajectory, meaning that players should significantly reassess the urgency and scale of their strategic application.

—————————————————————————————————————————————————————

Download the additional file to access the database tool accompanying the analytical report

—————————————————————————————————————————————————————

Why healthcare?

STL Partners has long argued that if telecoms operators want to build new businesses beyond connectivity, they will need 1) clarity on which customer needs to address and 2) long term commitment to investment and innovation to address them. Adding value farther up the value chain requires significant new skills and capabilities, so we believe telecoms operators must be deliberate in their choice of which customers they want to serve, i.e. which verticals, and what they want to do for them. For more detail, see STL Partners’ report How mobile operators can build winning 5G business models.

We believe that healthcare is a vertical that is well suited to telecoms operators’ strategic scope:

  • Healthcare is a consistently growing need in every country in the world
  • It is a big sector that can truly move the needle on telcos’ revenues, accounting for nearly 10% of GDP globally in 2018, up from 8.6% of GDP in 2000 according to WHO data
  • It operates within national economies of scale (even if the technology is global, implementation of that technology requires local knowledge and relationships)
  • The sector has historically been slower than others in its adoption of new technologies, partly due to quality and regulatory demands, factors that telcos are used to dealing with
  • Improving healthcare outcomes is meaningful work that all employees and stakeholders can relate to.

Many telcos also believe that healthcare is a vertical with significant opportunity, as demonstrated by operators’ such as TELUS and Telstra’s big investments into building health IT businesses, and smaller but ongoing efforts from many others. See STL Partners’ report How to crack the healthcare opportunity for profiles of nine telecoms operators’ strategies in the healthcare vertical.

Our research into the telecoms industry’s investment priorities in 2021 shows that the accelerated uptake of digital health solutions throughout the COVID pandemic has only shifted health further up the priority list for operators.

Figure 1: Digital health is among telcos’ top investment priorities in 2021

digital health telecoms priority

Source: STL Partners, Telecoms priorities: Ready for the crunch?

However, few operators have put their full effort into driving the transformation of healthcare delivery and outcomes through digital solutions. From our conversations with operators around the world, we believe this is in large because they are not yet fully convinced that addressing the challenges associated with transforming healthcare – fragmented and complex systems, slow moving public processes, impact on human lives – will pay off. Are they capable of solving these challenges, and is the business opportunity big enough to justify the risk?

Taking a cautious “wait and see” approach to developing a digital health business, launching a couple of trials or PoCs and seeing if they deliver value, or investing in a digital health start-up or two, may have been a viable approach for operators before the COVID pandemic hit, but with the acceleration in digital health adoption this is no longer the case. Now that COVID has forced healthcare providers and patients to embrace new technologies, the proof points and business cases the industry has been demanding have become a lot clearer. As a result, the digital health market is now four years ahead of where it was at the beginning of 2020, so operators seeking to build a business in healthcare should commit now while momentum and appetite for change is strong.

Enter your details below to request an extract of the report

How is COVID changing healthcare delivery?

The first and most significantly affected area of the digital health landscape throughout 2020 was virtual consultations and telehealth, where almost overnight doctors shifted as many appointments on to phone or video calls as possible. For example, in the UK the proportion of doctor’s visits happening over the phone or video rose from around 13% in late 2019 to 48% at the peak of the pandemic in April-June 2020, while US based virtual consultation provider Teladoc’s total visits tripled between Q219 and Q220, to 2.8mn.

By necessity, regulatory barriers to adoption of virtual consultations were lowered. Other barriers, such as insurers or governments not reimbursing or underpaying doctors for virtual appointments, and organisational and culture barriers among both patients and providers also broke down. The knock on effect has been acceleration across the broader digital health market, in areas such as remote patient monitoring and population level analytics. (See more on the immediate impact of COVID on digital health in STL article How COVID-19 is changing digital health – and what it means for telcos)

The key question is how much of an impact has COVID had, and will it last over the long term? This is what we aim to answer in this report and the accompanying global database tool. Key questions we address in this analysis are:

  • How much has COVID accelerated adoption of digital health applications?
  • What are the cost savings from accelerated uptake of digital health following COVID?
  • Which digital health application areas have been most affected by COVID?
  • Beyond the COVID impact, what is the total potential value of digital health applications for healthcare providers?
  • Which digital health application areas will deliver the biggest cost savings, globally and within specific markets?

To answer these questions we have built a bottom-up forecast model with a focus on the application areas we believe are most relevant to telecoms operators, as illustrated in Figure 2.

Figure 2: Five digital health application areas for telcos

5 digital health application areas

Source: STL Partners

We believe these are most relevant because their high dependence on connectivity, and needs for significant coordination and engagement with a broad range of local stakeholders to succeed, are well aligned with telecoms operators assets. See this STL Partners article for more detail on why these application areas are good entry points for telecoms operators.

NB We chose to omit the Personal health and wellness application area from our bottom-up model. It is a more generic and global application area than the others, dominated by players such as Google/Fitbit and Apple and with little integration thus far into formal healthcare services. While it is nonetheless an area of interest for telecoms operators, especially those that are seeking to build deeper relationships directly with consumers, it is a difficult entry point for telecoms operators seeking to build a healthcare business. This global and consumer focused nature of this application area also means that it is difficult to find reliable local data and quantify its value for healthcare systems.

What are these forecasts for?

Telecoms operators and others should use this forecast analysis to understand the potential value of digital health, including:

  • The size of the digital health opportunity in different markets
  • The market size for new applications across the four areas we modelled (remote patient monitoring, virtual care and telehealth, diagnostics and triage, data and analytics)
  • The relative size of the opportunities across the four application areas in different countries
  • The pace of digital health adoption and market growth in different countries and application areas

In other words, it shows how big the overall digital health market is, how fast it is growing, and which application areas are most valuable and/or growing fastest.

In a follow-up report, we will expand on this analysis to assess how much of this value telecoms operators specifically can capture.

Enter your details below to request an extract of the report

Recovering from COVID: 5G to stimulate growth and drive productivity

For the accompanying PPT chart pack download the additional file on the left

————————————————————————————————————–

Related webinar: How will 5G transform transport and logistics?

In this webinar, we share learnings from 100+ interviews and surveys with industry professionals. During the presentation we will look to answer:

  • How will 5G accelerate digital transformation of the transport and logistics industry?
  • What are the key 5G-enabled use cases and what benefits could these deliver?
  • What must change within the industry to unlock this transformation?
  • What is the role for telcos – how can they work with industry leaders to increase adoption of 5G and build new revenues beyond core communication services?

Date: Thursday 10th September 2020
Time: 4pm BST

View the webinar recording

————————————————————————————————————–

The 5G opportunity and value to verticals

In October 2019, STL Partners published research highlighting the benefits 5G-enabled use cases could unlock for industries. Our forecast predicted a potential $1.4 trillion increase in global GDP by 2030 across eight key industries.

In this short paper we look to update these numbers and explore new insights and conclusions based on two key factors:

  1. STL Partners has produced new research on the impact of 5G on the transport and logistics industry. This has led to more granular insight on the unique benefits and use cases for this vertical.
  2. COVID has changed the global landscape. It has increased demand for some 5G use cases, such as remote patient monitoring or video analytics solutions that determine if the public are respecting social distancing, but has also brought about economic uncertainty. We reflect these nuances in our updated figures.

5G enabled use cases could increase GDP by $1.5 trillion by 2030 – an increase from our original forecast

Source: STL Partners

5G’s impact on transport and logistics: Fresh analysis and new use cases

In 2019, we deep-dived into the 5G opportunity within two key verticals: healthcare and manufacturing. We have since performed a similar deep-dive on the transport and logistics industry, consisting of primary research with experts in the industry. We interviewed 10 enterprises, solutions providers, and members of 5G testbeds who were focused on transport and logistics, as well as surveying 100+ individuals who work in the industry to test the impact they predicted for three key 5G use cases. We will shortly be publishing a full report on these findings in detail.

We have revised our estimation on the impact of 5G on the transport and logistics industry. In 2019, we predicted 5G enabled use cases could increase the GDP value of the transport and logistics industry by 3.5% in 2030. We now believe the impact could be as high as 6%, though importantly some of these benefits are indirect rather than direct.

New forecasts show a bigger impact to the transport and logistics industry

Source: STL Partners

The three 5G-enabled solutions newly explored in detail in our study were:

  • Real-time routing and optimisation: Sensors collect data throughout the supply chain to improve visibility and optimise processes through real-time dynamic routing and scheduling;
  • Automated last 100 metres delivery: Using drones or automated delivery vehicles for the last ‘hundred yards’ of delivery, where the delivery van acts as a mobile final distribution point;
  • Connected traffic infrastructure: Smart sensors or cameras are integrated into traffic infrastructure to collect data about oncoming traffic and trigger real-time actions such as rerouting vehicles or changing traffic lights.

Benefits from these use cases include fewer traffic jams, more efficient supply chains, less fuel required and fewer accidents on the roads.

COVID has changed the landscape and appetite for 5G services

COVID-19 has caused a global economic slowdown. There has been a widespread fall in output across services, production, and construction in all major economies. Social distancing and nationwide lockdowns have led to a significant fall in consumer demand, to business and factory closures, and to supply chain disruptions. The pandemic’s interruption to international trade has far exceeded the impact of the US-China trade war and had a major impact on national economies. Lower international trade, coupled with a precipitous fall in passenger air travel, has also caused the air industry to enter a tailspin.

Table of Contents

  • Preface
  • The 5G opportunity: Updated forecast on value to verticals
  • 5G’s impact on transport and logistics: Fresh analysis and new use cases
    • Increased productivity through more efficient roads: An impact beyond transport and logistics
  • COVID has changed the landscape and appetite for 5G services
    • COVID has impacted the GDP of every country – and outlook for recovery is still unclear
    • Operators’ 5G strategies and roll out have also been impacted
    • Appetite for 5G-enabled healthcare services has been accelerated
  • Conclusion: Where next for the industry?

A3 for telcos: Mapping the financial value

What is analytics, AI and automation worth to telecoms operators?

This report is the second in a two-part series mapping the process and assessing the financial value of automation, analytics and artificial intelligence (AI) in telecoms. In the first report, The value of analytics, automation and AI for telcos – Part 1: The telco A3 application map, we outlined which type of technology was best suited to which processes across a telco’s operations.

In this report, we assess the financial value of each of the operational areas, in dollar terms, for an average telco. Based on our assessment of operator financials and operational KPIs, the figure below outlines our assumptions on the characteristics of an “average” telco used as the basis for our financial modelling. The characteristics of this telco are as shown below, with a slight skew towards developed market operator characteristics since this is currently where most industry proof points used in our modelling have been implemented.

The characteristics of an average telco

characteristics of an average telco

Source: STL Partners, Charlotte Patrick Consult

The first report in the series analysed how each A3 technology could be applied similarly across different functional units of a telecoms operator, e.g. machine learning or automation each have similar processes in network management, channel management and sales and marketing.

Evaluating AI and automation use cases in four domains

To measure financial impact, this report returns to a traditional breakdown of value by functional unit within the telco, breaking down into four key areas:

  1. Network operations: Network deployment, management and maintenance, and revenue management
  2. Fraud: Including services, online, and internal fraud risks
  3. Customer care: Including all assisted and unassisted channels
  4. Marketing and sales: Understanding customers, managing products, marketing programs, lead management and sales processes.

Through an assessment of nearly 150 individual process areas across a telecoms operator’s core operations, we estimate that A3 can deliver the average telco more than $1 billion dollars in value per year, through a combination of revenue uplift and opex and capex savings, equivalent to 7% of total annual revenues.

As illustrated below, core network operations management accounts for by far the greatest proportion of the value.

The relative value of automation, AI and analytics across telco operations

The relative value of AI, automation and analytics across telco operations

Source: STL Partners, Charlotte Patrick Consult

This likely still underrepresents the total, long term potential value of A3 to telcos, since this first iteration does not model the value of A3 processes in areas less unique to telecoms, including supply chain, finance, IT and HR. No doubt that even within the core area of operations, there are potential process areas that have yet to be discovered or proven, and which we have overlooked in our initial attempt to model the value of A3 to telcos. Meanwhile, this is focused purely on telco’s internal operations so also excludes any potential revenue uplift from new A3-enabled services, such as data monetisation or development of AI-as-a-service type solutions.

That said, operators cannot implement all of these processes at once. The enormous challenge of restructuring processes to be more automated and data-centric, putting in place the data management and analytics capabilities, training employees and acquiring new skills, among many others, means that while many leading telcos are well on their way to capturing this value in some areas, very few – if any – have implemented A3 across all process areas. As a benchmark, Telefónica is an industry leader in leveraging automation and AI to improve operational efficiency, and in 2019 it reported total operational savings of €429mn across the entire group. While this is primarily focused on customer facing channels, so likely excludes the value of A3 in many network operations processes, for instance energy efficiency which is delivering significant value to Telefónica and others, it suggests there remains lots of value still to capture.

Enter your details below to request an extract of the report

Methodology

The financial modelling for the value of A3 was done through an individual assessment of each of the 150+ process areas to understand the main activities within that area of operations, and how automation, analytics and/or machine learning and other AI technologies could be used within those activities. From there, we assess the value of integrating these technologies to existing operational functions to make them more efficient and effective. This means that we do not attribute any additional value to telcos from implementing new technologies that include A3 as a core element of their functionality, e.g. a multi-domain service orchestrator, implemented as part of software-defined networking.

Our bottom up assessment of each process is also validated through real-world proof points from operators or vendors. This means that more speculative areas of A3 application in operators are calculated to offer relatively limited value. As more proof points emerge, we will incorporate them into future iterations.

Table of contents

  • Executive Summary
    • Where is the largest financial benefit from A3?
    • What should telcos prioritise in the short term?
    • How long will it take for telcos to realise this value?
    • What next?
  • Introduction
    • Methodology
  • Breaking down the value of A3 by operational area
    • Network, OSS and BSS
    • Fraud management
    • Care and commercial channels
    • Marketing and sales
  • Conclusions and recommendations

Enter your details below to request an extract of the report

Curtailing carbon emissions – Can 5G help?

With big data traffic, comes big energy costs

In 2009, mobile phone networks carried 91 Petabytes (that’s 9.1×1016 bytes) of data per month. Ten years later, mobile networks are estimated to carry around 30 Exabytes of data per month. That’s 30 x1019 bytes or 15 billion HD movies, or an average of 2.5 movies for the 6 billion smartphone users on the planet. This represents an increase of over 330-fold in data traffic. This rapid increase in data carried by mobile networks is projected to slow, but even a reduction in CAGR to 30% a year would see volumes reaching over 130 Exabytes a month in 5 years.

This increase in data travelling over mobile networks reflects the increasingly data-heavy applications running on mobile devices as well as the increasing penetration of smartphones in many developing markets. Although enterprises and public sector firms will also drive demand for mobile data, this is minor compared to consumer user demand. As mobile device penetration rates continue to increase and mobile device owners adopt more data heavy applications such as video streaming and immersive experiences, growth in volumes will continue far past 2024 and we could easily still see a 20-fold increase over current levels over the next 10 years.

In many ways this is exciting, as more computing power reaches the hands of more people around the world delivering applications that help billions of people in their daily lives. But this comes with a caveat – there is an input inherent in delivering this data traffic: the energy needed for running the network infrastructure.

The electrical energy required to power networks represents a cost to operators, but it also represents CO2 emissions arising from burning fossil fuels to power the network (either directly from local dedicated generators or through the power grid). Greenhouse gas emissions therefore also risk increasing significantly as a result of data growth, particularly in countries heavily dependent on fossil fuels for their electricity production. Previously, this has been managed by the fact that mobile networks have been optimised to support larger amounts of data with a similar topology in terms of infrastructure, if slightly higher energy needs and costs. However, as spectrum is a limited resource, continued growth of mobile traffic over current LTE networks would quickly lead to densification – an increased amount of antenna and network infrastructure – by some estimates this would be an increase of 160% by 2025.

Even with improvements in hardware performance, growth in mobile data over LTE networks would result in significant growth in energy consumption which represents a significant source of emissions. This is at odds with the goals that operators have set for themselves in terms of greenhouse gas emissions and risks breaching the standards to which (consumer, public and private sector) customers are increasingly holding their suppliers. Investors are also factoring in the higher risk profile associated with companies with high carbon emission exposure5. Finally, this also matters to employees – particularly younger ones with the digital skills-sets that operators are looking to attract.

The key question posed by this dilemma then is: How should mobile network operators deal with this rapid rate of growth in data and the associated energy consumption and CO2 emissions?

In this report, we focus on one part of the answer – accelerating the adoption of more energy efficient 5G technologies and associated operational practices. A faster roll-out of 5G networks is a key weapon in operators’ arsenal of measures for de-coupling energy costs and carbon emissions arising from data growth.


Scope of this report

Network operators need to mitigate the ever-increasing energy costs and carbon footprint of their networks resulting from the forecast data growth in some way. There are six ways that the accelerated adoption of 5G can do this:

  1. Direct curtailment of energy consumption in mobile access networks through the better energy “performance” of 5G network equipment and operational practices relative to 4G.
  2. Direct curtailment of energy consumption in 5G core networks through the better energy “performance” of network equipment and operational practices relative to 4G core networks.
  3. Reduced energy consumption by devices (particularly smartphones and IoT devices).
  4. Decarbonising the grid: indirectly enabling lower levels of national carbon emissions from electricity generation through 5G supported “smart-grid” applications, increasing the proportion contributed by renewables and improving wider efficiencies in distribution and non-renewables generation.
  5. Indirectly improving energy efficiency across all sectors through reducing waste and improving operations. Reduced emissions are largely a by-product of improved productivity and process efficiencies.
  6. Reducing carbon emissions from travel through reducing the number of journeys (e.g. remote monitoring and management, virtual meetings) and reducing the emissions per journey.

Areas where 5G could impact global carbon emissions

Areas where 5G could impact global carbon emissions

Source: STL Partners

In this report, we focus on the first two – the management of energy consumption via increasing the carbon performance of the network (expressed as a reduction in the tonnes of CO2 per TB of data transmitted). While we see significant potential upside in “de-carbonising the grid”, in enabling greater energy efficiencies and reducing waste across the economy, these are not in operators’ direct control. They are also more challenging to estimate. We would recommend this form part of a future study.

For nearly all operators, over 90% of the direct energy usage of network operators is accounted for via electricity drawn from the grid to service their own networks. Limiting the growth of this would represent the largest direct reduction in future greenhouse gas production for a mobile network.

Four scenarios modelled

We have modelled our analysis around four 5G scenarios. We treat each of these scenarios differently in our model and scenario assumptions vary by country type.

No 5G roll out

No 5G roll out assumes that there is no roll out of 5G radio access or core technologies. This scenario shows emissions growth well below the growth in data volumes. This is because we anticipate reductions from lower-carbon power generation (e.g. renewables) and significant performance improvements in 4G core and access networking. These are discussed at length in this report.

Slow 5G rollout

A slow roll out of 5G would see the most delayed launch dates for 5G (between 2021 and 2024) and assumes that 5G accounts for the lowest share of data volumes over time (10-25% by 2025 and 60- 80% by 2030).

Medium 5G rollout

A medium roll out of 5G can be considered a base-case. This would see an average launch date of 2019-2022. There would see a significant volume of data running over 5G – up to 60% by 2025 and 85% by 2030. Implicitly, we would expect decommissioning of 2G or 3G (or even 4G) networks with spectrum re-farming to 5G.

Table of Contents

  • Preface
  • Executive Summary
  • Introduction
    • Scope of this report
  • Four scenarios modelled
  • Our findings
    • Faster 5G roll out could reduce cumulative carbon emissions by 0.5 billion tonnes of CO2 globally by 2030
  • How will accelerating 5G roll-out reduce carbon emissions from mobile networks?
    • 5G technologies as drivers of sustainability
  • Country level findings: Uneven distribution of carbon savings
  • Conclusions and Recommendations
    • Operators
    • Regulators and other national authorities
    • Tower and power suppliers
    • Technology providers
  • Methodology
    • Projections
    • Scenarios
    • Country level differences
    • Other Assumptions
  • Appendix

Table of Figures

  • Figure 1: Faster 5G roll-out would have a material impact on greenhouse emissions
  • Figure 2: Areas where 5G could impact global carbon emissions
  • Figure 3: Cumulative reduction in emissions under different roll-out scenarios
  • Figure 4: Projected CO2 emissions from mobile networks under 4 scenarios
  • Figure 5: Where do emissions reductions come from
  • Figure 6: Access technologies’ evolving energy performance
  • Figure 7: Carbon intensity of different countries used in modelling emissions
  • Figure 8: Potential reduction in emissions from fast roll-out of 5G against carbon intensity of grid
  • Figure 9: Top 30 Countries by potential reduction in emissions from fast 5G roll-out
  • Figure 10: STL’s carbon emissions methodology

Telcos’ Last Chance in Cloud? New $18bn Sovereign Cloud Opportunity

Preface

As we predicted in our 2012 report Cloud 2.0: Telco Strategies in the Cloud, operators have struggled to provide generically competitive cloud services, with those looking to provide infrastructure-as-a-service (IaaS) losing out to the larger hyperscale players (e.g. Amazon Web Services, Microsoft Azure). The majority of telcos have therefore reduced their focus and ambition within cloud (infrastructure) services over the last number of years.

However, recent legal and market developments and the emergence of new technologies are changing the cloud delivery model. The rescinding of the US-EU Safe Harbour agreement and the sovereign data trustee solution launched by Microsoft & Deutsche Telekom have put a spotlight on the need for sovereign cloud solutions that are better equipped to protect data. Operators are well-positioned to deliver and support these solutions but will need to act fast to ensure their role in the value chain.

Furthermore, new technologies (e.g. 5G, SDN/NFV) and requirements (e.g. low latency) may lead to the decentralisation of the current hyperscale data centre model, moving more computing power to the edge of the network (see How 5G is Disrupting Cloud and Network Strategy Today). This change in the architecture may lead to a long-term advantage for telcos.

In order to better understand data sovereignty requirements around the world and the potential opportunity for ‘sovereign’ cloud services, STL Partners (STL) conducted industry research. This research consisted of c.30 interviews with software-as-a-service (SaaS) providers, software companies, enterprises, public sector bodies, telecom operators and cloud service providers. This report presents and discusses the findings of this research.

The research programme was sponsored by Ericsson. This report and analysis was independently produced by STL Partners.

Introduction: The Return of Telco Cloud…

The telecoms industry has been undergoing a transformation process for much of the last decade. The threat from new players has marginalized the core communications business and operators have looked to gain traction and grow revenues through the provision of new services in adjacent areas, with one such area being cloud computing.

Cloud computing has ripped through the traditional IT infrastructure model, providing greater flexibility, enabling the pooling of resources and potentially reducing both capex and opex. This new delivery model has led to the development of new services and business models (e.g. ‘as-a-service’ models), disrupting how individuals consume services and how organisations do business.

The rise of cloud computing is a trend set to continue; indeed, STL Partners forecast that cloud IT infrastructure spending will equal spend on traditional IT infrastructure by 2020 (Figure 3).

Figure 3: Cloud IT infrastructure is rapidly gaining on traditional IT infrastructure

Source: IDC base figures; STL Partners analysis

Telcos have not remained oblivious to this industry transformation. Some (principally fixed-line) operators have a legacy providing IT outsourcing services and have looked to build on this footing, providing and managing infrastructure for cloud services, whilst others have partnered with cloud software providers to deliver new services to customers.

So far operators’ experiences offering cloud services have been mixed, with operators typically finding more success through partnerships. Rather than attempting to build their own cloud solutions operators have typically partnered with SaaS providers, such as Microsoft (e.g. Office 365) and Google (e.g. Google Apps for Work), acting as resellers of the software, potentially creating appealing bundles for enterprise customers.

On the other hand telcos attempting to provide IaaS, which one might intuitively think is more closely aligned to a telco’s core capabilities, have typically found that they have not been able to compete head-on with the larger IaaS providers (e.g. Amazon Web Services). Simply speaking, it has become a game of scale, with single operators or even telco groups unable to match the resources and investment of the hyperscale players. Indeed in our November 2014 report, Cloud: What is the role of telcos in cloud services in 2015?, we highlighted the challenge with telcos competing against the larger IaaS players:

“Pushing for pureplay IaaS solutions (Compute, Memory, Storage etc) is not going to be a sensible option for the majority of telcos. As an example of how hard it is to compete here, RackSpace came from a managed hosting/co location background and moved into IaaS, even collaborating on a virtualisation initiative that became OpenStack. But earlier in 2014, after spending less on IaaS investment than Microsoft or Google spend on infrastructure in a quarter, it announced it was going to refocus its efforts on its earlier product success with managed hosting and colocation because it was more able to differentiate itself from the other vendors who have significantly lower pricing.”

Telcos competing in infrastructure have therefore typically shifted their focus away from public cloud IaaS (competing against the larger providers) to more private cloud infrastructure and traditional managed hosting services. Despite mixed performance with IaaS services, albeit with exceptions in regions where the big IaaS players are not well established and where telcos can differentiate their offering (e.g. Telstra), there perhaps remains a still sizable opportunity, particularly as telcos begin to transform their networks.

This transformation involves the virtualisation of the network, embracing software defined-networking (SDN) and network functions virtualisation (NFV). As operators harness the power of these new technologies and associated business practices they will develop and implement the infrastructure, software and capabilities to deliver more advanced services through more efficient, automated and programmable networks. Operators in turn will be able to draw on these assets and associated skills to improve how they run and manage their cloud infrastructure.

Furthermore, as the industry develops and implements more advanced networks (i.e. 5G), there exists a potential advantage for telco infrastructure services due to the need for more localised delivery of service. The Next Generation Mobile Networks (NGMN) Alliance highlights that 5G should provide, “much greater throughput, much lower latency, ultra-high reliability, much higher connectivity density, and higher mobility range.”

STL Partners laid out a potential vision for 5G and network transformation in the report, How 5G is Disrupting Cloud and Network Strategy Today. To summarise the report, latency targets/requirements (how long it takes the network to respond to user requests) for 5G are very low; the target is 10ms end-to-end, 1ms for special use cases requiring low latency, or 50ms end-to-end for the “ultra-low cost broadband” use case. An example use case where low-latency could be very important could be communication between self-driving cars.

In order to meet these lofty requirements for latency the current delivery model may need to be rethought. Latency is limited by the time it takes to travel to the server and back at the speed of light; latency is therefore inherently linked to distance. In the 5G report, we explored the impact of these latency targets on the required distance of servers from users:

“The rule of thumb for speed-of-light delay is 4.9 microseconds for each kilometre of fibre with a refractive index of 1.47. 1ms – 1000 microseconds – equals about 204km in a straight line, assuming no routing delay. A response back is needed too, so divide that distance in half. As a result, in order to be compliant with the NGMN 5G requirements, all the network functions required to process a data call must be physically located within 100km, i.e. 1ms, of the user. And if the end-to-end requirement is taken seriously, the applications or content that they want must also be hosted within 1000km, i.e. 10ms, of the user. (In practice, there will be some delay contributed by serialisation, routing, and processing at the target server, so this would actually be somewhat more demanding.)”

To deliver these latency requirements a radical change to the architecture of the network is needed as well as a change in how compute and storage infrastructure is managed. Content and applications that are within the 100km contour will have a competitive advantage over those that don’t take account of latency. The impact of this could lead to the decentralisation of the current hyperscale data centre model, moving more computing power to the edge of the network. This change in the architecture and delivery model may lend telcos an advantage in the infrastructure marketplace.

Figure 4: Shifting the balance in favour of more localised infrastructure

Source: STL Partners

Whilst telcos will not wrestle control of the infrastructure marketplace overnight, telcos, as they embark on their transformation process, should look to make inroads towards this vision. Indeed there are current market challenges that telcos could immediately address (and are addressing) through their localised infrastructure, creating a stepped/phased approach towards the future vision of a localised cloud delivery model.

Into this rapidly evolving context steps the long-standing challenge of data sovereignty. Data sovereignty requirements are regulations that consider the implications of geographical location of data and place restrictions on the movement of certain types of data across borders. The recent ruling rescinding the US-EU Safe Harbour Agreement has put a spotlight on the issue of data privacy and data sovereignty and new approaches taken by technology players are highlighting that this is a problem that needs to and is being solved (i.e. Microsoft’s decision to create a German sovereign version of Azure). Operators are natural candidates to play a role here and should look to better understand how they can form part of the value chain in the provision of locally trusted IaaS solutions.

This report analyses data sovereignty requirements around the world and explores the potential opportunity for ‘sovereign’ cloud services as a further ‘nudge’ towards a more localised cloud delivery model.


  • Preface
  • Executive Summary
  • The Return of Telco Cloud…
  • Understanding Data Sovereignty
  • Which Sectors Have the Strongest Sovereignty Requirements?
  • A Range of (Cloud) Solutions can Address Sovereignty Needs
  • 75% of Interviewees were Interested in Sovereign Cloud Solutions
  • Where is Data Sovereignty Important?
  • How could this Evolve?
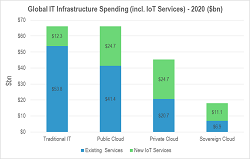
  • Market Sizing: Sovereign Cloud could be Worth between $7-18bn in 2020
  • Why Telcos are Well Positioned to Address the ‘Sovereign’ Opportunity
  • Conclusions


  • Figure 1: A shift in the cloud delivery model may be occurring
  • Figure 2: Sovereign cloud has the potential to represent over X% of the cloud infrastructure marketplace
  • Figure 3: Cloud IT infrastructure is rapidly gaining on traditional IT infrastructure
  • Figure 4: Shifting the balance in favour of more localised infrastructure
  • Figure 5: How much data does Facebook store about you?
  • Figure 6: STL Industry Research Programme – Breakdown of interviewees
  • Figure 7: The significant majority of interviewees have encountered sovereignty requirements
  • Figure 8: More-regulated sectors are more likely to encounter restrictions
  • Figure 9: Infrastructure Deployment Models
  • Figure 10: The applicability of cloud deployment models to meet sovereignty requirements
  • Figure 11: The majority of Interviewees saw demand for sovereign cloud
  • Figure 12: More strictly regulated sectors are more interested in sovereign cloud solutions
  • Figure 13: Indicative map of data sovereignty requirements across the globe
  • Figure 14: Overview of data sovereignty requirements across regions
  • Figure 15: The rise of IoT could lead to increased demand for sovereign cloud
  • Figure 16: Sovereign cloud could be worth between $7-18bn in 2020
  • Figure 17: North America represents the biggest market for sovereign cloud
  • Figure 18: Sovereign cloud in the Middle East & Africa potentially represents the greatest proportion of cloud infrastructure spending
  • Figure 19: Government represents the largest market for sovereign cloud for existing services and Healthcare for sovereign cloud incl. IoT services
  • Figure 20: Healthcare is the largest sector for sovereign cloud as a percentage of spend on IT infrastructure

Euro telcos: fiddling while the platform burns?

Summary: Most executives across the European telecoms industry accept that the current telco business model is in decline (the ‘burning platform’), but wholehearted action to create sustainable new models is not in place. We identify the key barriers and next steps to overcome them in this top-level analysis of findings from our recent EMEA Executive Brainstorm. (July 2012, Executive Briefing Service, Transformation Stream.)

UK Services Revenues: Actual and Forecast (index)

  Read in Full (Members only)   To Subscribe click here

Below is an extract from this 16 page Telco 2.0 Report that can be downloaded in full in PDF format by members of the Telco 2.0 Executive Briefing service and the Telco 2.0 Transformation stream here. Non-members can subscribe here and for this and other enquiries, please email contact@telco2.net / call +44 (0) 207 247 5003.

To share this article easily, please click:


Executive Summary

The Burning Platform

It was clear at the Telco 2.0/New Digital Economics Brainstorm in London a few weeks ago that most executives across the European telecoms industry accept that the current telco business model is in decline (the ‘burning platform’), but wholehearted action to create sustainable new models is not in place. 

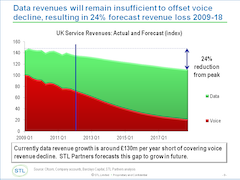
Figure 1 – The burning platform illustrated: e.g. forecast decline in UK revenues

UK Services Revenues: Actual and Forecast (index)

Source: Presentation by Chris Barraclough, Chief Strategist and MD Telco 2.0

Two thirds of delegates thought this leading indicator forecast ‘about right’ or ‘too optimistic’.

Telcos need to act more decisively

The core message to the leaders of the European telecoms industry is that they must make a more concerted effort to change direction now or will have much less control over their future destinies.

Some telcos are taking steps, but even the most advanced are still in experimental mode, and the rest somewhere between strategic slide-ware and tacit acceptance of a future as a ‘pipe’.

As well as prudent re-pricing of data and diligence in cost and efficiency management, the primary opportunities for telcos are to re-conceive the core communications proposition, re-define the overall experience of being a telco customer and ultimately to create interoperable multi-sided business models that help 3rd parties and end-users (people, organisations and devices) connect in more efficient and effective ways. These actions will create a more valuable and defensible role for telcos in the emerging digital economy.

Overcoming industry inhibitions

To progress, the industry needs to overcome the following challenges:

  • Time is short. Delegates perceived that telcos had significantly less time to secure strategic control points in the digital economy than at previous brainstorms. Telcos need to act more decisively now in payments, advertising, creating new forms of ‘OTT’ communications, identity and cloud services.
  • Money is hard to find. The business cases for some of the new models are complex and the economics are different from traditional telco business models. We know because we have been working on many recently, and have also been recommending important new evaluation metrics. It’s not straightforward, nor is it easy to fill the gap left by the predicted decline in the current model, but it is possible to create new value.
  • Technology is a tool, not a strategy. The business case for LTE, for example, is hard to make without new service revenues in addition to access, which somewhat begs the question of who and what is leading this major industry investment. 
  • The right people are hard to find. 95% of delegates thought there is a serious shortage of the internal skills needed to manage, innovate and deliver very different types of propositions. Understanding, addressing and filling this gap is a vital priority.
  • Customers will not solve the industry’s problems. Most customers – upstream and downstream – do not understand how telcos could help them in new ways. Our research shows a range in comprehension and belief in telcos’ abilities, so telcos need to work harder to create and sell new solutions.
  • It’s tricky to organise innovation and change at scale. The operators that are starting to take action face a complex organisational challenge: should innovation be built into the core business or established in a new unit? In the core it is closer to the heart but also more vulnerable to the organisation’s white blood cells (the ones that attack unrecognised intruders). In a separate unit it’s easier to grant more freedoms but it’s much more difficult to integrate and change the core. 
  • Collaboration: the Prisoners’ Dilemma. Many of the new business models will only work effectively if telcos cooperate on a common approach. This is usually slow and difficult (witness the slow progress of RCS-e and the demise of WAC). There is also regulatory uncertainty around industry collaboration, and fear of the regulator is quite reasonably a powerful internal inhibitor in telcos. Additionally, some players perceive they could achieve competitive advantage by ‘going it alone’. A way through this dilemma needs to be navigated, and our recent analysis suggests some new ways to think about this.
  • It’s hard to change a winning formula (even when you are losing). Financial markets have been keen on telcos’ relative stability and cash flows in turbulent economic times. At the same time there are also those high up in telco organisations who have known nothing but success with the existing model and who will argue to defend the status quo. Yet the financial markets, well known as fickle and irrational beasts, will at some point start to be much more sensitive to the structural change in the telco industry and seek a new direction. Unreasonably perhaps, they will expect change to happen quickly, and if this is not apparent, they will demand new leaders but by then it may be too late.

Next steps for STL Partners and Telco 2.0

Telco 2.0 first described the core challenges facing the industry six years ago in ‘How to make money in an IP world‘, and proposed the ‘two-sided telecoms business model‘ as a key part of the solution four years ago. Over the last year we have published the ‘Roadmap to New Telco 2.0 Business Models‘ describing core innovations needed, and ‘Dealing with the Disruptors – Google, Apple, Facebook, Skype and Amazon‘ outlining strategies in the adjacent competitive landscape.

We’re now driving a range of implementation projects with individual players and collaborative consortiums and will be publishing a further detailed Telco 2.0 implementation guide later this year. Through our research we will also be benchmarking telcos’ strategies, to help the capital markets better understand how to make investment choices in the industry, and looking in-depth at creative strategies in voice and messaging, m-commerce, cloud services and M2M, as well as continuing our work with the World Economic Forum on one of the biggest prizes, how telcos can play a pivotal role in enabling the emergence of a new class of economic asset, ‘Personal Data‘.

We will also be running further invitation only Executive Brainstorms in Dubai (November 6-7, 2012), Singapore (4-5 December, 2012), Silicon Valley (19-20 March 2013), and London (23-24 April, 2013). Email contact@stlpartners.com or call +44 (0) 207 243 5003 to find out more.    

Support for Key Findings

The Platform is burning

Figure 2 – Delegates broadly agreed with STL’s UK Revenue forecast

STL Partners UK Revenue Forecast (June 2012)

Chris Barraclough, MD and Chief Strategist, Telco 2.0 / STL Partners, presented an example analysis of voice and data revenues from the UK market, and predicted a 24% decline from the peak in 2009 to 2018.

Delegates broadly supported this analysis, with over half saying they thought this was ‘about right’. We will be conducting and publishing further analysis in the top 5 European markets over the next few months.

NB The original ‘burning platform’ reference comes from this article describing a choice between certain death and possible death, and is now used to describe a situation where people are forced to act by dint of the alternative being somewhat worse. Nokia recently made ‘burning platform’ a famous phrase in the handset part of the telecoms sector, but it’s now relevant to telcos themselves as they face significant declines in their core revenues.

To read the note in full, including the following sections detailing support for the analysis…

  • Time is short
  • Money is hard to find
  • The right people are hard to find
  • Customers will not solve the industry’s problems
  • It’s tricky to organise innovation and change at scale
  • Collaboration: the Prisoners’ Dilemma
  • It’s hard to change a winning formula (even when you are losing)
  • Next steps

…and the following figures…

  • Figure 1 – The burning platform illustrated: e.g. forecast decline in UK revenues
  • Figure 2 – Delegates broadly agreed with STL’s UK Revenue forecast
  • Figure 3 – Time is running out for telcos
  • Figure 4 – The business case for Telco OTT Voice and Messaging is complex
  • Figure 5 – Telcos need to transform skills, systems, structures and incentives
  • Figure 6 – Upstream customers’ views on telco capabilities
  • Figure 7 – KPN is building innovation into the core rather than a separate business unit
  • Figure 8 – The Prisoners’ Dilemma
  • Figure 9 – It’s difficult to get the timing of new investments right 

Members of the Telco 2.0 Executive Briefing Subscription Service and the Telco 2.0 Transformation stream can download the full 16 page report in PDF format hereNon-Members, please subscribe here. For this or other enquiries, please email contact@telco2.net / call +44 (0) 207 247 5003.

Cloud 2.0: don’t blow it, telcos

Summary: enterprise cloud computing services need great connectivity to work, but there are opportunities for telcos to participate beyond the connectivity. What are the opportunities, how are telcos approaching them, and what are the key strategies? Includes forecasts for telcos’ shares of VPC, IaaS, PaaS and SaaS. (September 2011, Executive Briefing Service, Cloud & Enterprise ICT Stream) Apps & Telco APIs Figure 1 Drivers of the App Market Telco 2.0 Sept 2011
  Read in Full (Members only)    To Subscribe

Below is an extract from this 28 page Telco 2.0 Report that can be downloaded in full in PDF format by members of the Telco 2.0 Executive Briefing service and the Cloud and Enterprise ICT Stream here. Non-members can subscribe here, buy a Single User license for this report online here for £795 (+VAT), or for multi-user licenses or other enquiries, please email contact@telco2.net / call +44 (0) 207 247 5003.

To share this article easily, please click:

//

Introduction

In our previous analyses Cloud 2.0: What are the Telco Opportunities? and Cloud 2.0: Telcos to grow Revenues 900% by 2014 we’ve looked broadly at the growing cloud market opportunity for telcos. This new report takes this analysis forward, looking in detail at the service definitions, market forecasts and the industry’s confidence in them, and actual and potential strategies for telcos.

We’ll also be looking in depth at the opportunities in cloud services in the Cloud 2.0: Transforming technology, media and telecoms at the EMEA Executive Brainstorm in London on Thursday 10th November 2011.

The Cloud Market

Cloud computing represents the next wave of IT. Almost all organisations are saying that they will adopt cloud computing to a greater or lesser extent, across all segments and sizes. Consequently, we believe that there exists a large opportunity for telcos if they move quickly enough to take advantage of it.

Total market cloud forecasts – variation and uncertainty

In order to understand where the best opportunities are and how telcos can best take use their particular strengths to advantage of them, we need to examine the size of that opportunity and to understand which areas of cloud computing are most likely to offer the best returns.

Predictions for the size and growth of the cloud computing market are very diverse:

  • Merrill Lynch has previously offered the most optimistic estimate: $160 billion by the end of 2011 (The Cloud Wars: $100+ billion at stake, May 2008)
  • Gartner predicted expenditure of $150.1 billion by 2013 (Gartner forecast, March 2009)
  • IDC predicts annual cloud services revenues of $55.5 billion in by 2014 (IDC report, June 2010)
  • Cisco has estimated the cloud market at $43 billion by 2013 (STL Partners video, October 2010)
  • Bain expects spending to grow �?vefold from $30 billion in 2011 to $150 billion by 2020 (The Five Faces of the Cloud, 2011)
  • IBM’s Market Insights Cloud Phase 2 assessment of September 2011 sizes the cloud market at $88.5bn by 2015
  • Of that total, research by AMI Partners suggests that SMBs’ share of that spend will approach $100 billion by 2014 – over 60 % of the total (World Wide Cloud Services Study, December 2010)

Figure 1 – Cloud services market forecast comparisons

Cloud 2.0 Industry Forecast Comparisons Bain, Gartner, IDC, Cisco Sept 2011 Telco 2.0

Source: Bain, Cap Gemini, Cisco, Gartner, IBM, IDC, Merrill Lynch

Whichever way you look at it, the volume of spending on cloud computing is high and growing. But why are there such large variations in the estimates of that growth?

There is a clear correlation between the report dates and the market forecast sizes. Two of the forecasts – from Merrill Lynch and Gartner – are well over two years old, and are likely to have drawn conclusions from data gathered before the 2008 recession started to bite. Both are almost certainly over-optimistic as a result, and are included as an indication of the historic uncertainty in Cloud forecasts rather than criticism of the forecasters.

More generally, while each forecaster will be using different assumptions and extrapolation techniques, the variation is also likely to reflect a lack of maturity of the cloud services market: there exists little historical data from which to extrapolate the future, and little experience of what kinds of growth rates the market will experience. For example, well-known inhibitors to the adoption of cloud, such security and control, have yet to be resolved by cloud service providers to the point where enterprise customers are willing to commit a substantial volume of their IT spending.

Additionally, the larger the organisation, the slower the adoption of cloud computing is likely to be; it takes a long time for large enterprises to move to a new computing model that involves changing fundamental IT architectures and will be a process undertaken over time. It is hard to be precise about the degree to which they will inhibit the growth of cloud acceptance.

As a result, in a world where economic uncertainty seems unlikely to disappear in the short to medium term, it would be unwise to assume a high level of accuracy for market sizing predictions, although the general upward trend is very clear.

Cloud service types

Cloud computing services fall into three broad categories: infrastructure as a service (IaaS), platform as a service (PaaS) and software as a service (SaaS).

Figure 2 – Cloud service layer definitions

Cloud 2.0 Service Types vs. layers Telco 2.0 Sept 2011

Source: STL Partners/Telco 2.0

Of the forecasts available, we prefer Bain’s near term forecast because: 1) it is based on their independent Cloud ‘Center of Excellence’ work; 2) it is relatively recent, and 3) it has clear and meaningful categories and definitions.
The following figure summarises Bain’s current market forecast, split by cloud service type.

Figure 3 – Cloud services: market forecast and current players

Cloud 2.0 Forecast growth by service type Sep 2011 Telco 2.0

Currently, telcos have around a 5% share of the c.$20 billion annual cloud services revenue, with 25 % CAGR forecast to 2013.

At the May 2011 EMEA Telco 2.0 Executive Brainstorm, we used these forecasts as a base to explore market views on the various cloud markets. There were c.200 senior executives at the brainstorm from industries across Telecoms, Media and Technology (TMT) and, following detailed presentations on Cloud Services, they were asked highly structured questions to ascertain their views on the likelihood of telco success in addressing each service.

Infrastructure as a Service (IaaS)

IaaS consists of cloud-based, usually virtualised servers, networking, and storage, which the customer is free to manage as they need. Billing is typically on a utility computing model: the more of each that you use, the more you pay. The largest of the three main segments, Bain forecasts IaaS to be worth around $3.5 billion in 2011, with 45 % CAGR forecast. The market leader is Amazon with about 18 % share. Other players include IBM and Rackspace. Telcos currently have about 20 % of this market – Qwest/Savvis/Equinix, and Verizon/Terremark.

Respondents at the EMEA Telco 2.0 Brainstorm estimated that telcos could take an average share of 25% of this market. The distribution was reasonably broad, with the vast majority in the 11-40% range.

Figure 4 – IaaS – Telco market share forecasts

Cloud 2.0 IaaS Telco Forecasts Sept 2011 Telco 2.0

Source: EMEA Telco 2.0 Executive Brainstorm delegate vote, May 2011

To read the note in full, including the following additional analysis…

  • Virtual Private Cloud (VPC)
  • Software as a Service (SaaS)
  • Platform as a Service (PaaS)
  • Hybrid Cloud
  • Cloud Service Brokerage
  • Overall telco cloud market projections by type, including forecast uncertainties
  • Challenges for telcos
  • Which areas should telcos target?
  • Telcos’ advantages
  • IaaS, PaaS, or SaaS?
  • Developing other segments
  • What needs to change?
  • How can telcos deliver?
  • Telcos’ key strengths
  • Key strategy variables
  • Next Steps

…and the following charts…

  • Figure 1 – Cloud services market forecast comparisons
  • Figure 2 – Cloud service layer definitions
  • Figure 3 – Cloud services: market forecast and current players
  • Figure 4 – IaaS – Telco market share forecasts
  • Figure 5 – VPC – Telco market share forecasts
  • Figure 6 – SaaS – Telco market share forecasts
  • Figure 7 – PaaS – Telco market share forecasts
  • Figure 8 – Total telco cloud market size and share estimates – 2014
  • Figure 9 – Uncertainty in forecast by service
  • Figure 10 – Telco cloud strengths
  • Figure 11 – Cloud services timeline vs. profitability schematic
  • Figure 12 – Telcos’ financial stability

Members of the Telco 2.0 Executive Briefing Subscription Service and the Cloud and Enterprice ICT Stream can download the full 28 page report in PDF format here. Non-Members, please subscribe here, buy a Single User license for this report online here for £795 (+VAT), or for multi-user licenses or other enquiries, please email contact@telco2.net / call +44 (0) 207 247 5003.

Organisations, people and products referenced: Aepona, Amazon, AMI Partners, Bain, BT, CenturyLink, CENX, Cisco, CloudStack, Deutsche Telekom, EC2, Elastic Compute Cloud (EC2), EMC, Equinix, Flexible 4 Business, Force.com, Forrester, France Telecom, Gartner, Google App Engine, Google Docs, IBM, IDC, Intuit, Java, Merrill Lynch, Microsoft, Microsoft Office 365, MySQL, Neustar, NTT, OneVoice, OpenStack, Oracle, Orange, Peartree, Qwest, Rackspace, Red Hat, Renub Research, Sage, Salesforce.com, Savvis, Telstra, Terremark, T-Systems, Verizon, VMware, Vodafone, Webex.

Technologies and industry terms referenced: Azure, Carrier Ethernet, Cloud computing, cloud service providers, Cloud Services, Communications as a Service, compliance, Connectivity, control, forecast, Global reach, Hybrid Cloud, Infrastructure as a Service (IaaS), IT, Mobile Cloud, network, online, Platform as a Service (PaaS), Reliability, resellers, security, SMB, Software as a Service (SaaS), storage, telcos, telecoms, strategy, innovation, transformation, unified communications, video, virtualisation, Virtual Private Cloud (VPC), VPN.

Cloud 2.0: Telcos to grow Revenues 900% by 2014

Summary: Telcos should grow Cloud Services revenues nine-fold and triple their overall market share in the next three years according to delegates at the May 2011 EMEA Executive Brainstorm. But which are the best opportunities and strategies? (June 2011, Executive Briefing Service, Cloud & Enterprise ICT Stream)

NB Members can download a PDF of this Analyst Note in full here. Cloud Services will also feature at the Best Practice Live! Free global virtual event on 28-29 June 2011.

To share this article easily, please click:

//

Introduction

STL Partners’ New Digital Economics Executive Brainstorm & Developer Forum EMEA took place from 11-13 May in London. The event brought together 250 execs from across the telecoms, media and technology sectors to take part in 6 co-located interactive events: the Telco 2.0, Digital Entertainment 2.0, Mobile Apps 2.0, M2M 2.0 and Personal Data 2.0 Executive Brainstorms, and an evening AppCircus developer forum.

Building on output from the last Telco 2.0 events and new analysis from the Telco 2.0 Initiative – including the new strategy report ‘The Roadmap to New Telco 2.0 Business Models’ – the Telco 2.0 Executive Brainstorm explored latest thinking and practice in growing the value of telecoms in the evolving digital economy.

This document gives an overview of the output from the Cloud session of the Telco 2.0 stream.

Companies referenced: Aepona, Amazon Web Services, Apple, AT&T, Bain, BT, Centurylink, Cisco, Dropbox, Embarq, Equinix, Flexible 4 Business, Force.com, Google Apps, HP, IBM, Intuit, Microsoft, Neustar, Orange, Qwest, Salesforce.com, SAP, Savvis, Swisscom, Terremark, T-Systems, Verizon, Webex, WMWare.

Business Models and Technologies covered: cloud services, Enterprise Private Cloud (EPC), Virtual Private Cloud (VPC), Infrastucture as a service (IaaS), Platform as a Service (PaaS), Software as a Service (SaaS).

Cloud Market Overview: 25% CAGR to 2013

Today, Telcos have around a 5% share of nearly $20Bn p.a. cloud services revenue, with 25% compound annual growth rate (CAGR) forecast to 2013. Most market forecasts are that the total cloud services market will reach c.$45-50Bn revenue by 2013 / 2014, including the Bain forecast previewed at the Americas Telco 2.0 Brainstorm in April 2011.

At the EMEA brainstorm, delegates were presented with an overview of the component cloud markets and examples of different cloud services approaches, and were then asked for their views on what share telcos could take of cloud revenues in each. In total, delegates’ views amounted to telcos taking in the region of 18% by revenue of cloud services at the end of the next three years.

Applying these views to an extrapolated ‘mid-point’ forecast view of the Cloud Market in 2014, implies that Telcos will take just under $9Bn revenue from Cloud by 2014, thus increasing today’s c$1Bn share nine-fold. [NB More detailed methodology and sources are in the full paper available to members here.]

Figure 1 – Cloud Services Market Forecast & Players

Cloud 2.0 Forecast 2014 - Telco 2.0

Source: Telco 2.0 Presentation

Although already a multi-$Bn market already, there is still a reasonable degree of uncertainty and variance in Cloud forecasts as might be expected in a still maturing market, so this market could be a lot higher – or perhaps lower, especially if the consequences of the recent Amazon AWS breakdown significantly reduce CIO’s appetites for Cloud.

The potential for c.30% IT cost savings and speed to market benefits that can be achieved by telcos implementing Cloud internally previously shown by Cisco’s case study were highlighted but not explored in depth at this session.

Which cloud markets should telcos target?

Figure 2 – Cloud Services – Telco Positioning

Cloud 2.0 Market Positioning - Telco 2.0

Source: Cisco/Orange Presentation, 13th Telco 2.0 Executive Brainstorm, London, May 2011

An interesting feature of the debate was which areas telcos would be most successful in, and the timing of market entry strategies. Orange and Cisco argued that the area of ‘Virtual Private Cloud’, although neither the largest nor predicted to be the fastest growing area, should be the first market for some telcos to address, appealing to some telcos strong ‘trust’ credentials with CIOs and building on ‘managed services’ enterprise IT sales and delivery capabilities.

Orange described its value proposition ‘Flexible 4 Business’ in partnership with Cisco, VMWare virtualisation, and EMC2 storage, and although could not at this early stage give any performance metrics described strong demand and claimed satisfaction with progress to date.

Aepona described a Platform-as-a-Service (PaaS) concept that they are launching shortly with Neustar that aggregates telco APIs to enable the rapid creation and marketing of new enterprise services.

Figure 3 – Aepona / Neustar ‘Intelligent Cloud’ PaaS Concept

C;oud 2.0 - Intelligent Cloud PaaS Concept - Telco 2.0

In this instance, the cloud component makes the service more flexible, cheaper and easier to deliver than a traditional IT structure. This type of concept is sometimes described as a ‘mobile cloud’ because many of the interesting uses relate to mobile applications, and are not reliant on continuous high-grade mobile connectivity required for e.g. IaaS: rather they can make use of bursts of connectivity to validate identities etc. via APIs ‘in the cloud’.

To read the rest of this Analyst Note, containing…

  • Forecasts of telco share of cloud by VPC, IaaS, PaaS and SaaS
  • Telco 2.0 take-outs and next steps
  • And detailed Brainstorm delegate feedback

Members of the Telco 2.0TM Executive Briefing Subscription Service and the Cloud and Enterprise ICT Stream can access and download a PDF of the full report here. Non-Members, please see here for how to subscribe. Alternatively, please email contact@telco2.net or call +44 (0) 207 247 5003 for further details.

LTE: Late, Tempting, and Elusive

Summary: To some, LTE is the latest mobile wonder technology – bigger, faster, better. But how do institutional investors see it?

AreteThis is a Guest Briefing from Arete Research, a Telco 2.0™ partner specialising in investment analysis.

The views in this article are not intended to constitute investment advice from Telco 2.0™ or STL Partners. We are reprinting Arete’s Analysis to give our customers some additional insight into how some Investors see the Telecoms Market.

[Members of the Telo 2.0TM Executive Briefing Subscription Service and Future Networks Stream, please see here for the full Briefing report. Non-Members, please see here for how to subscribe or email contact@telco2.net or call +44 (0) 207 247 5003.]

Wireless Infrastructure

[Figure]

LTE is the new HSPA is the new WCDMA: another wave of new air interfaces, network architectures, and enabled services to add mobile data capacity. From 3G to 3.5G to 4G, vendors are pushing technology into a few “pioneer” operators, hoping to boost sales. Yet, like previous “G’s,” LTE will see minimal near-term sales, requires $1bn+ of R&D per vendor, and promises uncertain returns. The LTE hype is adding costs for vendors that saw margins fall for two years.

Despite large projects in China and India, we see wireless infrastructure sales down 5% in ’09, after 10% growth in ’08. As major 2G rollouts near an end, emerging markets 3G pricing should take to new lows. Some 75% of sales are with four vendors (Ericsson, NSN-Nortel, Huawei, and Alcatel-Lucent), but margins have been falling: we do not see consolidation (like the recent NSN-Nortel deal) structurally improving margins. LTE is another chapter in the story of a fundamentally deflationary market, with each successive generation having a shorter lifecycle and yielding lower sales. We expect a period of heightened (and politicised) competition for a few “strategic accounts,” and fresh attempts to “buy” share (as in NSN-Nortel, or by ZTE).

Late Is Great. We think LTE will roll out later, and in a more limited form than is even now being proposed (after delays at Verizon and others). There is little business case for aggressive deployment, even at CDMA operators whose roadmaps are reaching dead ends. HSPA+ further confuses the picture.

Temptations Galore. Like WCDMA, every vendor thinks it can take market share in LTE. And like WCDMA, we think share shifts will prove limited, and the ensuing fight for deals will leave few winners.

Elusive Economics. LTE demands $1bn in R&D spend over three to five years; with extensive testing and sharing of technical data among leading operators, there is little scope to cut corners (or costs).  LTE rollouts will not improve poor industry margins, and at 2.6GHz, may force network sharing.

Reaching for the Grapes

Table 1 shows aggregate sales, EBITDA, and capex for the top global and emerging markets operators. It reflects a minefield of M&A, currencies, private equity deals, and changes in reporting structure. Getting more complete data is nearly impossible: GSA says there are 284 GSM/WCMDA operators, and CDG claims another 280 in CDMA. We have long found only limited correlation between aggregate capex numbers and OEM sales (which often lag shipments due to revenue recognition). Despite rising data traffic volumes and emerging markets capex, we think equipment vendor sales will fall 5%+ in US$. We think LTE adds risk by bringing forward R&D spend to lock down key customers, but committing OEMs to roll out immature technology with uncertain commercial demand.

Table 1: Sales and Capex Growth, ’05-’09E

  ’05 ’06 ’07 ’08 ’09E
Top 20 Global Operators          
Sales Growth 13% 16% 15% 10% 5%
EBITDA Growth 13% 15% 14% 10% 8%
Capex Growth 10% 10% 5% 9% -1%
Top 25 Emerging Market Operators          
Sales Growth 35% 38% 29% 20% 11%
EBITDA Growth 33% 46% 30% 18% 8%
Capex Growth 38% 29% 38% 25% -12%
Global Capex Total 16% 18% 13% 14% -5%

Source: Arete Research

LaTE for Operators

LTE was pushed by the GSM community in a global standards war against CDMA and WiMAX. Since LTE involves new core and radio networks, and raises the prospect of managing three networks (GSM, WCMDA/HSPA, and LTE), it is a major roadmap decision for conservative operators. Added to this are questions about spectrum, IPR, devices, and business cases. These many issues render moot near-term speculation about timing of LTE rollouts.

Verizon and DoCoMo aside, few operators profess an appetite for LTE’s new radio access products, air interfaces, or early-stage handsets and single-mode datacards. We expect plans for “commercial service” in ’10 will be “soft” launches. Reasons for launching early tend to be qualitative: gaining experience with new technology, or a perception of technical superiority. A look at leading operators shows only a few have clear LTE commitments.

  • Verizon already pushed back its Phase I (fixed access in 20-30 markets) to 2H10, with “rapid deployment” in ’11-’12 at 700MHz, 850MHz, and 1.9GHz bands, and national coverage by ’15, easily met by rolling out at 700Mhz. Arguably, Verizon is driven more by concerns over the end of the CDMA roadmap, and management said it would “start out slow and see what we need to do.”
  • TeliaSonera targets a 2010 data-only launch in two cities (Stockholm and Oslo), a high-profile test between Huawei and Ericsson.
  • Vodafone’s MetroZone concept uses low-cost femto- or micro-cells for urban areas; it has no firm commitment on launching LTE.
  • 3 is focussing on HSPA+, with HSPA datacards in the UK offering 15GB traffic for £15, on one-month rolling contracts.
  • TelefónicaO2 is awaiting spectrum auctions in key markets (Germany, UK) before deciding on LTE; it is sceptical about getting datacards for lower frequencies.
  •  Orange says it is investing in backhaul while it “considers LTE network architectures.”
  • T-Mobile is the most aggressive, aiming for an ’11 LTE rollout to make up for its late start in 3G, and seeks to build an eco-system around VoLGA (Voice over LTE via Generic Access).
  • China Mobile is backing a China-specific version (TD-LTE), which limits the role for Western vendors until any harmonising of standards.
  • DoCoMo plans to launch LTE “sometime” in ’10, but was burnt before in launching WCDMA early. LTE business plans submitted to the Japanese regulator expect $11bn of spend in five years, some at unique frequency bands (e.g., 1.5GHz and 1.7GHz).

LTE’s “commercial availability” marks the start of addressing the issue of handling voice, either via fallback to circuit switched networks, or with VoIP over wireless. The lack of LTE voice means operators have to support three networks, or shut down GSM (better coverage than WCDMA) or WCDMA (better data rates than GSM).  This is a major roadblock to mass market adoption: Operators are unlikely to roll out LTE based on data-only business models. The other hope is that LTE sparks fresh investment in core networks: radio is just 35-40% of Vodafone’s capex and 30% of Orange’s. The rest goes to core, transmission, IT, and other platforms. Yet large OEMs may not benefit from backhaul spend, with cheap wireline bandwidth and acceptance for point-to-multipoint microwave.

HSPA+ is a viable medium-term alternative to LTE, offering similar technical performance and spectral efficiency. (LTE needs, 20MHz vs. 10Mhz for HSPA+.)  There have been four “commercial” HSPA+ launches at 21Mbps peak downlink speeds, and 20+ others are pending. Canadian CDMA operators Telus and Bell (like the Koreans) adopted HSPA only recently. HSPA+ is favoured by existing vendors: it lacks enough new hardware to be an entry point for the industry’s second-tier (Motorola, NEC, and to a lesser extent Alcatel-Lucent), but HSPA+ will also require new devices. There are also further proposed extensions of GSM, quadrupling capacity (VAMOS, introducing MIMO antennas, and MUROS for multiplexing re-use); these too need new handsets.

Vendors say successive 3G and 4G variants require “just a software upgrade.”  This is largely a myth.  With both HSPA+ or LTE, the use of 64QAM brings significant throughput degradation with distance, sharply reducing the cell area that can get 21Mbps service to 15%. MIMO antennas and/or multi-carrier solutions with additional power amplifiers are needed to correct this. While products shipping from ’07 onwards can theoretically be upgraded to 21Mbps downlink, both capacity (i.e., extra carriers) and output power (to 60W+) requirements demand extra hardware (and new handsets). Vendors are only now starting to ship newer multi-mode (GSM, WCDMA, and LTE) platforms (e.g., Ericsson’s RBS6000 or Huawei’s Uni-BTS). Reducing the number of sites to run 2G, 3G, and 4G will dampen overall equipment sales.

Tempting for Vendors

There are three reasons LTE holds such irresistible charm for vendors. First, OEMs want to shift otherwise largely stagnant market shares. Second, vendor marketing does not allow for “fast followers” on technology roadmaps. Leading vendors readily admit claims of 100-150Mpbs throughput are “theoretical” but cannot resist the tendency to technical one-upmanship. Third, we think there will be fewer LTE networks built than in WCDMA, especially at 2.6GHz, as network-sharing concepts take root and operators are capital-constrained. Can the US afford to build 4+ nationwide LTE networks? This scarcity makes it even more crucial for vendors to win deals.

Every vendor expected to gain share in WCDMA. NSN briefly did, but Huawei is surging ahead, while ALU struggled to digest Nortel’s WCDMA unit and Motorola lost ground. Figure 1 shows leading radio vendors’ market share. In ’07, Ericsson and Huawei gained share.  In ’08, we again saw Huawei gain, as did ALU (+1ppt), whereas Ericsson was stable and Motorola and NSN lost ground.

Figure 1: Wireless Infrastructure Market Share, ’07E-’09E

[Figure]

Source: Arete Research; others incl. ZTE, Fujitsu, LG, Samsung, and direct sub-systems vendor sales (Powerwave, CommScope, Kathrein, etc.);
excludes data and transmission sales from Cisco, Juniper, Harris, Tellabs, and others.

While the industry evolved into an oligopoly structure where four vendors control 75% of sales, this has not eased pricing pressure or boosted margins. Ericsson remains the industry no. 1, but its margins are half ’07 levels; meanwhile, NSN is losing money and seeking further scale buying Nortel’s CDMA and LTE assets. Huawei’s long-standing aggressiveness is being matched by ZTE (now with 1,000 staff in EU), and both hired senior former EU execs from vendors such as Nortel and Motorola. Alcatel-Lucent and Motorola are battling to sustain critical mass, with a mix of technologies for each, within ~$5bn revenue business units.

We had forecast Nortel’s 5% share would dwindle to 3% in ’09 (despite part purchase by NSN) and Motorola seems unlikely to get LTE wins it badly needs, after abandoning direct 3G sales. ALU won a slice of Verizon’s LTE rollout (though it may be struggling with its EPC core product), and hopes for a role in China Mobile’s TD-LTE rollouts, but lacks WCDMA accounts to migrate. Huawei’s market share gains came from radio access more than core networks, but we hear it recently won Telefónica for LTE. NSN was late on its HSPA roadmap (to 7.2Mpbs and 14.4Mbps), and lacks traction in packet core. It won new customers in Canada and seeks a role in AT&T’s LTE rollout, but is likely to lose share in ’09. Buying Nortel is a final (further) bid for scale, but invites risks around retaining customers and integrating LTE product lines. Finally, Ericsson’s no. 1 market share looks stable, but it has been forced to respond to fresh lows in pricing from its Asian rivals, now equally adept at producing leading-edge technology, even if their delivery capability is still lagging.

Elusive Economics

The same issues that plagued WCDMA also make LTE elusive: coverage, network performance, terminals, and volume production of standard equipment. Operators have given vendors a list of issues to resolve in networks (esp. around EPC) and terminals. Verizon has its own technical specs relating to transmit output power and receive sensitivity, and requires tri-band support. We think commercialising LTE will require vendors to commit $1bn+ in R&D over three to five years, based on teams of 2-3,000 engineers. LTE comes at a time when every major OEM is seeking €1bn cost savings via restructuring, but must match plunging price levels.

To read the rest of the article, including:

  • Coping with Traffic
  • Is There a Role for WiMax?
  • Will Anyone Get the Grapes?

…Members of the Telco 2.0™ Executive Briefing Service and Future Networks Stream can read on here. Non-Members please see here to subscribe.


AreteThis is a Guest Briefing from Arete Research, a Telco 2.0™ partner specialising in investment analysis.

The views in this article are not intended to constitute investment advice from Telco 2.0™ or STL Partners. We are reprinting Arete’s Analysis to give our customers some additional insight into how some Investors see the Telecoms Market.