Login to access
Want to subscribe?
This article is part of: Network Innovation
To find out more about how to join or access this report please contact us
Global O-RAN capex forecasts 2020–2030, modelling operator investments across four migration pathways.
Introducing STL Partners’ O-RAN Market Forecast
This capex forecast is STL Partners’ first attempt at estimating the value of the O-RAN market.
- This is STL Partners’ first O-RAN market value forecast
- It is based on analysis of telco RAN capex and projected investment pathways for O-RAN
- The assumptions are informed by public announcements, private discussions and the opinions of our Telco Cloud team
- We look forward to developing it further based on client feedback
Enter your details below to request an extract of the report
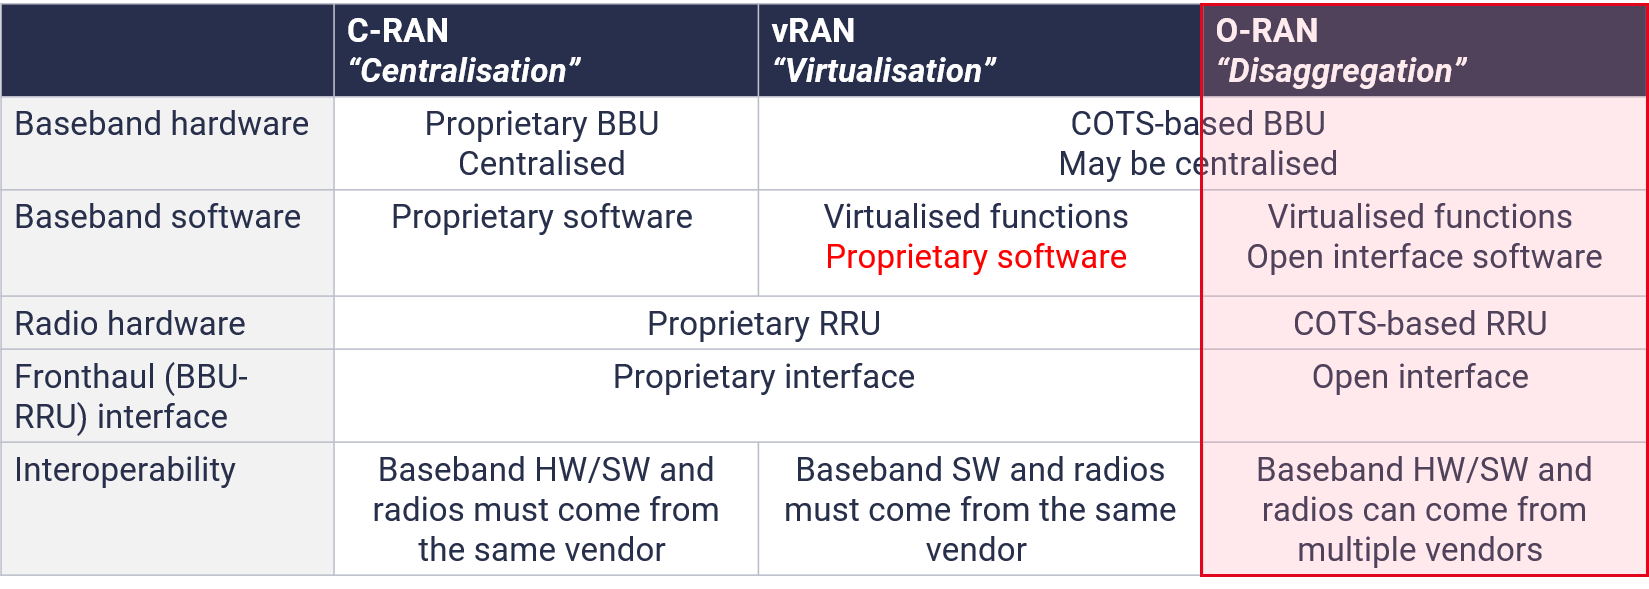
What is O-RAN?
We define O-RAN as virtualised, disaggregated, open-interface architectures.
- Our O-RAN capex forecasts cover virtualised, disaggregated, open-interface architectures in the Radio Access Network
- They do not include vRAN or O-RAN compliant but single vendor deployments
O-RAN will account for 76% of active RAN capex by 2030
As mobile operators upgrade their 4G networks and invest in new 5G infrastructure, they can continue purchasing single vendor legacy RAN equipment or opt for multi-vendor open-standard O-RAN solutions.
Each telco will determine its O-RAN roadmap based on its specific circumstances (footprint, network evolution, rural coverage, regulatory pressure, etc)1. For the purpose of this top-level O-RAN capex forecast, STL has defined four broad pathways for transitioning from legacy RAN/vRAN to O-RAN and categorised each of the top 40 mobile operators in one of the pathways, based on their announced or suspected O-RAN strategy.
Through telcos’ projected mobile capex and the pathway categorisation, we estimate that by 2026 annual sales of O-RAN active network elements (including equipment and software) will reach USD12 billion, or 21% of all active RAN capex (excluding passive infrastructure). By 2030, these will reach USD43 billion and 76%, respectively.
Total annual O-RAN capex spend

Table of content
- Executive summary
- O-RAN forecast 2020-2030
- Brownfield vs greenfield
- Four migration pathways
- Modelling assumptions
- Migration pathways
- Committed O-RAN-philes
- NEP-otists
- Leap-froggers
- Industrial O-RAN
- Next steps