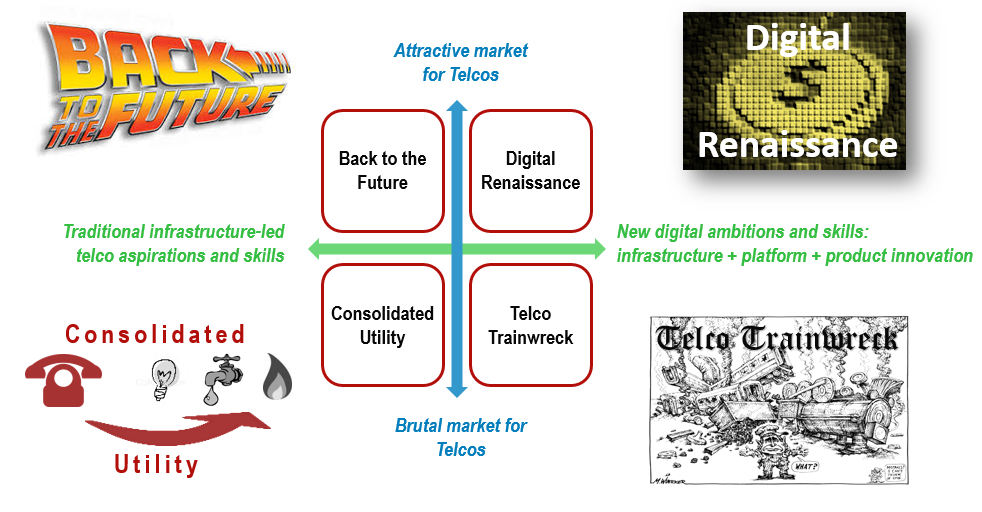
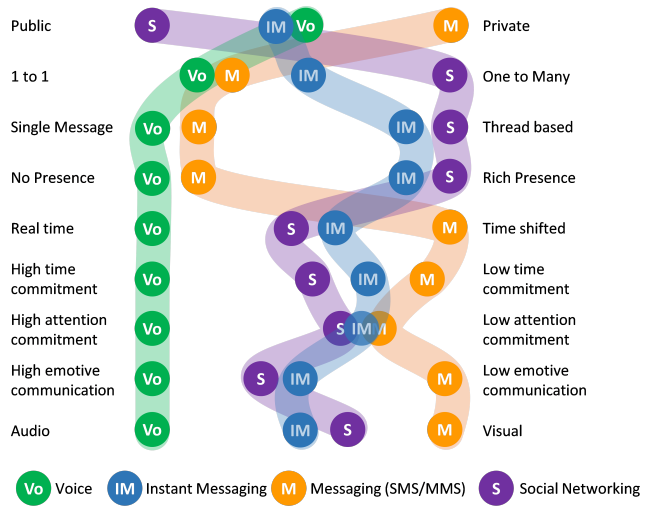
Lessons from AT&T’s bruising entertainment experience

How AT&T entered and exited the media business

AT&T enters the satellite market at its peak

In 2014, AT&T announced it was buying DirecTV. By that time, AT&T was already bundling DirecTV with its phone and internet service and had approximately 5.9 million linear pay-TV (U-Verse) video subscribers. However, this pay-TV business was already experiencing decline, to the extent that when the DirecTV merger completed in mid-2015, U-Verse subscribers had fallen to 5.6 million by the end of that year.

With the acquisition of DirecTV, AT&T went from a small player in the media and entertainment industry to one of the largest media players in the world adding 39.1 million (US and Latin American) subscribers and paying $48.5bn ($67bn including debt) to acquire the business. The rationale for this acquisition (the satellite business) was to compete with cable operators by being able to offer broadband, increasing AT&T’s addressable market beyond its fibre-based U-Verse proposition which was only available in certain locations/states.

AT&T and DirecTV enjoyed an initial honeymoon, period recording growth up until the end of 2016 when DirecTV subscribers peaked at just over 21 million in the US.

From this point onwards however, AT&T’s satellite subscribers went into decline as customers switched to cheaper competitor offers as well as online streaming services. The popularity of streaming services was reflected by moves among traditional media players to develop their own streaming services such as Time Warner’s HBO GO and HBO NOW. In 2015, DirectTV’s satellite competitor Dish TV likewise launched its own streaming service Sling TV.

Even though it was one of the largest TV distributors on a satellite platform, AT&T also believed online streaming was its ultimate destination. Prior to the launch of its streaming service in late 2016, Bloomberg reported that AT&T envisioned DirecTV NOW as its primary video platform by 2020.

A softwarised platform delivered lowered costs as the service could be self-installed by customers and didn’t rely on expensive truck roll installation or launching satellites. The improved margins would enable AT&T to promote TV packages at attractive price points which would balance inflation demands from broadcasters for the cost of TV programming. AT&T could also more easily bundle the softwarised TV service with its broadband, fibre and wireless propositions and earn more lucrative advertising revenue based on its own network and viewer insights.

Enter your details below to request an extract of the report

The beginnings of a bumpy journey in TV

AT&T’s foray into satellite and streaming TV can be characterised by a series of confusing service propositions for both consumers and AT&T staff, expensive promotional activity and overall pricing/product design misjudgements as well as troubled relations with TV broadcasters resulting in channel blackouts and ultimately churn.

Promotion, pull back and decline of DirecTV NOW

DirectTV NOW launched in November 2016, as AT&T’s first over the top (OTT) low cost online streaming service. Starting at $35 per month for 60+ channels with no contract period, analysts called the skinny TV package as a loss leader given the cost of programming rights and high subscriber acquisition costs (SACs). The loss leader strategy was aimed at acquiring wireless and broadband customers and included initiatives such as:

  • Promotional discounts to its monthly $60 mid-tier 100+ channel package reduced to $35 per month for life (subject to programming costs).
  • Device promotions and monthly waivers. The service eventually became available on popular streaming devices (Roku, Xbox and PlayStation) and included promotions such as an Apple TV 4K with a four month subscription waiver, a Roku Streaming Stick with a one month waiver or a $25 discount on the first month.
  • Customers could also add HBO or Cinemax for an additional $5 per month, which again was seen as a costly subsidy for AT&T to offer.

The service didn’t include DirecTV satellite’s popular NFL Sunday Ticket programming as Verizon held the smartphone rights to live NFL games, nor did it come with other popular shows from programme channels such as CBS. Features such as cloud DVR (digital video recording) functionality were also initially missing, but would follow as AT&T’s TV propositions and functionalities iterated and improved over time.

The DirecTV NOW streaming service enjoyed continuous quarterly growth through 2017 but peaked in Q3 2018 with net additions turning immediately negative in the final quarter of 2018 as management pulled back on costly promotions and discounted pricing.

The proposition became unsustainable financially in terms of its ability to cover rising programming costs and was positioned comparatively as a much less expensive service to its larger DirecTV satellite pay-TV propositions.

The DirecTV satellite service sold some of the most expensive TV propositions on the market and reported higher pay-TV ARPU ($131) than peers such as Dish ($89) and Comcast ($86) in Q4 2019.

  • The launch of a $35 DirecTV NOW streaming service with no contract and with a similar sounding name to the full linear service confused both new and existing DirecTV satellite customers and some would have viewed their satellite package as expensive compared to the cheaper steaming option.

Rising programming costs

AT&T’s low-cost skinny TV packages brought them into direct confrontation with TV programmers in terms of negotiating fees for content. When the streaming service launched, analysts highlighted the channels within AT&T’s base package were expected to rise in price annually by around 10% each year and this would eventually require AT&T to eventually balance programming costs with rising monthly package pricing.

Confrontations with programmers included a three-week dispute with CBS and an eight week dispute with Nexstar in 2019, which resulted in a blackout of both CBS and Nexstar channels across AT&T’s TV platforms such as Direct TV, U-Verse, DirectTV NOW. Commenting on the blackouts in Q3 2019, Randall Stephenson noted there were “a couple of significant blackouts in terms of content, and those blackouts drove some sizable subscriber losses”.

AT&T’s confrontation with content owners may have been a contributory reason to consider acquiring a content creation platform of its own in the form of Time Warner.

In mid-2018, as AT&T withdrew promotions and discounts for DirecTV NOW (later rebranded it to AT&T TV NOW), customers began to drop the OTT TV service.

  • AT&T TV NOW went from a peak of 1.86 million subscribers in Q3 2018 to 656,000 at the end of 2020.

DirecTV NOW subscriptions

DirecTV-subs-AT-T-stlpartners

Source: STL Partners, AT&T Q2 Earnings 2021

Name changes and new propositions create more confusion

In 2019, DirecTV NOW was re-branded to AT&T TV NOW , and continued to be promoted as a skinny bundle operating alongside AT&T TV, a new full fat live TV streaming version of the DirecTV satellite TV proposition. AT&T TV  was first piloted in August 2019 and soft launched in November 2019. The AT&T TV service included an Android set-top box with cloud DVR functionality and supported other apps such as Netflix.
AT&T TV required a contract period and offered pricing (once promotional discount periods ended) resembling a linear pay-TV service, i.e. $90+. This was, in effect, the very type of pay-TV proposition customers were abandoning.
AT&T TV was seen as an ultimate replacement for the satellite business based on the advantages a softwarised platform provided and the ability to bundle it with AT&T broadband, fibre and wireless services.

Confusion amongst staff and customers

The new AT&T TV proposition confused not only customers but also AT&T staff, as they were found mixing up the AT&T TV proposition with the skinny AT&T TV NOW proposition. By 2019 the company diverted its attention away from AT&T TV NOW  pulling back on promotional activity in order to focus on its core AT&T TV live TV service.

According to Cord Cutters News, both services used the same app but remained separate services. AT&T’s app store marketing incorrectly communicated the DirectTV NOW service was now AT&T TV when in fact it was AT&T TV NOW. Similarly, technical support was also incorrectly labelled with online navigation sending customers to the wrong support channels.

AT&T’s own customer facing teams misunderstood the new propositions

DirecTV-Cordcutter-news

Source: Cord Cutters News

Withdrawal of AT&T TV NOW

By January 2021, AT&T TV NOW was no longer available to new customers but continued to be available to existing customers. The AT&T TV proposition, which was supposed to offer “more value and simplicity” was updated to include some features of the skinny bundle such as the option to go without an annual contract requirement. Customers were also not required to own the set-top box but could instead stream over Amazon Fire TV or Apple TV.  In terms of pricing, AT&T TV was twice the price of the originally launched DirecTV NOW proposition costing $70 to $95 per month.

The short life of AT&T Watch TV

In April 2018, while giving testimony for AT&T’s merger with Time Warner, AT&T’s then CEO Randall Stephenson positioned AT&T Watch TV as a potential new low-cost service that would benefit consumers if the merger was successful. Days following AT&T’s merger approval in the courts, the low cost $15 per month, ultra-skinny bundle launched as a suitable low-cost cord-cutter/cord-never option for cable, broadband and mobile customers from any network. The service was also free to select AT&T Unlimited mobile customers.

By the end of 2018, the operator claimed it had 500,000 AT&T Watch TV“established accounts”. By the end of 2019 the operator had updated its mobile tariffs removing Watch TV for new customers subscribing to its updated Unlimited mobile tariffs. Some believed the company didn’t fully commit to the service, referring to the lack of roll out support for streaming devices such as Roku. The operator was now committed to rolling out its new service HBO Max in 2020. AT&T has informed Watch TV subscribers the service will close 30 November 2021.

Timeline of AT&T entertainment propositions

AT-T-Timeline-Entertainment

Source: STL Partners

The decline of DirecTV

As the graphic belowshows, in June 2021 there were 74.3 million pay-TV households in the US, reflecting continued contraction of the traditional pay-TV market supplied by multichannel video programming distributor (MVPD) players such as cable, satellite, and telco operators. According to nScreenMedia, traditional pay-TV or MVPD market lost 6.3 and 6.2 million customers over 2019 and 2020, but not all were cord-cutters. Cord-shifters dropped their pay-TV but shifted across to virtual MVPD (vMVPD) propositions such as Hulu Live, Sling TV, YouTube TV, AT&T TV NOW, Fubo TV and Philo. Based on current 2021 cord-cutting levels, nScreenMedia predicts 2021 will be the highest year of cord-cutting yet.

Decline in traditional pay-TV households

pay-tv-decline-nscreenmedia

Source: nScreenMedia, STL Partners

Satellite subscribers to Dish and DirecTV 2015-2020

Satellite-pay-tvdish-nscreenmedia

Source: nScreenMedia, STL Partners

When considering AT&T’s management of DirecTV, nScreenMedia research shows the market number of MVPD subscribers declined by over 20 million between 2016 and 2020. In that time, DirecTV lost eight million subscribers. While it represented 20% of the MVPD market in 2016, DirecTV accounted for 40% of the pay-TV losses in the market (40% of 20 million equals ~8 million). AT&T’s satellite rival Dish weathered the decline in pay-TV slightly better over the period.

  • In Q4 2020 the operator wrote down $15.5bn on its premium TV business, which included DirecTV decline, to reflect the cord cutting trend as customers found cheaper streaming alternatives online. The graphic (below) shows a loss of 8.76 million Premium TV subscribers between 2017 and 2020 with large losses of 3.4 million and 2.9 million subscribers in 2019 and 2020.

AT&T’s communications business has also been enduring losses in legacy voice and data (DSL) subscriptions in recent years. AT&T has used a bundling strategy for both products. As customers switched to AT&T fibre or competitor broadband offerings this also impacted the video subscription.

Table of contents

  • Executive Summary
    • What can others learn from AT&T’s experience?
  • How AT&T entered and exited the media business
    • AT&T enters the satellite market at its peak
    • The beginnings of a bumpy journey in TV
    • Vertical integration strategy: The culture clash
    • AT&T’s telco mindset drives its video strategy
    • HBO MAX performance
  • The financial impact of AT&T’s investments
    • Reversing six years of strategic change in three months
  • Lessons from AT&T’s foray into media

Related Reports

Enter your details below to request an extract of the report


Music Lessons: How the music industry rediscovered its mojo

Introduction

The latest report in STL Partners’ Dealing with Disruption stream, this paper explores what telcos and their partners can learn from the music industry and its response to disruptive forces unleashed by the Internet.

Music was among the first industries to see its core product (compact discs) completely undermined by the Internet’s emergence as the primary distribution mechanism for content and software, throwing the record labels into a long standing struggle to maintain both relevance and revenues. After almost two decades of decline, sales of recorded music are growing again and, in developed markets, at least, the existential threat posed by piracy seems to have abated. Although the music industry still has problems aplenty, the success of streaming services has steadied the ship.

This report outlines how the music industry has regained its mojo, before considering the lessons for telcos and other digital service providers. The first section of the paper considers why music streaming has become so successful and whether the model will be sustainable. The second section of the paper explores the lessons companies from other sectors, notably telecoms, can draw from the ways in which the music industry responded to the Internet’s disruptive forces.

This paper builds on other entertainment-related reports published by STL Partners, including:

Apple’s pivot to services: What it means for telcos
Telco-Driven Disruption: Will AT&T, Axiata, Reliance Jio and Turkcell succeed?
Amazon: Telcos’ Chameleon-King Ally?
Can Telcos Entertain You? Vodafone and MTN’s Emerging Market Strategies (Part 2)
Can Telcos Entertain You? (Part 1)

Music bounces back

Over the past 20 years, the rise of the Internet has shaken the music industry to the core, obsolescing its distribution model, undermining its business model and enabling new forms of piracy. Yet, the major record labels have survived, albeit in a consolidated form, and the sector is now showing some tentative signs of recovery. In 2013, the global music industry began to grow again for the first time since the turn of the Millennium. It continues to recover and will grow at a compound annual growth rate of 3.5% between now and 2021, according to research by PwC, fuelled by growth in both the recorded music and the live music sectors (see Figure 1).

Figure 1: The global music industry has returned to growth

The global music industry has returned to growth

Source: PWC and Ovum

For most of the past two decades, revenues from recorded music have been shrinking, leaving the industry increasingly reliant on ticket sales for live performances. Widespread piracy, together with the growing obsolesce of CDs, appeared to be turning recorded music into a form of advertising for concerts and tours.

But in 2015, global recorded music revenues began to grow again. In 2016, they rose a relatively healthy 5.9% to US$15.7 billion (about one third of the industry’s total revenue), according to a report by the International Federation of the Phonographic Industry (IFPI). For music industry executives, that growth marks an important milestone. “We got here through years of hard work,” Michael Nash, executive vice president of digital strategy at Universal records, told the Guardian in April 2017, adding that the music industry was still going through a “historical transformation. The only reason we saw growth in the past two years, after some 15 years of substantial decline, is that music has been one of the fastest adapting sectors in the digital world.”

Contents:

  • Executive Summary
  • Introduction
  • Music bounces back
  • What has changed?
  • Is streaming the final word in music distribution
  • Lessons to learn from music’s recovery

Figures:

  • Figure 1: The global music industry has returned to growth
  • Figure 2: The way people buy recorded music is changing dramatically
  • Figure 3: YouTube pays particularly low rates per stream
  • Figure 4: YouTube is a major destination for music lover
  • Figure 5: Music is one of the slowest growing entertainment segments
  • Figure 6: Spotify’s losses continue to grow despite the growth in revenues
  • Figure 7: Spotify’s subscription service is growing rapidly
  • Figure 8: Concert ticket revenues are up sevenfold since 1996 in North America
  • Figure 9: Major concert tickets sell for an average of $77 apiece

Partnering 2.0 – How TeliaSonera Makes Beautiful Music with Spotify

Introduction

An agile approach to building and managing complex partnerships is one of the key elements of becoming a Telco 2.0 organisation. As discussed in our previous report on Digital Partnering Strategies, we see two new trends in telco approaches to digital services partnerships:

  1. The focus on partnering as a core competency of the telco organisation;, and
  2. The increasing complexity of telco partnership ecosystems, as digital services, enabling technologies, and service delivery value chains continue to evolve.

The increasing complexity of digital services partnerships, and the related trend for larger partnership ecosystems with many partners participating from different levels of the value chain, require telcos to take a different and more flexible approach. To be effective, this approach needs to take into account, and support, the particular characteristics of digital businesses:

  • Need for scale: A potential digital services partner will usually want to build global scale and so is likely to have several telco partners.
  • Need for speed: Digital services partners will in many cases move at very different speeds from telcos in terms of decision-making and processes,
  • Need for flexibility: particularly for channels and business models. Digital services partners (especially those with consumer propositions) are likely to use a variety of distribution channels, some of which will bypass, or compete with, the telco partner (particularly for OTT B2C content services such as Spotify). For both B2B and B2C partnerships, business models and revenue sharing arrangements are likely to be fluid and to involve multiple parties.

Based on our observations from TeliaSonera’s long-term relationship with Spotify, and from our earlier analysis of AT&T’s successful Drive connected car ecosystem, we have identified a set of key success factors, and major barriers, for effective digital services partnerships between operators and third parties.

In this report, we evaluate the TeliaSonera-Spotify partnership against this framework, as well as looking at the drivers for the partnership, the quality of execution, and the evidence of its success.


  • Executive Summary
  • Introduction
  • TeliaSonera’s partnership with Spotify: Overview
  • A B2C single-focus partnership
  • TeliaSonera’s rationale for the deal: Part of being a ‘New Generation Telco’
  • Evidence of the partnership’s success
  • Drivers and key success factors for the TeliaSonera-Spotify partnership
  • Drivers and objectives for TeliaSonera
  • Benefits of the TeliaSonera partnership for Spotify
  • Key success factors for TeliaSonera’s partnership with Spotify
  • External/Market-Driven (demand-side) factors
  • Internal / organisation (supply-side) factors
  • Organisation structure and the approach to managing joint activities have been important
  • Challenges to successful digital services partnering – lessons from other music partnerships
  • Barriers to successful partnering: framework
  • Spotify vs Deezer: the tale of tape


  • Figure 1: Characteristics of single-focus digital services partnership models
  • Figure 2: Spotify Key Metrics, 2014-2016
  • Figure 3: TeliaSonera-Spotify 7-year partnership timeline
  • Figure 4: Spotify Global Monthly Active Users and Premium (Paid) Subscribers, 2009-2015
  • Figure 5: Telia Denmark Mobile and Multiplay Packages With Spotify Premium Options, February 2016
  • Figure 6: Spotify Business (Soundtrack Your Brand) promotion, Feb. 2016
  • Figure 7: Drivers and key objectives for TeliaSonera-Spotify Partnership
  • Figure 8: Key success factors and barriers for TeliaSonera-Spotify Partnership

Digital Partnering: Success Factors and AT&T Drive Case Study

Introduction

As communications services providers continue their push to develop and monetise digital services, partnering is proving a critical element of strategy, and a key enabler for telco agility. While some telco-digital player partnerships have been successful in achieving their objectives, many have languished, and failed to deliver value to one or both parties within the partnership.

In this report, we examine the different types of digital services partnerships that operators are engaged in; discuss the key success factors for the various partnering approaches and strategies; and look more deeply at a successful partnership strategy: AT&T’s Drive connected car initiative, which is an example of a broad vertical-focused partnership ecosystem. Our follow-on report will provide a case study of TeliaSonera’s successful digital music partnership with Spotify, an example of a single-focus collaboration for digital services.

Telcos are increasingly recognising the importance of partnerships for achieving their potential as true digital services companies. Partnering between telcos and third parties to deliver new services or target new markets is, of course, not a new phenomenon. Two things are new, however: the focus on partnering as a core competency of the telco organisation, and the increasing complexity of telco partnership ecosystems, as digital services, enabling technologies and service delivery value chains continue to evolve. An agile approach to building and managing complex partnerships is one of the key elements of becoming a Telco 2.0 organisation.

Figure 1: The Telco 2.0 Agility Framework

Source: STL Partners

Partnering is being defined as a telco ‘core competence’

A number of operators have now enshrined the objective of successful partnering in their corporate strategy. Deutsche Telekom, for example, has made partnering one of its ‘four pillars’. The clearly-stated objective in DTAG’s case is to attract (and learn from) companies that have adopted the agile, rapid-response, high-energy approach found in Silicon Valley and other global tech hubs such as Israel. DTAG hopes to offer these partners, access to its customers and channels across the twelve DTAG European markets, as well as the ability to leverage DTAG’s network and corporate resources:

“The list of companies we have been working with for many years is long. But how we cooperate, that has changed. We are more open and faster. We focus on our core competence – our best net – and add specific offers of the partners. Take for example the eReader tolino: We not only provide the eReader, but also the technical platform on which Bertelsmann, Hugendubel, Thalia and Libri are able to distribute their eBooks. Together with the German book trade, we established the tolino as a model of success in the eReader market.

In the area Smart Home, we work together with Miele, Samsung, EON and EnBw, amongst others. We have started the system platform QIVICON, which our product DT Smart Home is based on. Together with our partners, we develop the vision of a connected house.”

Thomas Kiesling, Former Chief Product and Innovation Officer, Deutsche Telekom AG1

Partnering and partnerships are becoming more complex

The DTAG example highlights our second point about new aspects of partnering. The increasing complexity of digital services partnerships, and the growing trend for larger partnership ecosystems with many partners participating from different levels of the value chain, requires telcos to take a different and more flexible approach.

A potential digital services partner will usually want to build global scale and so is likely to have several telco partners. Digital services partners will in many cases move at very different speeds from telcos in terms of decision-making and processes, and are likely to use a variety of distribution channels, some of which will bypass, or compete with, the telco partner (particularly for OTT B2C content services such as Spotify). For both B2B and B2C partnerships, business models and revenue sharing arrangements are likely to be fluid and to involve multiple parties.

B2B (and B2B2C) services are increasingly being supported by more extensive and complex partnership ecosystems, rather than single partnerships. Telcos may lead the development of such ecosystems – as AT&T does in the case of Drive – or simply participate. The growth of wider ecosystem partnering relationships has been especially prevalent in the development of M2M/IoT propositions. These may require a variety of platforms, applications, devices and integration elements, as well as a high level of openness in terms of open-source and accessible platforms, APIs, analytics etc.

These trends present challenges for traditional telco approaches to partnering, which have favoured exclusive relationships and ‘what’s-in-it-for-me’ approaches to building joint revenue streams. Many telcos have set up digital or innovation arms with the goal of developing new digital propositions together with third parties in a more flexible manner. However, for such propositions to succeed, they need clear buy-in from one or more of the main divisions of the telco. In the case of AT&T, the successful partnering effort we profile here was ultimately rolled back into a main division of the operator, rather than continuing to sit within an innovation division.

Based on our observations from AT&T’s success and the partnership case study we cover in our follow-up report (TeliaSonera’s long-term relationship with Spotify), we have identified a set of key success factors, and major barriers, for effective digital services partnerships between operators and third parties (see Figure 2).

Figure 2: Key success factors and barriers for successful digital services partnering

Source: STL Partners

While it isn’t the case that all of the key success factors above must be present in successful operator partnering initiatives, our analysis suggests that several external and internal ones should be present in any digital services partnership.

In the next section, we discuss drivers for digital services partnering, approaches operators have used in partnering, key success factors and barriers; and evaluate the approach that AT&T has taken to partnering with the connected car.

Motivations for partnering in digital services

There are several compelling reasons for telcos to partner when exploring and growing digital services opportunities. The most important of these drivers are shown below in Figure 3. Each driver supports a set of higher-level objectives for telcos, comprising revenue growth, revenue retention, branding and positioning, and organisation transformation and/or agility.

Figure 3: Major drivers for telco digital services partnering initiatives

Source: STL Partners

Drivers linked to the objectives of revenue growth and retention may appear to be most compelling to telcos, given their obvious short-term impact; but those linked to transformation/agility and branding/positioning have been at the forefront of the AT&T partnership initiative we profile here as well as the TeliaSonera-Spotify partnership we profile in our follow-on report. The most successful partnerships support several telco objectives: part of their success is thus attributable to the support they engender from across the telco organisation.

As discussed in the following sections, beyond clearly defining the objectives of the partnership, and the assets that both parties bring to the table, there are a number of other soft elements that contribute to (or hinder) the success of telco digital services partnerships. The existence of clear market demand for the partnership’s products and services is also a key, though sometimes overlooked, element of success.


  • Executive Summary
  • Introduction
  • Partnering is being defined as a telco ‘core competence’
  • Partnering and partnerships are becoming more complex
  • Motivations for partnering in digital services
  • 4 digital services partnership approaches
  • Single-focus collaboration is easiest to manage and has best track record but impact is likely to be limited
  • Broader vertical focus requires greater commitment and has a greater market and implementation risk but can yield big benefits
  • General strategic partnerships appear to have had limited success
  • Key success factors for digital services partnerships
  • External/Market-Driven (demand-side) factors
  • Internal / organisation (supply-side) factors
  • Challenges to successful digital services partnering
  • External (demand side) challenges
  • Internal (supply-side) challenges
  • AT&T’s Drive Connected Car Ecosystem – A B2B2C Vertical Area Partnership
  • Background and context for the partnership
  • AT&T’s Drive Ecosystem
  • Key objectives and fit with the operator’s digital services strategy
  • Partnership approach and evolution
  • Organisation structure and framework for the partnership
  • Evidence of success
  • Key success factors and challenges
  • Barriers to successful partnering: challenges for Sprint and Verizon’s connected car initiatives


  • Figure 1: The Telco 2.0 Agility Framework
  • Figure 2: Key success factors and barriers for successful digital services partnering
  • Figure 3: Major drivers for telco digital services partnering initiatives
  • Figure 4: Telco Digital Services Partnership Models
  • Figure 5: US Connected Car Shipments, 2014-2020
  • Figure 6: AT&T Drive: Key End User Applications
  • Figure 7: AT&T Drive Studio, 2015
  • Figure 8: Drivers and objectives for AT&T’s connected car partnerships
  • Figure 9: AT&T Drive Platform Core Functionality and Applications
  • Figure 10: Opel OnStar Service Features, 2016
  • Figure 11: AT&T Drive Partnerships, Dec. 2015
  • Figure 12: AT&T connected car net adds are accelerating
  • Figure 13: Key Success Factors for AT&T Drive Partnerships (GM)

The European Telecoms market in 2020, Report 2: 4 scenarios and 7 predictions

Introduction

The second report in The European Telecoms market in 2020, this document uses the framework introduced in Report 1 to develop four discrete scenarios for the European telecoms market in 2020.  Although this report can be read on its own, STL Partners suggests that more value will be derived from reading Report 1 first.

The role of this report

Strategists (and investors) are finding it very difficult to understand the many and varied forces affecting the telecoms industry (Report 1), and predict the structure of, and returns from, the European telecoms market in 2020 (the focus of this Report 2).  This, in turn, makes it challenging to determine how operators should seek to compete in the future (the focus of a STL Partners report in July, Four strategic pathways to Telco 2.0).

In summary, The European Telecoms market in 2020 reports therefore seek to:

  • Identify the key forces of change in Europe and provide a useful means of classifying them within a simple and logical 2×2 framework (Report 1);
  • Help readers refine their thoughts on how Europe might develop by outlining four alternative ‘futures’ that are both sufficiently different from each other to be meaningful and internally consistent enough to be realistic (Report 2);
  • Provide a ‘prediction’ for the future European telecoms market based on our own insights plus two ‘wisdom of crowds’ votes conducted at a recent STL Partners event for senior managers from European telcos (Report 2).

Four European telecoms market scenarios for 2020

The second report in The European Telecoms market in 2020, this document uses the framework introduced in Report 1 to develop four discrete scenarios for the European telecoms market in 2020.  Although this report can be read on its own, STL Partners suggests that more value will be derived from reading Report 1 first.

Overview

STL Partners has identified the following scenarios for the European market in 2020:

  1. Back to the Future. This scenario is likely to be the result of a structurally attractive telecoms market and one where operators focus on infrastructure-led ‘piping’ ambition and skills.
  2. Consolidated Utility. This might be the result of the same ‘piping’ ambition in a structurally unattractive market.
  3. Digital Renaissance. A utopian world resulting from new digital ambitions and skills developed by operators coupled with an attractive market.
  4. Telco Trainwreck. As the name suggests, a disaster stemming from lofty digital ambitions being pursued in the face of an unattractive telco market.

The four scenarios are shown on the framework in Figure 1 and are discussed in detail below.

Figure 1: Four European telecoms market scenarios for 2020

Source: STL Partners/Telco 2.0

How each scenario is described

In addition to a short overview, each scenario will be examined by exploring 8 key characteristics which seek to reflect the combined impact of the internal and external forces laid out in the previous section:

  1. Market Structure. The absolute and relative size and overall number of operators in national markets and across the wider EU region.
  2. Operator service pricing and profits. The price levels and profit performance of telecoms operators (and the overall industry) and the underlying direction (stable, moving up, moving down).
  3. The role of content in operators’ service portfolios. The importance of IPTV, games and applications within operators’ consumer offering and the importance of content, software and applications within operators’ enterprise portfolio.
  4. The degree to which operators can offer differentiated services. How able operators are to offer differentiated network services to end users and, most importantly, upstream service providers based on such things as network QoS, guaranteed maximum latency, speed, etc.
  5. The relationships between operators and NEP/IT players. Whether NEP and IT players continue to predominantly sell their services to and through operators (to other enterprises) or whether they become ‘Under the Floor’ competitors offering network services directly to enterprises.
  6. Where service innovation occurs – in the network/via the operator vs at the edge/via OTT players. The extent to which services continue to be created ‘at the edge’ – with little input from the network – or are ‘network-reliant’ or, even, integrated directly into the network. The former clearly suggests continued dominance by OTT players and the latter a swing towards operators and the telecoms industry.
  7. The attitude of the capital markets (and the availability of capital). The willingness of investors to have their capital reinvested for growth by telecoms operators as opposed to returned to them in the form of dividends. Prospects of sustained growth from operators will lead to the former whereas profit stasis or contraction will result in higher yields.
  8. Key industry statistics. Comparison between 2020 and 2015 for revenue and employees – tangible numbers that demonstrate how the industry has changed.

The European macro-economy – a key assumption

The health and structure of all industries in Europe is dependent, to a large degree, on the European macro-economy. Grexit or Brexit, for example, would have a material impact on growth throughout Europe over the next five years.  Our assumption in these scenarios is that Europe experiences a stable period of low-growth and that the economic positions of the stretched Southern European markets, particularly Italy and Spain, improves steadily.  If the European economic position deteriorates then opportunities for telecoms growth of any sort is likely to disappear.


  • Executive Summary
  • Introduction
  • The role of this report
  • Four European telecoms market scenarios for 2020
  • Overview
  • How each scenario is described
  • The European macro-economy – a key assumption
  • Back to the Future
  • Consolidated Utility
  • Digital Renaissance
  • Telco Trainwreck
  • Risk and returns in the scenarios
  • Making predictions
  • Wisdom of crowds: 2 approaches
  • Approach 1: Aggregating individual forces – ‘Sum-of-the-parts’
  • Approach 2: Picking a scenario
  • STL Partners’ prediction for the European telecoms market in 2020
  • STL Partners and Telco 2.0: Change the Game


  • Figure 1: Four European telecoms market scenarios for 2020
  • Figure 2: Back to the Future – key characteristics
  • Figure 3: Consolidated Utility – key characteristics
  • Figure 4: Digital Renaissance – key characteristics
  • Figure 5: Telco Trainwreck – key characteristics
  • Figure 6: Risk and returns in the four scenarios
  • Figure 7: Europe’s future based on aggregating individual forces – ‘Sum-of-the-parts’
  • Figure 8: Europe’s future – results of the two approaches compared

The European Telecoms market in 2020, Report 1: Evaluating 10 forces of change

Introduction

Telecoms – the times they are a changin’

The global telecoms market is experiencing change at an unprecedented pace.  As recently as 2012 , few would have predicted that consumer voice and messaging would be effectively ‘given away’ with data packages in 2015.  Yet today, the shift towards data as the ‘valuable’ part of the mobile bundle has been made in many European markets and, although many operators still allocate a large proportion of revenue to voice and messaging, the value proposition is clearly now ‘data-led’.

Europe, in particular, is facing great uncertainty

While returns on investment have steadily reduced in European telecoms, the market has remained structurally fragmented with a large number of disparate players – fixed-only; mobile-only; converged; wholesalers; enterprise-only; content-oriented players (cablecos); and so forth. Operators generally have continued to make steady economic returns for investors and have been considered ‘defensive stocks’ by the capital markets owing to an ability to generate strong dividend yields and withstand economic down-turns (although Telefonica’s woes in Spain will attest to the limitations of the telco business model to recession).

But the forces of change in Europe are growing and, as a company’s ‘Safe Harbor’ statement would put it, ‘past performance does not guarantee future results’. Strategists are puzzling over what the European telecoms industry might look like in 2020 (and how might that affect their own company) given the broad range of forces being exerted on it in 2015.

STL Partners believes there are 12 questions that need to be considered when considering what the European telecoms market might look like in 2020:

  1. How will regulation of national markets and the wider European Union progress?
  2. How will government policies and the new EC Digital Directive impact telecoms?
  3. How will competition among traditional telecoms players develop?
  4. How strong will new competitors be and how will they compete with operators?
  5. What is the revenue and margin outlook for telecoms core services?
  6. Will new technologies such as NFV, SDN, and eSIM, have a positive or negative effect on operators?
  7. How will the capital markets’ attitude towards telecoms operators change and how much capital will be available for investment by operators?
  8. How will the attitudes and behaviours of customers – consumer and enterprise – evolve and what bearing might this have on operators’ business models?
  9. How will the vision and aspirations of telecoms senior managers play out – will digital services become a greater focus or will the ‘data pipe’ model prevail? How important will content be for operators? What will be the relative importance of fixed vs mobile, consumer vs enterprise?
  10. Will telcos be able to develop the skills, assets and partnerships required to pursue a services strategy successfully or will capabilities fall short of aspirations?
  11. What M&A strategy will telco management pursue to support their strategies: buying other telcos vs buying into adjacent industries? Focus on existing countries only vs moves into other countries or even a pan-European play?
  12. How effective will the industry be in reducing its cost base – capex and opex – relative to the new competitors such as the internet players in consumer services and IT players in enterprise services?

Providing clear answers to each of these 12 questions and their combined effect on the industry is extremely challenging because:

  • Some forces are, to some extent at least, controllable by operators whereas other forces are largely outside their control;
  • Although some forces are reasonably well-established, many others are new and/or changing rapidly;
  • Establishing the interplay between forces and the ‘net effect’ of them together is complicated because some tend to create a domino effect (e.g. greater competition tends to result in lower revenues and margins which, in turn, means less capital being available for investment in networks and services) whereas other forces can negate each other (e.g. the margin impact of lower core service revenues could be – at least partially – offset by a lower cost base achieved through NFV).

The role of this report

In essence, strategists (and investors) are finding it very difficult to understand the many and varied forces affecting the telecoms industry (this report) and predict the structure of and returns from the European telecoms market in 2020 (Report 2). This, in turn, makes it challenging to determine how operators should seek to compete in the future (the focus of a STL Partners report in July, Four strategic pathways to Telco 2.0).

In summary, the European Telecoms market in 2020 reports therefore seek to:

  • Identify the key forces of change in Europe and provide a useful means of classifying them within a simple and logical 2×2 framework (this report);
  • Help readers refine their thoughts on how Europe might develop by outlining four alternative ‘futures’ that are both sufficiently different from each other to be meaningful and internally consistent enough to be realistic (Report 2);
  • Provide a ‘prediction’ for the future European telecoms market based on the responses of two ‘wisdom of crowds’ votes conducted at a recent STL Partners event for senior managers from European telcos plus our STL Partners’ own viewpoint (Report 2).
  • Executive Summary
  • Introduction
  • Telecoms – the times they are a changin’
  • Europe, in particular, is facing great uncertainty
  • The role of this report
  • Understanding and classifying the forces of change
  • External (market) forces
  • Internal (telco) forces
  • Summary: The impact of internal and external forces over the next 5 years
  • STL Partners and Telco 2.0: Change the Game


  • Figure 1: O2’s SIM-only pay monthly tariffs – many with unlimited voice and messaging bundled in
  • Figure 2: A framework for classifying telco market forces: internal and external
  • Figure 3: Telefonica dividend yield vs Spanish 10-year bond yield
  • Figure 4: Customer attitudes to European telecoms brands – 2003 vs 2015
  • Figure 5: Summarising the key skills, partnerships, assets and culture needed to realise ambitions
  • Figure 6: SMS Price vs. penetration of Top OTT messaging apps in 2012
  • Figure 7: Summary of how internal and external forces could develop in the next 5 years

The ‘Agile Operator’: 5 Key Ways to Meet the Agility Challenge

Understanding Agility

What does ‘Agility’ mean? 

A number of business strategies and industries spring to mind when considering the term ‘agility’ but the telecoms industry is not front and centre… 

Agility describes the ability to change direction and move at speed, whilst maintaining control and balance. This innate flexibility and adaptability aptly describes an athlete, a boxer or a cheetah, yet this description can be (and is) readily applied in a business context. Whilst the telecoms industry is not usually referenced as a model of agility (and is often described as the opposite), a number of business strategies and industries have adopted more ‘agile’ approaches, attempting to simultaneously reduce inefficiencies, maximise the deployment of resources, learn though testing and stimulate innovation. It is worthwhile recapping some of the key ‘agile’ approaches as they inform our and the interviewees’ vision of agility for the telecoms operator.

When introduced, these approaches have helped redefine their respective industries. One of the first business strategies that popularised a more ‘agile’ approach was the infamous ‘lean-production’ and related ‘just-in-time’ methodologies, principally developed by Toyota in the mid-1900s. Toyota placed their focus on reducing waste and streamlining the production process with the mindset of “only what is needed, when it is needed, and in the amount needed,” reshaping the manufacturing industry.

The methodology that perhaps springs to many people’s minds when they hear the word agility is ‘agile software development’. This methodology relies on iterative cycles of rapid prototyping followed by customer validation with increasing cross-functional involvement to develop software products that are tested, evolved and improved repeatedly throughout the development process. This iterative and continuous improvement directly contrasts the waterfall development model where a scripted user acceptance testing phase typically occurs towards the end of the process. The agile approach to development speeds up the process and results in software that meets the end users’ needs more effectively due to continual testing throughout the process.

Figure 5: Agile Software Development

Source: Marinertek.com

More recently the ‘lean startup’ methodology has become increasingly popular as an innovation strategy. Similarly to agile development, this methodology also focuses on iterative testing (replacing the testing of software with business-hypotheses and new products). Through iterative testing and learning a startup is able to better understand and meet the needs of its users or customers, reducing the inherent risk of failure whilst keeping the required investment to a minimum. The success of high-tech startups has popularised this approach; however the key principles and lessons are not solely applicable to startups but also to established companies.

Despite the fact that (most of) these methodologies or philosophies have existed for a long time, they have not been adopted consistently across all industries. The digital or internet industry was built on these ‘agile’ principles, whereas the telecoms industry has sought to emulate this by adopting agile models and methods. Of course these two industries differ in nature and there will inevitably be constraints that affect the ability to be agile across different industries (e.g. the long planning and investment cycles required to build network infrastructure) yet these principles can broadly be applied more universally, underwriting a more effective way of working.

This report highlights the benefits and challenges of becoming more ‘agile’ and sets out the operator’s perspective of ‘agility’ across a number of key domains. This vision of the ‘Agile Operator’ was captured through 29 interviews with senior telecoms executives and is supplemented by STL analysis and research.

Barriers to (telco) agility 

…The telecoms industry is hindered by legacy systems, rigid organisational structures and cultural issues…

It is well known that the telecoms industry is hampered by legacy systems; systems that may have been originally deployed between 5-20 years ago are functionally limited. Coordinating across these legacy systems impedes a telco’s ability to innovate and customise product offerings or to obtain a complete view of customers. In addition to legacy system challenges, interview participants outlined a number of other key barriers to becoming more agile. Three principle barriers emerged:

  1. Legacy systems
  2. Mindset & Culture
  3. Organisational Structure & Internal Processes

Legacy Systems 

One of the main (and often voiced by interviewees) barriers to achieving greater agility are legacy systems. Dealing with legacy IT systems and technology can be very cumbersome and time-consuming as typically they are not built to be further developed in an agile way. Even seemingly simple change requests end in development queues that stretch out many months (often years). Therefore operators remain locked-in to the same, limited core capabilities and options, which in turn stymies innovation and agility. 

The inability to modify a process, a pricing plan or to easily on/off-board a 3rd-party product has significant ramifications for how agile a company can be. It can directly limit innovation within the product development process and indirectly diminish employees’ appetite for innovation.

It is often the case that operators are forced to find ‘workarounds’ to launch new products and services. These workarounds can be practical and innovative, yet they are often crude manipulations of the existing capabilities. They are therefore limited in terms what they can do and in terms of the information that can be captured for reporting and learning for new product development. They may also create additional technical challenges when trying to migrate the ‘workaround’ product or service to a new system. 

Figure 6: What’s Stopping Telco Agility?

Source: STL Partners

Mindset & Culture

The historic (incumbent) telco culture, born out of public sector ownership, is the opposite of an ‘agile’ mindset. It is one that put in place rigid controls and structure, repealed accountability and stymied enthusiasm for innovation – the model was built to maintain and scale the status quo. For a long time the industry invested in the technology and capabilities aligned to this approach, with notable success. As technology advanced (e.g. ever-improving feature phones and mobile data) this approach served telcos well, enhancing their offerings which in turn further entrenched this mindset and culture. However as technology has advanced even further (e.g. the internet, smartphones), this focus on proven development models has resulted in telcos becoming slow to address key opportunities in the digital and mobile internet ecosystems. They now face a marketplace of thriving competition, constant disruption and rapid technological advancement. 

This classic telco mindset is also one that emphasized “technical” product development and specifications rather than the user experience. It was (and still is) commonplace for telcos to invest heavily upfront in the creation of relatively untested products and services and then to let the product run its course, rather than alter and improve the product throughout its life.

Whilst this mindset has changed or is changing across the industry, interviewees felt that the mindset and culture has still not moved far enough. Indeed many respondents indicated that this was still the main barrier to agility. Generally they felt that telcos did not operate with a mindset that was conducive to agile practices and this contributed to their inability to compete effectively against the internet players and to provide the levels of service that customers are beginning to expect. 

Organisational Structure & Internal Processes

Organisational structure and internal processes are closely linked to the overall culture and mindset of an organisation and hence it is no surprise that interviewees also noted this aspect as a key barrier to agility. Interviewees felt that the typical (functionally-orientated) organisational structure hinders their companies’ ability to be agile: there is a team for sales, a team for marketing, a team for product development, a network team, a billing team, a provisioning team, an IT team, a customer care team, a legal team, a security team, a privacy team, several compliance teams etc.. This functional set-up, whilst useful for ramping-up and managing an established product, clearly hinders a more agile approach to developing new products and services through understanding customer needs and testing adoption/behaviour. With this set-up, no-one in particular has a full overview of the whole process and they are therefore not able to understand the different dimensions, constraints, usage and experience of the product/service. 

Furthermore, having these discrete teams makes it hard to collaborate efficiently – each team’s focus is to complete their own tasks, not to work collaboratively. Indeed some of the interviewees blamed the organisational structure for creating a layer of ‘middle management’ that does not have a clear understanding of the commercial pressures facing the organisation, a route to address potential opportunities nor an incentive to work outside their teams. This leads to teams working in silos and to a lack of information sharing across the organisation.

A rigid mindset begets a rigid organisational structure which in turn leads to the entrenchment of inflexible internal processes. Interviewees saw internal processes as a key barrier, indicating that within their organisation and across the industry in general internal decision-making is too slow and bureaucratic.


Interviewees noted that there were too many checks and processes to go through when making decisions and often new ideas or opportunities fell outside the scope of priority activities. Interviewees highlighted project management planning as an example of the lack of agility; most telcos operate against 1-2 year project plans (with associated budgeting). Typically the budget is locked in for the year (or longer), preventing the re-allocation of financing towards an opportunity that arises during this period. This inflexibility prevents telcos from quickly capitalising on potential opportunities and from (re-)allocating resources more efficiently.

  • Executive Summary
  • Understanding Agility
  • What does ‘Agility’ mean?
  • Barriers to (telco) agility
  • “Agility” is an aspiration that resonates with operators
  • Where is it important to be agile?
  • The Telco Agility Framework
  • Organisational Agility
  • The Agile Organisation
  • Recommended Actions: Becoming the ‘Agile’ Organisation
  • Network Agility
  • A Flexible & Scalable Virtualised Network
  • Recommended Actions: The Journey to the ‘Agile Network’
  • Service Agility
  • Fast & Reactive New Service Creation & Modification
  • Recommended Actions: Developing More-relevant Services at Faster Timescales
  • Customer Agility
  • Understand and Make it Easy for your Customers
  • Recommended Actions: Understand your Customers and Empower them to Manage & Customise their Own Service
  • Partnering Agility
  • Open and Ready for Partnering
  • Recommended Actions: Become an Effective Partner
  • Conclusion


  • Figure 1: Regional & Functional Breakdown of Interviewees
  • Figure 2: The Barriers to Telco Agility
  • Figure 3: The Telco Agility Framework
  • Figure 4: The Agile Organisation
  • Figure 5: Agile Software Development
  • Figure 6: What’s Stopping Telco Agility?
  • Figure 7: The Importance of Agility
  • Figure 8: The Drivers & Barriers of Agility
  • Figure 9: The Telco Agility Framework
  • Figure 10: The Agile Organisation
  • Figure 11: Organisational Structure: Functional vs. Customer-Segmented
  • Figure 12: How Google Works – Small, Open Teams
  • Figure 13: How Google Works – Failing Well
  • Figure 14: NFV managed by SDN
  • Figure 15: Using Big Data Analytics to Predictively Cache Content
  • Figure 16: Three Steps to Network Agility
  • Figure 17: Launch with the Minimum Viable Proposition – Gmail
  • Figure 18: The Key Components of Customer Agility
  • Figure 19: Using Network Analytics to Prioritise High Value Applications
  • Figure 20: Knowing When to Partner
  • Figure 21: The Telco Agility Framework

Netflix: Threat or Opportunity?

Introduction

The way in which audiences consume movies and television content appears to be changing.  While ‘linear’ viewing of scheduled channels remains robust, the market for DVD has collapsed and new pricing and consumption models are opening up.

At the forefront of this is Netflix – with a total of 63M paying subscribers across 50 markets (it is present in a large number of locations in Latin America and the Caribbean) and a penetration of over 34% in the US, Netflix has created a new paradigm for on demand content.

How this model is going to impact other players in the market in the long term is as yet unclear. To date in the US, pay platform penetration has remained robust, premium channels such as HBO are also performing strongly, and for rights owners and producers a new player bidding for rights is hugely welcome.

So is Netflix a ‘win: win’ opportunity for all concerned?  It may not be that straightforward.  

  • For leading pay TV players, Netflix will be yet another component forcing them to invest in innovation to minimise customers churning from bundled packages, and reducing flexibility around price increases;
  • For TV channels Netflix could lead to programme rights inflation, as a new player with a distinct business model comes into bid for premium exclusive content rights
  • For both established TV platforms and premium channels there is the risk that in price sensitive markets or demographics Netflix offers may gain traction, particularly among younger consumers at the expense of traditional subscription models.
  • For telcos looking to compete with cable and satellite, while Netflix could offer a cost effective way to deliver attractive premium content, it also carries a risk of constraining the telcos into the position of a ‘dumb (or happy) pipe’, not sharing in upsides and not owning the consumer who deals directly with Netflix.

STL Partners has partnered with Prospero Strategy Consultants who work extensively with content and platform players on new market dynamics to prepare this Briefing. The work has drawn on interviews with key players and analysis of quantitative and qualitative market data, to determine the threats and opportunities emerging from this new content ecosystem and how these are likely to develop.

Overview of Netflix History

Netflix began as a postal DVD business in the US in 1997, launching its US subscription streaming service in 2007.  Since 2011 it has focused on rapid expansion into international markets with the biggest growth now coming from international subscribers (67% growth between 2013 and 2014) while its US DVD business is now in decline.

Figure 4: Netflix subscribers 1999 – 2014(Q3) in 000s

Source: Netflix annual reports, STL Partners & Prospero analysis

Netflix changed its reporting methodology from Q1 2011

Consumer Proposition and USPs

The success of the Netflix proposition to consumers has been based on a number of components:

  • Low Price and refusal to tie users into long-term contracts
  • Volume and exclusivity of content
  • Effective User Interface, recommendation engine and multi-device access
  • Customer Data

Low Price
The low monthly price point of Netflix (USD7.99 per month in the US rising to USD8.99 for new subscribers in 2014) has been a key component of the company’s success. This price point is less than the cost of purchasing a single DVD and significantly less than monthly premium drama channels such as HBO (at ~USD15 per month). This price point (and that users are not tied into long term contracts) allows Netflix to attract distinct audience groups.

  • First, the high-end audience who are already pay subscribers.  These customers have demonstrated that they are typically price inelastic and willing to pay for more, buying Netflix on top of existing services.
  • Second, the price constrained audiences, for whom traditional pay TV is out of reach but who are interested in expanded choice.  These are often younger demographics for whom the concept of non-linear consumption is very familiar.
  • There is a third audience group, the price sensitive pay TV subscribers for whom Netflix could be an effective substitute and who could churn off traditional pay TV (either completely or partially) as a result.  While the evidence around the impact on this group is as yet nascent, it is this segment that is making incumbent pay TV players nervous.

Figure 5: Reasons Netflix streamers subscribe to the Service

Source: Alphawise, 3rd Annual Streaming Video Survey – More Devices, More Consumption, March 2013

Volume and Exclusivity

As demonstrated in Figure 5 above a key to success has been offering both range and quality of content.  However, over time the shape of the Netflix library has changed as it has used its customer insight and data to inform its rights strategy.

  • In February 2012 the Netflix US library consisted of ~15k titles (Source: SNL Kagan) of which nearly three quarters were movie titles.
  • Since 2012 the volume of library titles has declined by approximately 30% nearly all of which is accounted for by a decline in movie titles.  Netflix has increased its focus on long run drama series which already have brand recognition and which are effective at attracting and keeping audiences.
  • Interestingly, the volume of content being offered in its international markets is significantly less than in the US (about one-third) as Netflix shifts its focus to quality (as opposed to quantity of content)

Netflix’s early content deals were typically library rights and non-exclusive.  Over time that mix has shifted as Netflix increasingly looks to have a component of exclusivity with the aim of shifting from a “nice to have” to a “must have” service

  • Netflix is investing in original production of a limited number of high profile, high end drama series (such as House of Cards, Orange is the only Black and the recently announced Crouching Tiger Hidden Dragon sequel).  For these Netflix can retain its exclusive rights indefinitely.
  • In addition, Netflix is bidding aggressively for exclusive windows for high end content (such as the recently announced deal for exclusive VOD rights in all territories for Gotham and first window rights in several territories for Penny Dreadful).

Figure 6: Netflix’s Evolving Content Proposition


Source: STL Partners & Prospero analysis

Effective consumer interface on multiple devices

Netflix has evolved a highly effective consumer interface, enabling personalisation by individual members in the household, with an easy to manage and visually effective selection mechanism.

  • Since 2008 Netflix has rolled out its proposition across multiple connected devices, with the most recent development being access on mobile devices and partnership with 4G operators such as Vodafone.  Cross device functionality gives users a consistent experience.
  • The consumer is able to choose when and where to consume Netflix content – leading to a new dynamic of series “bingeing” analogous to box set consumption.  In addition, Netflix’s deals with Smart TV providers gives consumers the ability to by-pass traditional pay TV gatekeepers.

Figure 7: Netflix’s user interface

Source: Netflix & SNL Kagan

Customer Data

  • Underlying a huge part of their success is Netflix’s control of its data.  This includes knowledge of individuals within households (who will have their own profiles), detailed insight into viewing behaviour (not just what, but when and how much), knowledge that no linear channel can match.
  • In all markets (regardless of its distribution partners) Netflix retains its customer data and does not share it.  This informs its rights negotiations and new programme investments.
  • Netflix continues to refine its customer understanding using sophisticated A/B testing where small sub groups are given slightly different user experiences to see how this changes behaviour


  • Executive Summary
  • Introduction
  • Overview of Netflix
  • History
  • Consumer Proposition and USPs
  • Netflix International Expansion
  • Netflix Financials
  • Attitude of the Financial Markets
  • Impact of Netflix on the Market
  • Impact on Rights Owners and Producers
  • Impact on Channels
  • Impact on Pay Platforms
  • Impact on Broadband Operators
  • Summary impacts on players along the value chain
  • Responses to Netflix
  • Case Study: HBO
  • Case Study: BSkyB
  • Case Study: Broadband Operators
  • Case Study: New Competitors


  • Figure 1: Selected Media Companies Market Capitalisation, 1st Sept. 2014 (left) & 1st Jan. 2015 (right), USD billion
  • Figure 2: Netflix’s subscriber targets for 2020 (announced launches only) in USD million
  • Figure 3: Summary of Netflix’s Impacts along the Value Chain
  • Figure 4: Netflix subscribers 1999 – 2014 in 000s
  • Figure 5: Reasons Netflix streamers subscribe to the Service
  • Figure 6: Netflix’s Evolving Content Proposition
  • Figure 7: Netflix’s user interface
  • Figure 8: Netflix geography and timeline
  • Figure 9: Netflix’s Market Penetration over time to Dec 2013 (% households)
  • Figure 10: Netflix revenue per service area, 1999 – 2014, USD million
  • Figure 11: Netflix’s revenues & costs per business line, 2011–2014, USD million
  • Figure 12: Netflix’s net income and free cash flow, 2009 – 2014, USD million
  • Figure 13: Netflix’s streaming content obligations, 2010 – 2013, USD million
  • Figure 14: Selected Media Companies Market Capitalisation, 1st Sept. 2014 (left) & 1st Jan. 2015 (right), USD billion
  • Table 1: Comparison of Key Value Ratios
  • Figure 15: Netflix’s share price (USD), Jan 2010 – Jan 2015
  • Figure 16: Players along the Value Chain
  • Figure 17: Subscribers to premium channels in the US (%of TV households)
  • Figure 18: Changes in US Pay TV Penetration
  • Figure 19: Percentage of Households that are “cord-cutters”
  • Figure 20: Real Time Entertainment Share of Downstream Traffic
  • Figure 21: Share of Traffic of Downstream Peak Time Applications
  • Figure 22: Summary of Impacts along the Value Chain
  • Figure 23: Overview of Sky Expanded Offering
  • Figure 24: Sky’s offering across All Windows
  • Figure 25: Vodafone / Spotify and Sky Sport deals – Impact on mobile broadband usage
  • Figure 26: Netflix Broadband Partners
  • Figure 27: Netflix Competitor Set

Five Principles for Disruptive Strategy

Introduction

Disruption has become a popular theme, and there are some excellent studies and theories, notably the work of Clayton Christensen on disruptive innovation.

This briefing is intended to add some of our observations, ideas and analysis from looking at disruptive forces in play in the telecoms market and the adjacent areas of commerce and content that have had and will have significant consequences for telecoms.

Our analysis centres on the concept of a business model: a relatively simple structure that can be used to describe and analyse a business and its strategy holistically. The structure we typically use is shown below in Figure 1, and comprises 5 key domains: The Marketplace; Service Offering; Value Network; Finance; and Technology.

Figure 1 – A business model is the commercial architecture of a business: how it makes money

Telco 2.0: STL Partners standard business model analysis Framework

Source: STL Partners

This structure is well suited to analysis of disruption, because disruptive competition is generally a case of conflict between companies with different business models, rather than competition between similarly configured businesses.

A disruptive competitor, such as Facebook for telecoms operators, may be in a completely different core business (advertising and marketing services) seeking to further that business model by disrupting an existing telecoms service (voice and messaging communications). Or it may be a broadly similar player, such as Free in France whose primary business is recognisably telecoms, using a radically different operational model to gain share from direct competitors.

We will look at some of these examples in more depth in this report, and also call on analysis of Google, Apple, Facebook and Amazon to illustrate principles

Digital value is often transient

KPN: a brief case study in disruption

KPN, a mobile operator in the Netherlands, started to report a gradual reduction in SMS / user statistics in early 2011, after a long period of near continuous growth.

Figure 2 – KPN’s SMS stats per user started to change at the end of 2010

Telco 2.0 Figure 2 KPNs SMS stats per user stated to change at the end of 2010

Source: STL Partners, Mobile World Database

KPN linked this change to the rapid rise of the use of WhatsApp, a so-called over-the-top (OTT) messaging application it had noticed among ‘advanced users’ – a set of younger Android customers, as shown in Figure 3.

Figure 3 – WhatsApp took off in certain segments at the end of 2010

Telco 2.0 Figure 3 WhatsApp took off in certain segments at the end of 2010

Source: KPN Corporate Briefing, May 2011

There was some debate at the time about the causality of the link, but the longer term picture of use and app penetration certainly supports the connection between the rise of WhatsApp take-up among KPN’s broader base (as opposed to ‘advanced users’ in Figure 3) and the rapid decline of SMS volumes as Figure 4 shows.

Figure 4 – KPN’s SMS volumes have continued to decline since 2010

Telco 2.0 Figure 4 KPN’s SMS volumes have continued to decline since 2010

Source: STL Partners estimates, Mobile World, Telecomspaper, Statista, Comscore, KPN.

How did that happen then?

KPN’s position was particularly suited to a disruptive attack by WhatsApp (and other messaging apps) in the Netherlands because:

  • It had relatively high unit prices per SMS.
  • KPN had not ‘bundled’ many SMSs into its packages compared to other operators, and usage was very much ‘pay as you go’ – so using WhatsApp offered immediate savings to users.
  • Its market of c.17 million people is technologically savvy with high early smartphone penetration, and densely populated for such a wealthy country, so well suited to the rapid viral growth of such apps.

KPN responded by increasing the number of SMSs in bundles and attempting to ‘sell up’ users to packages with bigger bundles. It has also embarked on more recent programmes of cost reduction and simplification. But as far as SMS was concerned, the ‘horse had bolted the stable’ and the decline continues as consumers gravitate away from a service perceived as losing relevance and value.

We will look in more depth at disruptive pricing and product design strategies in the section on ‘Free is not enough, nor is it the real issue’ later in this report. This case study also presents another challenge for strategists: why did the company not act sooner and more effectively?

Denial is not a good defence

One might be forgiven for thinking that the impact of WhatsApp on KPN was all a big surprise. And perhaps to some it was. But there were plenty of people that expected significant erosion of core revenues from such disruption. In a survey we conducted in 2011, the average forecast among 300 senior global telecoms execs was that OTT services would lead to a 38% decline in SMS over the next 3-5 years, and earlier surveys had shown similar pessimism.

Having said that, it is also true that there was some shock in the market at the time over KPN’s results, and subsequent findings in other markets in Latin America and elsewhere. It is only recently that it has become more of an accepted ‘norm’ in the industry that its core revenues are subject to attack and decline.

Perhaps the best narrative explanation is one of ‘corporate denial’, akin to the human process of grief. Before we reach acceptance of a loss, individuals (and consequently teams and organisations by this theory) go through various stages of emotional response before reaching ‘acceptance’ – a series of stages sometimes characterised as ‘denial, anger, negotiation and acceptance’. This takes time, and is generally considered healthy for people’s emotional health, if not necessarily organisations’ commercial wellbeing.

So what can be done about this? It’s hard to change nature, but it is possible to recognise circumstances and prepare forward plans differently. In the digital era, leaders, strategists, marketers, and product managers need to recognise that profit pools are increasingly transient, and if you are skilful or lucky enough to have one in your portfolio, it is critical to anticipate that someone is probably working on how to disrupt it, and to gather and act quickly on intelligence on realistic threats. There are also steps that can be taken to improve defensive positions against disruption, and we look at some of these in this report. It isn’t always possible because sometimes the start point is not ideal – but then again, part of the art is to avoid that position.


  • Executive Summary: five principles
  • Introduction
  • Digital value is often transient
  • KPN: a brief case study in disruption
  • How did that happen then?
  • Denial is not a good defence
  • Timing a disruptive move is critical
  • Disruption visibly destroys value
  • So when should strategists choose disruption?
  • Free is not enough, nor is it the real issue
  • How market winners meet needs better
  • How to compete with ‘free’?
  • Build the platform, feed the flywheel
  • Nurture the ecosystem
  • …don’t price it to death


  • Figure 1 – A business model is the commercial architecture of a business: how it makes money
  • Figure 2 – KPN’s SMS stats per user started to change at the end of 2010
  • Figure 3 – WhatsApp took off in certain segments at the end of 2010
  • Figure 4 – KPN’s SMS volumes have continued to decline since 2010
  • Figure 5 – Free’s disruptive play is destroying value in the French Market, Q1 2012-Q3 2014
  • Figure 6 – Verizon is winning in the US – but most players are still growing too, Q1 2011-Q1 2014
  • Figure 7 – How ‘OTT’ apps meet certain needs better than core telco services
  • Figure 8 – US and Spain: different approaches to disruptive defence
  • Figure 9 – The Amazon platform ‘flywheel’ of success

Are Telefonica, AT&T, Ooredoo, SingTel, and Verizon aiming for the right goals?

The importance of setting Telco 2.0 goals…

Communications Service Providers (CSPs) in all markets are now embracing new Telco 2.0 business models in earnest.  However, this remains a period of exploration and experimentation and a clear Telco 2.0 goal has not yet emerged for most players. At the most basic level, senior managers and strategists face a fundamental question:

What is an appropriate Telco 2.0 goal given my organisation’s current performance and market conditions?

This note introduces a framework based on analysis undertaken for the Telco 2.0 Transformation Index and offers some initial thoughts on how to start addressing this question [1] by exploring 5 CSPs in the context of the markets in which they operate and their current business model transformation performances.

Establishing the right Telco 2.0 goal for the organisation is an important first-step for senior management in the telecoms industry because:

  • Setting a Telco 2.0 goal that is unrealistically bold will quickly result in a sense of failure and a loss of morale among employees;
  • Conversely, a lack of ambition will see the organisation squeezed slowly and remorselessly into a smaller and smaller addressable market as a utility pipe provider.

Striking the right balance is critical to avoid these two unattractive outcomes.

…and the shortcomings of traditional frameworks

Senior management teams and strategists within the telecoms industry already have tools and approaches for managing investments and setting corporate goals.  So why is a fresh approach needed?  Put simply, the telecoms market is in the process of being irreversibly disrupted.  As we show in the first part of this note, traditional thinking and frameworks offer a view of the ‘as-is’ world but one which is changing fast because CSPs’ core communications services are being substituted by alternate offerings from new competitors.  The game is changing before our eyes and managers must think (and act) differently.  The framework outlined in summary here and covered in detail in the Telco 2.0 Transformation Index is designed to facilitate this fresh thinking.

Traditional strategic frameworks are useful to assess the ‘Telco 1.0’ situation

Understanding CSP groups’ ‘Telco 1.0’ strategic positioning: Ooredoo in a position of strength

Although they lack the detailed information and deep knowledge of the telecoms industry, investors have the benefit of an impartial view of different CSPs.  Unlike CSP management teams, they generally carry little personal ‘baggage’ and instead take a cold arm’s length approach to evaluating companies.  Their investment decisions obviously take into account future profit prospects and the current share price for each company to determine whether a stock is good value or not.  Leaving aside share prices, how might an investor sensibly appraise the ‘traditional’ Telco 1.0 telecoms market?

One classic framework plots competitive position against market attractiveness.  STL Partners has conducted this for 5 CSP groups in different markets as part of the analysis undertaken for the Telco 2.0 Transformation Index (see Figure 1).  According to the data collected, Ooredoo appears to be in the strongest position and, therefore, the most attractive potential investment vehicle.  Telefonica and SingTel appear to be moderately attractive and, surprisingly to many, Verizon and AT&T least attractive.

Figure 1: Strategic positioning framework for 5 CSP groups
Strategic Positioning Framework March 2014

Source: STL Partners’ Telco 2.0 Transformation Index, February 2014

Determining a CSP’s Telco 1.0 competitive position: Ooredoo enjoying life in the least competitive markets

As with all analytical tools, the value of the framework in Figure 1 is dependent upon the nature of the data collected and the methodology for converting it into comparable scores.  The full data set, methodology, and scoring tables for this and other analyses are available in the Telco 2.0 Transformation Index Benchmarking Report.  In this report, we will explore a small part of the data which drives part of the vertical axis scores in Figure 1 – Competitive Position (we exclude Customer Engagement in this report for simplicity).  In the Index methodology, there are 7 factors that determine ‘Competitive Position’ which are split into 2 categories:

  • Market competition, a consolidated score driven by:
  • Herfindahl score.  A standard economic indicator of competitiveness, reflecting the state of development of the underlying market structure, with more consolidated markets being less competitive and scoring more highly on the Herfindahl score.
  • Mobile revenue growth.  The compound annual growth of mobile revenues over a 2-year period.  Growing markets generally display less competition as individual players need to fight less hard to achieve growth.
  • Facebook penetration.  A proxy for the strength of internet and other ‘OTT’ players in the market.
  • CSP market positioning, driven by:
  • CSP total subscribers. The overall size of the CSP across all its markets.
  • CSP monthly ARPU as % of GDP per capita. The ability of the CSP to provide value to consumers relative to their income – essentially the CSP’s share of consumer wallet.
  • CSP market share. Self-explanatory – the relative share of subscribers.
  • CSP market share gain/loss. The degree to which the CSP is winning or losing subscribers relative to its peers.

If we look at the first 3 factors – those that drive fundamental market competition – it is clear why Ooredoo scores highly:

  • Its markets are substantially more consolidated than those of the other players (Figure 2).  Surprisingly, given the regular accusations of the US market being a duopoly, Verizon and AT&T have the most fragmented and competitive markets in the US.  For the fixed market, this latter point may be overstated since the US, for consumer and SME segments at least, is effectively carved up into regional areas where major fixed operators like Verizon and AT&T often do not compete head-to-head.
  • Its markets enjoy the strongest mobile revenue growth at 8.1% per annum between 2010 and 2012 versus 4.6% in Telefonica’s markets (fast in Latin America and negative in Europe), 5% in the US, and an annual decline (-1.7% ) for SingTel (Figure 3).
  • Facebook and the other internet players are much weaker in Ooredoo’s Middle Eastern markets than in Asia Pacific and Australia (SingTel), Europe and Latin America (Telefonica) and particularly the US (Verizon and AT&T) – see Figure 4.

 Figure 2: Herfindahl Score – Ooredoo enjoys the least competitive markets

Market Herfindahl Score March 2014

Note: Verizon and AT&T have slightly different scores owing the different business mixes between fixed and mobile within the US market

Source: STL Partners’ Telco 2.0 Transformation Index, February 2014

Figure 3: Ooredoo enjoying the strongest mobile market growth
Mobile Market Revenue Growth 2010-2012 March 2014

Source: STL Partners’ Telco 2.0 Transformation Index, February 2014

Ooredoo also operates in markets that have less competition from new players. For example, social network penetration is 56% in North America where AT&T and Verizon operate, 44% in Europe and South America where Telefonica operates, 58% in Singapore but only 34% in Qatar (Ooredoo’s main market) and 24% in the Middle East on average.


  • Identifying an individual CSP’s Telco 1.0 strategy: Telefonica Group in ‘harvest’ mode in most markets – holding prices, sacrificing share, generating cash
  • Frameworks used in the Telco 2.0 Transformation Index help identify evolving goals and strategies for CSPs
  • Traditional frameworks fail to account for new competitors, new services, new business models…
  • …but understanding how well each CSP is transforming to a new business model uncovers the optimum Telco 2.0 goal
  • STL Partners and the Telco 2.0™ Initiative


  • Figure 1: Strategic positioning framework for 5 CSP groups
  • Figure 2: Herfindahl Score – Ooredoo enjoys the least competitive markets
  • Figure 3: Ooredoo enjoying the strongest mobile market growth
  • Figure 4: Telefonica in harvest mode – milking companies for cash
  • Figure 5: Telco 2.0 Transformation Index strategic goals framework

Communications Services: What now makes a winning value proposition?

Introduction

This is an extract of two sections of the latest Telco 2.0 Strategy Report The Future Value of Voice and Messaging for members of the premium Telco 2.0 Executive Briefing Service.

The full report:

  • Shows how telcos can slow the decline of voice and messaging revenues and build new communications services to maximise revenues and relevance with both consumer and enterprise customers.
  • Includes detailed forecasts for 9 markets, in which the total decline is forecast between -25% and -46% on a $375bn base between 2012 and 2018, giving telcos an $80bn opportunity to fight for.
  • Shows impacts and implications for other technology players including vendors and partners, and general lessons for competing with disruptive players in all markets.
  • Looks at the impact of so-called OTT competition, market trends and drivers, bundling strategies, operators developing their own Telco-OTT apps, advanced Enterprise Communications services, and the opportunities to exploit new standards such as RCS, WebRTC and VoLTE.

The Transition in User Behaviour

A global change in user behaviour

In November, 2012 we published European Mobile: The Future’s not Bright, it’s Brutal. Very soon after its publication, we issued an update in the light of results from Vodafone and Telefonica that suggested its predictions were being borne out much faster than we had expected.

Essentially, the macro-economic challenges faced by operators in southern Europe are catalysing the processes of change we identify in the industry more broadly.

This should not be seen as a “Club Med problem”. Vodafone reported a 2.7% drop in service revenue in the Netherlands, driven by customers reducing their out-of-bundle spending. This sensitivity and awareness of how close users are getting to their monthly bundle allowances is probably a good predictor of willingness to adopt new voice and messaging applications, i.e. if a user is regularly using more minutes or texts than are included in their service bundle, they will start to look for free or lower cost alternatives. KPN Mobile has already experienced a “WhatsApp shock” to its messaging revenues. Even in Vodafone Germany, voice revenues were down 6.1% and messaging 3.7%. Although enterprise and wholesale business were strong, prepaid lost enough revenue to leave the company only barely ahead. This suggests that the sizable low-wage segment of the German labour market is under macro-economic stress, and a shock is coming.

The problem is global, for example, at the 2013 Mobile World Congress, the CEO of KT Corp described voice revenues as “collapsing” and stated that as a result, revenues from their fixed operation had halved in two years. His counterpart at Turk Telekom asserted that “voice is dead”.

The combination of technological and macro-economic challenge results in disruptive, rather than linear change. For example, Spanish subscribers who adopt WhatsApp to substitute expensive operator messaging (and indeed voice) with relatively cheap data because they are struggling financially have no particular reason to return when the recovery eventually arrives.

Price is not the only issue

Also, it is worth noting that price is not the whole problem. Back at MWC 2013, the CEO of Viber, an OTT voice and messaging provider, claimed that the app has the highest penetration in Monaco, where over 94% of the population use Viber every day. Not only is Monaco somewhere not short of money, but it is also a market where the incumbent operator bundles unlimited SMS, though we feel that these statistics might slightly stretch the definition of population as there are many French subscribers using Monaco SIM cards. However, once adoption takes off it will be driven by social factors (the dynamics of innovation diffusion) and by competition on features.

Differential psychological and social advantages of communications media

The interaction styles and use cases of new voice and messaging apps that have been adopted by users are frequently quite different to the ones that have been imagined by telecoms operators. Between them, telcos have done little more than add mobility to telephony during the last 100 years, However, because of the Internet and growth of the smartphone, users now have many more ways to communicate and interact other than just calling one another.

SMS (only telcos’ second mass ‘hit’ product after voice) and MMS are “fire-and-forget” – messages are independent of each other, and transported on a store-and-forward basis. Most IM applications are either conversation-based, with messages being organised in threads, or else stream-based, with users releasing messages on a broadcast or publish-subscribe basis. They often also have a notion of groups, communities, or topics. In getting used to these and internalising their shortcuts, netiquette, and style, customers are becoming socialised into these applications, which will render the return of telcos as the messaging platform leaders with Rich Communication System (RCS) less and less likely. Figure 1 illustrates graphically some important psychological and social benefits of four different forms of communication.

Figure 1:  Psychological and social advantages of voice, SMS, IM, and Social Media

Psychological and social advantages of voice, SMS, IM, and Social Media Dec 2013

Source: STL Partners

The different benefits can clearly be seen. Taking voice as an example, we can see that a voice call could be a private conversation, a conference call, or even part of a webinar. Typically, voice calls are 1 to 1, single instance, and with little presence information conveyed (engaged tone or voicemail to others). By their very nature, voice calls are real time and have a high time commitment along with the need to pay attention to the entire conversation. Whilst not as strong as video or face to face communication, a voice call can communicate high emotion and of course is audio.

SMS has very different advantages. The majority of SMS sent are typically private, 1 to 1 conversations, and are not thread based. They are not real time, have no presence information, and require low time commitment, because of this they typically have minimal attention needs and while it is possible to use a wide array of emoticons or smileys, they are not the same as voice or pictures. Even though some applications are starting to blur the line with voice memos, today SMS messaging is a visual experience.

Instant messaging, whether enterprise or consumer, offers a richer experience than SMS. It can include presence, it is often thread based, and can include pictures, audio, videos, and real time picture or video sharing. Social takes the communications experience a step further than IM, and many of the applications such as Facebook Messenger, LINE, KakaoTalk, and WhatsApp are exploiting the capabilities of these communications mechanisms to disrupt existing or traditional channels.

Voice calls, whether telephony or ‘OTT’, continue to possess their original benefits. But now, people are learning to use other forms of communication that better fit the psychological and social advantages that they seek in different contexts. We consider these changes to be permanent and ongoing shifts in customer behaviour towards more effective applications, and there will doubtless be more – which is both a threat and an opportunity for telcos and others.

The applicable model of how these shifts transpire is probably a Bass diffusion process, where innovators enter a market early and are followed by imitators as the mass majority. Subsequently, the innovators then migrate to a new technology or service, and the cycle continues.

One of the best predictors of churn is knowing a churner, and it is to be expected that users of WhatsApp, Vine, etc. will take their friends with them. Economic pain will both accelerate the diffusion process and also spread it deeper into the population, as we have seen in South Korea with KakaoTalk.

High-margin segments are more at risk

Generally, all these effects are concentrated and emphasised in the segments that are traditionally unusually profitable, as this is where users stand to gain most from the price arbitrage. A finding from European Mobile: The Future’s not Bright, it’s Brutal and borne out by the research carried out for this report is that prices in Southern Europe were historically high, offering better margins to operators than elsewhere in Europe. Similarly, international and roaming calls are preferentially affected – although international minutes of use continue to grow near their historic average rates, all of this and more accrues to Skype, Google, and others. Roaming, despite regulatory efforts, remains expensive and a target for disruptors. It is telling that Truphone, a subject of our 2008 voice report, has transitioned from being a company that competed with generic mobile voice to being one that targets roaming.


  • Consumers: enjoying the fragmentation
  • Enterprises: in search of integration
  • What now makes a winning value proposition?
  • The fall of telephony
  • Talk may be cheap, but time is not
  • The increasing importance of “presence”
  • The competition from Online Service Providers
  • Operators’ responses
  • Free telco & other low-cost voice providers
  • Meeting Enterprise customer needs
  • Re-imagining customer service
  • Telco attempts to meet changing needs
  • Voice Developers – new opportunities
  • Into the Hunger Gap
  • Summary: the changing telephony business model
  • Conclusions
  • STL Partners and the Telco 2.0™ Initiative


  • Figure 1:  Psychological and social advantages of voice, SMS, IM, and Social Media
  • Figure 2: Ideal Enterprise mobile call routing scenario
  • Figure 3: Mobile Clients used to bypass high mobile call charges
  • Figure 4: Call Screening Options
  • Figure 5: Mobile device user context and data source
  • Figure 6: Typical business user modalities
  • Figure 7:  OSPs are pursuing platform strategies
  • Figure 8: Subscriber growth of KakaoTalk
  • Figure 9: Average monthly minutes of use by market
  • Figure 10: Key features of Voice and Messaging platforms
  • Figure 11: Average user screen time Facebook vs. WhatsApp  (per month)
  • Figure 12: Disruptive price competition also comes from operators
  • Figure 13: The hunger gap in music

The Future Value of Voice and Messaging

Background – ‘Voice and Messaging 2.0’

This is the latest report in our analysis of developments and strategies in the field of voice and messaging services over the past seven years. In 2007/8 we predicted the current decline in telco provided services in Voice & Messaging 2.0 “What to learn from – and how to compete with – Internet Communications Services”, further articulated strategic options in Dealing with the ‘Disruptors’: Google, Apple, Facebook, Microsoft/Skype and Amazon in 2011, and more recently published initial forecasts in European Mobile: The Future’s not Bright, it’s Brutal. We have also looked in depth at enterprise communications opportunities, for example in Enterprise Voice 2.0: Ecosystem, Species and Strategies, and trends in consumer behaviour, for example in The Digital Generation: Introducing the Participation Imperative Framework.  For more on these reports and all of our other research on this subject please see here.

The New Report


This report provides an independent and holistic view of voice and messaging market, looking in detail at trends, drivers and detailed forecasts, the latest developments, and the opportunities for all players involved. The analysis will save valuable time, effort and money by providing more realistic forecasts of future potential, and a fast-track to developing and / or benchmarking a leading-edge strategy and approach in digital communications. It contains

  • Our independent, external market-level forecasts of voice and messaging in 9 selected markets (US, Canada, France, Germany, Spain, UK, Italy, Singapore, Taiwan).
  • Best practice and leading-edge strategies in the design and delivery of new voice and messaging services (leading to higher customer satisfaction and lower churn).
  • The factors that will drive best and worst case performance.
  • The intentions, strategies, strengths and weaknesses of formerly adjacent players now taking an active role in the V&M market (e.g. Microsoft)
  • Case studies of Enterprise Voice applications including Twilio and Unified Communications solutions such as Microsoft Office 365
  • Case studies of Telco OTT Consumer Voice and Messaging services such as like Telefonica’s TuGo
  • Lessons from case studies of leading-edge new voice and messaging applications globally such as Whatsapp, KakaoTalk and other so-called ‘Over The Top’ (OTT) Players


It comprises a 18 page executive summary, 260 pages and 163 figures – full details below. Prices on application – please email contact@telco2.net or call +44 (0) 207 247 5003.

Benefits of the Report to Telcos, Technology Companies and Partners, and Investors


For a telco, this strategy report:

  • Describes and analyses the strategies that can make the difference between best and worst case performance, worth $80bn (or +/-20% revenues) in the 9 markets we analysed.
  • Externally benchmarks internal revenue forecasts for voice and messaging, leading to more realistic assumptions, targets, decisions, and better alignment of internal (e.g. board) and external (e.g. shareholder) expectations, and thereby potentially saving money and improving contributions.
  • Can help improve decisions on voice and messaging services investments, and provides valuable insight into the design of effective and attractive new services.
  • Enables more informed decisions on partner vs competitor status of non-traditional players in the V&M space with new business models, and thereby produce better / more sustainable future strategies.
  • Evaluates the attractiveness of developing and/or providing partner Unified Communication services in the Enterprise market, and ‘Telco OTT’ services for consumers.
  • Shows how to create a valuable and realistic new role for Voice and Messaging services in its portfolio, and thereby optimise its returns on assets and capabilities


For other players including technology and Internet companies, and telco technology vendors

  • The report provides independent market insight on how telcos and other players will be seeking to optimise $ multi-billion revenues from voice and messaging, including new revenue streams in some areas.
  • As a potential partner, the report will provide a fast-track to guide product and business development decisions to meet the needs of telcos (and others).
  • As a potential competitor, the report will save time and improve the quality of competitor insight by giving strategic insights into the objectives and strategies that telcos will be pursuing.


For investors, it will:

  • Improve investment decisions and strategies returning shareholder value by improving the quality of insight on forecasts and the outlook for telcos and other technology players active in voice and messaging.
  • Save vital time and effort by accelerating decision making and investment decisions.
  • Help them better understand and evaluate the needs, goals and key strategies of key telcos and their partners / competitors


The Future Value of Voice: Report Content Summary

  • Executive Summary. (18 pages outlining the opportunity and key strategic options)
  • Introduction. Disruption and transformation, voice vs. telephony, and scope.
  • The Transition in User Behaviour. Global psychological, social, pricing and segment drivers, and the changing needs of consumer and enterprise markets.
  • What now makes a winning Value Proposition? The fall of telephony, the value of time vs telephony, presence, Online Service Provider (OSP) competition, operators’ responses, free telco offerings, re-imaging customer service, voice developers, the changing telephony business model.
  • Market Trends and other Forecast Drivers. Model and forecast methodology and assumptions, general observations and drivers, ‘Peak Telephony/SMS’, fragmentation, macro-economic issues, competitive and regulatory pressures, handset subsidies.
  • Country-by-Country Analysis. Overview of national markets. Forecast and analysis of: UK, Germany, France, Italy, Spain, Taiwan, Singapore, Canada, US, other markets, summary and conclusions.
  • Technology: Products and Vendors’ Approaches. Unified Comminications. Microsoft Office 365, Skype, Cisco, Google, WebRTC, Rich Communications Service (RCS), Broadsoft, Twilio, Tropo, Voxeo, Hypervoice, Calltrunk, Operator voice and messaging services, summary and conclusions.
  • Telco Case Studies. Vodafone 360, One Net and RED, Telefonica Digital, Tu Me, Tu Go, Bluvia and AT&T.
  • Summary and Conclusions. Consumer, enterprise, technology and Telco OTT.

Innovation Strategies: Telefonica 2.0 Vs. Vodafone 2.0

Summary: Telefonica and Vodafone are both European-based tier 1 CSPs with substantial revenues, cash flows and subscribers. They have both expanded beyond Europe – Vodafone into Africa and Asia and Telefonica into Latin America. However, their Telco 2.0 strategies are rather different. In this extract from our forthcoming report, A Practical Guide to Implementing Telco 2.0, we outline their Telco 2.0 strategies and their benefits and risks. (September 2012, Executive Briefing Service, Transformation Stream.)

Telefonica Strategy 2.0 Chart

  Read in Full (Members only)   To Subscribe click here

Below is an extract from this 14 page Telco 2.0 report that can be downloaded in full in PDF format by members of the Telco 2.0 Executive Briefing service and the Telco 2.0 Transformation Stream here. Non-members can subscribe here

This report is itself an edited section taken from our forthcoming strategy report, A Practical Guide to Implementing Telco 2.0We will be sharing some of the findings, and exploring them in the market context at Digital Arabia, the Telco 2.0 invitation only Executive Brainstorm taking place in Dubai, 6-7 November, in and Digital Asia in Singapore, 3-5 December, 2012. 

To find out more about any of these services, apply for an invitation to the Brainstorms, and for any other enquiries, please email contact@telco2.net / call +44 (0) 207 247 5003.

To share this article easily, please click:

Two Different Telco 2.0 Strategies

‘Full Service Telco 2.0’ Vs. Telco 2.0 ‘Happy Piper’

In our reports the ‘Roadmap to New Telco 2.0 Business Models’ and ‘A Practical Guide to Implementing Telco 2.0’, we identify two archetypal Telco 2.0 strategies: ‘Full Service Telco 2.0’; and ‘Telco 2.0 Happy Piper’.

Figure 1 – Porter and Telco 2.0 competitive strategies

Telefonica Vodafone Telco 2.0 Porter diagram Sept 2012

Source: Michael Porter / STL Partners / Telco 2.0

  • Full-Service Telco 2.0’. In this ‘two-sided’ business model, CSPs have two clear customer groups: end-users and other 3rd Party Organisations who interact with end-users (what we call ‘Upstream’ companies – banks, retailers, advertisers, government, utilities, software developers other telcos). CSPs seek to compete with each other and with others, such as the ‘internet players’, by differentiating both in the end-user services (communications, content, etc.) and with the enabling services they provide to other service providers (identity and authentication, customer targeting/marketing services, payments, customer care, and so forth).
  • The ‘Telco 2.0 Happy Piper’. CSPs that pursue this strategy will focus on retail or wholesale connectivity to upstream and/or downstream customers rather than on higher-level (value-added) services. It is worth noting that although simplicity and cost control are key themes of the ‘Telco 2.0 Happy Piper’, there remains scope for revenue growth through providing ‘enhanced connectivity’ options.

Overview: Telefonica 2.0 and Vodafone 2.0

At a top-level, Telefonica is pursuing a ‘Telco 2.0 Service Provider’ strategy whereas Vodafone, although dabbling in Telco 2.0 services, is largely committed to a defensive approach to digital services (protecting voice and messaging) and is aggressively pursuing a ‘Happy Piper’ strategy. We illustrate a qualitative assessment of where the two CSPs sit on the Happy Piper-Service Provider continuum, together with a selection of other CSPs in Figure 2.

Figure 2: Positioning CSPs on the Happy Piper – Service Provider continuum

Telefonica Vodafone Continuum diagram Sept 2012

Source: STL Partners / Telco 2.0

Telefonica: Telco 2.0 Service Provider

Background: Digital Innovator

STL Partners believes that Telefonica is arguably the most advanced operator globally in moving from traditional telecoms (Telco 1.0) to a Telco 2.0 Service Provider strategy. This belief was reinforced by the reorganisation in Autumn 2011 in which Matthew Key, the European CEO, was appointed head of a new unit, Telefonica Digital, which has the objective to build the company’s presence and value in the digital world. A press release in September 2011 summarised the objectives of the division as being:

  • To take full advantage of the opportunities afforded by the digital world with respect to new products, services and value chains, both in markets where the company operates directly and those in which it has industrial alliances or the potential to operate directly in OTT (over the top) businesses.
  • This unit will be responsible for developing and globally exploiting businesses like, among others, video and entertainment, e-advertising, e-health, financial services, cloud and M2M. It will aim its activity both at the corporate and residential segments. 
  • To actively help the two major geographic regions, Europe and Latin America, take advantage of their distinguishing traits (relationship with and proximity to more than 300 million customers, capillarity, invoicing and distribution capabilities).
  • To attain this goal, the unit will develop top-flight global competencies in the areas of business intelligence, pricing strategies and management of alliances in the digital environment with respect to both hardware (i.e. devices) and software.
  • Generate new growth opportunities by investing in new digital businesses, while grouping together or reinforcing initiatives such as Amerigo, Wayra and Vc’s.

Figure 3: Telefonica’s Telco 2.0 Service Provider strategy

Telefonica 2.0 Strategy chart Sept 2012

Source: Telefonica

Telefonica Digital is a significant development in the company’s commitment to Telco 2.0 services for three reasons:

  1. For the first time a CSP has been transparent about how much revenue it is generating from non-traditional ‘digital’ services. In 2011, Telefonica Digital generated revenue of €2.4 billion and intends to grow this by around 20% a year to reach around €5 billion in 2015.
  2. Telefonica Digital is a relatively autonomous entity with separate headquarters (in London rather than Slough) and separate product and service development capabilities. It can both leverage Telefonica’s commercial distribution capabilities (via the operating companies) and, crucially, distribute services over-the-top via app stores and the internet. Essentially, it has been given the authority to compete with the core business as an in-house ‘OTT player’.
  3. It is specifically focused on the services layer – both end-user services and enabling services for third-party service providers (including advertising and security). It will leverage Telefonica’s network where it makes sense to do so (e.g. for M2M) but will not be tied to the network if it makes sense to build OTT services (e.g. Tu Me, one of its OTT voice services, is available for non-Telefonica customers). It also seeks to buy (e.g. Terra, Tuenti), build (e.g. Priority Moments) and partner (via various models including Wayra, in which Telefonica makes seed capital available to early stage businesses).

Figure 4: Telefonica’s Telco 2.0 service portfolio

Telefonica digital innovation calendar diagram sept 2012

Source: Telefonica

To read the note in full, including the following additional sections detailing support for the analysis…

  • Telefonica’s Telco 2.0 products and services
  • Vodafone’s approach
  • Background: safety first
  • Vodafone’s Telco 2.0 services
  • Vodafone One Net: Unified Communications in the Cloud for SMBs
  • Vodafone Freebees: Retaining the Pre-pay base
  • Summary: Strategic Evaluation

…and the following figures…

  • Figure 1 – Porter and Telco 2.0 competitive strategies
  • Figure 2: Positioning CSPs on the Happy Piper – Service Provider continuum
  • Figure 3: Telefonica’s Telco 2.0 Service Provider strategy
  • Figure 4: Telefonica’s Telco 2.0 service portfolio
  • Figure 5: Vodafone – main messages are about being an efficient data pipe
  • Figure 6: Vodafone One Net – a defensive play in the SMB market
  • Figure 7: Telefonica and Vodafone Telco 2.0 strategies – evaluation

Members of the Telco 2.0 Executive Briefing Subscription Service and the Telco 2.0 Transformation Stream can download the full 14 page report in PDF format hereNon-Members, please subscribe here. For this or other enquiries, please email contact@telco2.net / call +44 (0) 207 247 5003.

Companies and Technologies Featured: Vodafone, Telefonica, O2, Priority Moments, Top-Up Surprises, Freebees, Tu Me, Tuenti, Terra, OneNet, Wayra, M2M, OTT, Jajah, Happy Piper, Full Service, Telco 2.0.

Dealing with the ‘Disruptors’: Google, Apple, Facebook, Microsoft/Skype and Amazon (Updated Extract)

Executive Summary (Extract)

This report analyses the strategies behind the success of Amazon, Apple, Facebook, Google and Skype, before going on to consider the key risks they face and how telcos and their partners should deal with these highly-disruptive Internet giants.

As the global economy increasingly goes digital, these five companies are using the Internet to create global brands with much broader followings than those of the traditional telecoms elite, such as Vodafone, AT&T and Nokia. However, the five have markedly different business models that offer important insights into how to create world-beating companies in the digital economy:

  • Amazon: Amazon’s business-to-business Marketplace and Cloud offerings are text-book examples of how to repurpose assets and infrastructure developed to serve consumers to open up new upstream markets. As the digital economy goes mobile, Amazon’s highly-efficient two-sided commerce platform is enabling it to compete effectively with rivals that control the leading smartphone and tablet platforms – Apple and Google.
  • Apple: Apple has demonstrated that, with enough vision and staying power, an individual company can single-handedly build an entire ecosystem. By combining intuitive and very desirable products, with a highly-standardised platform for software developers, Apple has managed to create an overall customer experience that is significantly better than that offered by more open ecosystems. But Apple’s strategy depends heavily on it continuing to produce the very best devices on the market, which will be difficult to sustain over the long-term.
  • Facebook: A compelling example of how to build a business on network effects. It took Facebook four years of hard work to reach a tipping point of 100 million users, but the social networking service has been growing easily and rapidly ever since. Facebook has the potential to attract 1.4 billion users worldwide, but only if it continues to sidestep rising privacy concerns, consumer fatigue or a sudden shift to a more fashionable service.
  • Google: The search giant’s virtuous circle keeps on spinning to great effect – Google develops scores of free, and often-compelling, Internet services, software platforms and apps, which attract consumers and advertisers, enabling it to create yet more free services. But Google’s acquisition of Motorola Mobility risks destabilising the Android ecosystem on which a big chunk of its future growth depends.
  • Skype: Like Facebook and Google, Skype sought users first and revenues second. By creating a low-cost, yet feature-rich, product, Skype has attracted more than 660 million users and created sufficient strategic value to persuade Microsoft to hand over $8.5bn. Skype’s share of telephony traffic is rising inexorably, but Google and Apple may go to great lengths to prevent a Microsoft asset gaining a dominant position in peer-to-peer communications.

The strategic challenge

There is a clear and growing risk that consumers’ fixation on the products and services provided by the five leading disruptors could leave telcos providing commoditised connectivity and struggling to make a respectable return on their massive investment in network infrastructure and spectrum.

In developed countries, telcos’ longstanding cash-cows – mobile voice calls and SMS – are already being undermined by Internet-based alternatives offered by Skype, Google, Facebook and others. Competition from these services could see telcos lose as much as one third of their messaging and voice revenues within five years (see Figure 1) based on projections from our global survey, carried out in September 2011.

Figure 1 – The potential combined impact of the disruptors on telcos’ core services

Impact of Google, Apple, Facebook, Microsoft/Skype, Amaxon on telco services

Source: Telco 2.0 online survey, September 2011, 301 respondents

Moreover, most individual telcos lack the scale and the software savvy to compete effectively in other key emerging mobile Internet segments, such as local search, location-based services, digital content, apps distribution/retailing and social-networking.

The challenge for telecoms and media companies is to figure out how to deal with the Internet giants in a strategic manner that both protects their core revenues and enables them to expand into new markets. Realistically, that means a complex, and sometimes nuanced, co-opetition strategy, which we characterise as the “Great Game”.

In Figure 3 below, we’ve mapped the players’ roles and objectives against the markets they operate in, giving an indication of the potential market revenue at stake, and telcos’ generic strategies.

Figure 3- The Great Game – Positions, Roles and Strategies

The Great Game - Telcos, Amazon, Apple, Google, Facebook, Skype/Microsoft

Our in-depth analysis, presented in this report, describes the ‘Great Game’ and the strategies that we recommend telcos and others can adopt in summary and in detail. [END OF FIRST EXTRACT]

Report contents

  • Executive Summary [5 pages – including partial extract above]
  • Key Recommendations for telcos and others [20 pages]
  • Introduction [10 pages – including further extract below]


The report then contains c.50 page sections with detailed analysis of objectives, business model, strategy, and options for co-opetition for:

  • Google
  • Apple
  • Facebook
  • Microsoft/Skype
  • Amazon

Followed by:

  • Conclusions and recommendations [10 pages]
  • Index

The report includes 124 charts and tables.

The rest of this page comprises an extract from the report’s introduction, covering the ‘new world order’, investor views, the impact of disruptors on telcos, and how telcos are currently fighting back (including pricing, RCS and WAC), and further details of the report’s contents. 


Introduction

The new world order

The onward march of the Internet into daily life, aided and abetted by the phenomenal demand for smartphones since the launch of the first iPhone in 2007, has created a new world order in the telecoms, media and technology (TMT) industry.

Apple, Google and Facebook are making their way to the top of that order, pushing aside some of the world’s biggest telcos, equipment makers and media companies. This trio, together with Amazon and Skype (soon to be a unit of Microsoft), are fundamentally changing consumers’ behaviour and dismantling longstanding TMT value chains, while opening up new markets and building new ecosystems.

Supported by hundreds of thousands of software developers, Apple, Google and Facebook’s platforms are fuelling innovation in consumer and, increasingly, business services on both the fixed and mobile Internet. Amazon has set the benchmark for online retailing and cloud computing services, while Skype is reinventing telephony, using IP technology to provide compelling new functionality and features, as well as low-cost calls.

On their current trajectory, these five companies are set to suck much of the value out of the telecoms services market, substituting relatively expensive and traditional voice and messaging services with low-cost, feature-rich alternatives and leaving telcos simply providing data connectivity. At the same time, Apple, Amazon, Google and Facebook have become major conduits for software applications, games, music and other digital content, rewriting the rules of engagement for the media industry.

In a Telco2.0 online survey of industry executives conducted in September 2011, respondents said they expect Apple, Google, Facebook and Skype together to have a major impact on telcos’ voice and messaging revenues in the next three to five years . Although these declines will be partially compensated for by rising revenues from mobile data services, the respondents in the survey anticipate that telcos will see a major rise in data carriage costs (see Figure 1 – The potential combined impact of the disruptors on telcos’ core services).

In essence, we consider Amazon, Apple, Facebook, Google and Skype-Microsoft to be the most disruptive players in the TMT ecosystem right now and, to keep this report manageable, we have focused on these five giants. Still, we acknowledge that other companies, such as RIM, Twitter and Baidu, are also shaping consumers’ online behaviour and we will cover these players in more depth in future research.

The Internet is, of course, evolving rapidly and we fully expect new disruptors to emerge, taking advantage of the so-called Social, Local, Mobile (SoLoMo) forces, sweeping through the TMT landscape. At the same time, the big five will surely disrupt each other. Google is increasingly in head-to-head competition with Facebook, as well as Microsoft, in the online advertising market, while squaring up to Apple and Microsoft in the smartphone platform segment. In the digital entertainment space, Amazon and Google are trying to challenge Apple’s supremacy, while also attacking the cloud services market.

Investor trust

Unlike telcos, the disruptors are generally growing quickly and are under little, or no, pressure from shareholders to pay dividends. That means they can accumulate large war chests and reinvest their profits in new staff, R&D, more data centres and acquisitions without any major constraints. Investors’ confidence and trust enables the disruptors to spend money freely, keep innovating and outflank dividend-paying telcos, media companies and telecoms equipment suppliers.

By contrast, investors generally don’t expect telcos to reinvest all their profits in their businesses, as they don’t believe telcos can earn a sufficiently high return on capital. Figure 16 shows the dividend yields of the leading telcos (marked in blue). Of the disruptors, only Microsoft (marked in green) pays a dividend to shareholders.

Figure 16: Investors expect dividends, not growth, from telcos

Figure 1 Chart Google Apple Facebook Microsoft Skype Amazon Sep 2011 Telco 2.0

Source: Google Finance 2/9/2011

The top telcos’ turnover and net income is comparable, or superior, to that of the leading disruptors, but this isn’t reflected in their respective market capitalisations. AT&T’s turnover is approximately four times that of Google and its net income twice as great, yet their market cap is similar. Even accounting for their different capital structures, investors clearly expect Google to grow much faster than AT&T and syphon off more of the value in the TMT sector.

More broadly, the disparity in the market value between the leading disruptors and the leading telcos’ market capitalisations suggest that investors expect Apple, Microsoft and Google’s revenues and profits to keep rising, while they believe telcos’ will be stable or go into decline. Figure 17 shows how the market capitalisation of the disruptors (marked in green) compares with that of the most valuable telcos (marked in blue) at the beginning of September 2011.

Figure 17: Investors value the disruptors highly

Figure 2 Chart Google Apple Facebook Microsoft Skype Amazon Market Capitalisation Sep 2011 Telco 2.0

Source: Google Finance 2/9/2011 (Facebook valued at Facebook $66bn based on IPG sale in August 2011)

Impact of disruptors on telcos

It has taken longer than many commentators expected, but Internet-based messaging and social networking services are finally eroding telcos’ SMS revenues in developed markets. KPN, for example, has admitted that smartphones, equipped with data communications apps (and Whatsapp in particular), are impacting its voice and SMS revenues in its consumer wireless business in its home market of The Netherlands (see Figure 18). Reporting its Q2 2011 results, KPN said that changing consumer behaviour cut its consumer wireless service revenues in Holland by 2% year-on-year.

Figure 18: KPN reveals falling SMS usage

Figure 3 Chart Google Apple Facebook Microsoft Skype Amazon KPN Trends Sep 2011 Telco 2.0

Source: KPN Q2 results

In the second quarter, Vodafone also reported a fall in messaging revenue in Spain and southern Africa, while Orange saw its average revenue per user from data and SMS services fall in Poland.

How telcos are fighting back

Big bundles

Carefully-designed bundles are the most common tactic telcos are using to try and protect their voice and messaging business. Most postpaid monthly contracts now come with hundreds of SMS messages and voice minutes, along with a limited volume of data, bundled into the overall tariff package. This mix encourages consumers to keep using the telcos’ voice and SMS services, which they are paying for anyway, rather than having Skype or another VOIP service soak up their precious data allowance.

To further deter usage of VOIP services, KPN and some other telcos are also creating tiered data tariffs offering different throughput speeds. The lower-priced tariffs tend to have slow uplink speeds, making them unsuitable for VOIP (see Figure 19 below). If consumers want to use VOIP, they will need to purchase a higher-priced data tariff, earning the telco back the lost voice revenue.

Figure 19: How KPN is trying to defend its revenues

Figure 4 Chart Google Apple Facebook Microsoft Skype Amazon KPN Defence Sep 2011 Telco 2.0

Source: KPN’s Q2 results presentation

Of course, such tactics can be undermined by competition – if one mobile operator in a market begins offering generous data-only tariffs, consumers may well gravitate towards that operator, forcing the others to adjust their tariff plans.

Moreover, bundling voice, SMS and data will generally only work for contract customers. Prepaid customers, who only want to pay for what they are use, are naturally charged for each minute of calls they make and each message they send. These customers, therefore, have a stronger financial incentive to find a free WiFi network and use that to send messages via Facebook or make calls via Skype.

The Rich Communications Suite (RCS)

To fend off the threat posed by Skype, Facebook, Google and Apple’s multimedia communications services, telcos are also trying to improve their own voice and messaging offerings. Overseen by mobile operator trade association the GSMA, the Rich Communications Suite is a set of standards and protocols designed to enable mobile phones to exchange presence information, instant messages, live video footage and files across any mobile network.

In an echo of social networks, the GSMA says RCS will enable consumers to create their own personal community and share content in real time using their mobile device.

From a technical perspective, RCS uses the Session Initiation Protocol (SIP) to manage presence information and relay real-time information to the consumer about which service features they can use with a specific contact. The actual RCS services are carried over an IP-Multimedia Subsystem (IMS), which telcos are using to support a shift to all-IP fixed and mobile networks.

Deutsche Telekom, Orange, Telecom Italia, Telefonica and Vodafone have publically committed to deploy RCS services, indicating that the concept has momentum in Europe, in particular. The GSMA says that interoperable RCS services will initially be launched by these operators in Spain, Germany, France and Italy in late 2011 and 2012. [NB We’ll be discussing RCSe with some of the operators at our EMEA event in London in November 2011.]

In theory, at least, RCS will have some advantages over many of the communications services offered by the disruptors. Firstly, it will be interoperable across networks, so you’ll be able to reach people using different service providers. Secondly, the GSMA says RCS service features will be automatically available on mobile devices from late 2011 without the need to download and install software or create an account (by contrast, Apple’s iMessage service, for example, will only be installed on Apple devices).

But questions remain over whether RCS devices will arrive in commercial quantities fast enough, whether RCS services will be priced in an attractive way and will be packaged and marketed effectively. Moreover, it isn’t yet clear whether IMS will be able to handle the huge signalling load that would arise from widespread usage of RCS.

Internet messaging protocols, such as XMPP, require the data channel to remain active continuously. Tearing down and reconnecting generates lots of signalling traffic, but the alternative – maintaining a packet data session – will quickly drain the device’s battery.
By 2012, Facebook and Skype may be even more entrenched than they are today and their fans may see no need to use telcos’ RCS services.

Competing head-on

Some of the largest mobile operators have tried, and mostly failed, to take on the disruptors at their own game. Vodafone 360, for example, was Vodafone’s much-promoted, but ultimately, unsuccessful €500 million attempt to insert itself between its customers and social networking and messaging services from the likes of Facebook, Windows Live, Google and Twitter.

As well as aggregating contacts and feeds from several social networks, Vodafone 360 also served as a gateway to the telco’s app and music store. But most Vodafone customers didn’t appear to see the need to have an aggregator sit between them and their Facebook feed. During 2011, the service was stripped back to be just the app and music store. In essence, Vodafone 360 didn’t add enough value to what the disruptors are already offering. We understand, from discussions with executives at Vodafone, that the service is now being mothballed.

A small number of large telcos, mostly in emerging markets where smartphones are not yet commonplace, have successfully built up a portfolio of value-added consumer services that go far beyond voice and messaging. One of the best examples is China Mobile, which claims more than 82 million users for its Fetion instant messaging service, for example (see Figure 20 – China Mobile’s Internet Services).

Figure 20 – China Mobile’s Internet Services

China Mobile Services, Google, Apple, Facebook Report, Telco 2.0

Source: China Mobile’s Q2 2011 results

However, it remains to be seen whether China Mobile will be able to continue to attract so many customers for its (mostly paid-for) Internet services once smartphones with full web access go mass-market in China, making it easier for consumers to access third-parties’ services, such as the popular QQ social network.

Some telcos have tried to compete with the disruptors by buying innovative start-ups. A good example is Telefonica’s acquisition of VOIP provider Jajah for US$207 million in January 2010. Telefonica has since used Jajah’s systems and expertise to launch low-cost international calling services in competition with Skype and companies offering calling cards. Telefonica expects Jajah’s products to generate $280 million of revenue in 2011, primarily from low-cost international calls offered by its German and UK mobile businesses, according to a report in the FT.

The Wholesale Applications Community (WAC)

Concerned about their growing dependence on the leading smartphone platforms, such as Android and Apple’s iOS, many of the world’s leading telcos have banded together to form the Wholesale Applications Community (WAC).

WAC’s goal is to create a platform developers can use to create apps that will run across different device operating systems, while tapping the capabilities of telcos’ networks and messaging and billing systems.

At the Mobile World Congress in February 2011, WAC said that China Mobile, MTS, Orange, Smart, Telefónica, Telenor, Verizon and Vodafone are “connected to the WAC platform”, while adding that Samsung and LG will ensure “that all devices produced by the two companies that are capable of supporting the WAC runtime will do so.”

It also announced the availability of the WAC 2.0 specification, which supports HTML5 web applications, while WAC 3.0, which is designed to enable developers to tap network assets, such as in-app billing and user authentication, is scheduled to be available in September 2011.

Ericsson, the leading supplier of mobile networks, is a particularly active supporter of WAC, which also counts leading Alcatel-Lucent, Huawei, LG Electronics, Qualcomm, Research in Motion, Samsung and ZTE, among its members.

In theory, at least, apps developers should also throw their weight behind WAC, which promises the so far unrealised dream of “write once, run anywhere.” But, in reality, games developers, in particular, will probably still want to build specific apps for specific platforms, to give their software a performance and functionality edge over rivals.

Still, the ultimate success or failure of WAC will likely depend on how enthusiastically Apple and Google, in particular, embrace HTML5 and actively support it in their respective smartphone platforms. We discuss this question further in the Apple and Google chapters of this report.

Summarising current telcos’ response to disruptors


Telcos, and their close allies in the equipment market, are clearly alert to the threat posed by the major disruptors, but they have yet to develop a comprehensive game plan that will enable them to protect their voice and messaging revenue, while expanding into new markets.

Collective activities, such as RCS and WAC, are certainly necessary and worthwhile, but are not enough. Telcos, and companies across the broader TMT ecosystem, need to also adapt their individual strategies to the rise of Amazon, Apple, Facebook, Google and Skype-Microsoft. This report is designed to help them do that.

[END OF EXTRACT]


‘Under-The-Floor’ (UTF) Players: threat or opportunity?

Introduction

The ‘smart pipe’ imperative

In some quarters of the telecoms industry, the received wisdom is that the network itself is merely an undifferentiated “pipe”, providing commodity connectivity, especially for data services. The value, many assert, is in providing higher-tier services, content and applications, either to end-users, or as value-added B2B services to other parties. The Telco 2.0 view is subtly different. We maintain that:

  1. Increasingly valuable services will be provided by third-parties but that operators can provide a few end-user services themselves. They will, for example, continue to offer voice and messaging services for the foreseeable future.
  2. Operators still have an opportunity to offer enabling services to ‘upstream’ service providers such as personalisation and targeting (of marketing and services) via use of their customer data, payments, identity and authentication and customer care.
  3. Even if operators fail (or choose not to pursue) options 1 and 2 above, the network must be ‘smart’ and all operators will pursue at least a ‘smart network’ or ‘Happy Pipe’ strategy. This will enable operators to achieve three things.
  • To ensure that data is transported efficiently so that capital and operating costs are minimised and the Internet and other networks remain cheap methods of distribution.
  • To improve user experience by matching the performance of the network to the nature of the application or service being used – or indeed vice versa, adapting the application to the actual constraints of the network. ‘Best efforts’ is fine for asynchronous communication, such as email or text, but unacceptable for traditional voice telephony. A video call or streamed movie could exploit guaranteed bandwidth if possible / available, or else they could self-optimise to conditions of network congestion or poor coverage, if well-understood. Other services have different criteria – for example, real-time gaming demands ultra-low latency, while corporate applications may demand the most secure and reliable path through the network.
  • To charge appropriately for access to and/or use of the network. It is becoming increasingly clear that the Telco 1.0 business model – that of charging the end-user per minute or per Megabyte – is under pressure as new business models for the distribution of content and transportation of data are being developed. Operators will need to be capable of charging different players – end-users, service providers, third-parties (such as advertisers) – on a real-time basis for provision of broadband and maybe various types or tiers of quality of service (QoS). They may also need to offer SLAs (service level agreements), monitor and report actual “as-experienced” quality metrics or expose information about network congestion and availability.

Under the floor players threaten control (and smartness)

Either through deliberate actions such as outsourcing, or through external agency (Government, greenfield competition etc), we see the network-part of the telco universe suffering from a creeping loss of control and ownership. There is a steady move towards outsourced networks, as they are shared, or built around the concept of open-access and wholesale. While this would be fine if the telcos themselves remained in control of this trend (we see significant opportunities in wholesale and infrastructure services), in many cases the opposite is occurring. Telcos are losing control, and in our view losing influence over their core asset – the network. They are worrying so much about competing with so-called OTT providers that they are missing the threat from below.

At the point at which many operators, at least in Europe and North America, are seeing the services opportunity ebb away, and ever-greater dependency on new models of data connectivity provision, they are potentially cutting off (or being cut off from) one of their real differentiators.
Given the uncertainties around both fixed and mobile broadband business models, it is sensible for operators to retain as many business model options as possible. Operators are battling with significant commercial and technical questions such as:

  • Can upstream monetisation really work?
  • Will regulators permit priority services under Net Neutrality regulations?
  • What forms of network policy and traffic management are practical, realistic and responsive?

Answers to these and other questions remain opaque. However, it is clear that many of the potential future business models will require networks to be physically or logically re-engineered, as well as flexible back-office functions, like billing and OSS, to be closely integrated with the network.
Outsourcing networks to third-party vendors, particularly when such a network is shared with other operators is dangerous in these circumstances. Partners that today agree on the principles for network-sharing may have very different strategic views and goals in two years’ time, especially given the unknown use-cases for new technologies like LTE.

This report considers all these issues and gives guidance to operators who may not have considered all the various ways in which network control is being eroded, from Government-run networks through to outsourcing services from the larger equipment providers.

Figure 1 – Competition in the services layer means defending network capabilities is increasingly important for operators Under The Floor Players Fig 1 Defending Network Capabilities

Source: STL Partners

Industry structure is being reshaped

Over the last year, Telco 2.0 has updated its overall map of the telecom industry, to reflect ongoing dynamics seen in both fixed and mobile arenas. In our strategic research reports on Broadband Business Models, and the Roadmap for Telco 2.0 Operators, we have explored the emergence of various new “buckets” of opportunity, such as verticalised service offerings, two-sided opportunities and enhanced variants of traditional retail propositions.
In parallel to this, we’ve also looked again at some changes in the traditional wholesale and infrastructure layers of the telecoms industry. Historically, this has largely comprised basic capacity resale and some “behind the scenes” use of carriers-carrier services (roaming hubs, satellite / sub-oceanic transit etc).

Figure 2 – Telco 1.0 Wholesale & Infrastructure structure

Under The Floor (UTF) Players Fig 2 Telco 1.0 Scenario

Source: STL Partners

Content

  • Revising & extending the industry map
  • ‘Network Infrastructure Services’ or UTF?
  • UTF market drivers
  • Implications of the growing trend in ‘under-the-floor’ network service providers
  • Networks must be smart and controlling them is smart too
  • No such thing as a dumb network
  • Controlling the network will remain a key competitive advantage
  • UTF enablers: LTE, WiFi & carrier ethernet
  • UTF players could reduce network flexibility and control for operators
  • The dangers of ceding control to third-parties
  • No single answer for all operators but ‘outsourcer beware’
  • Network outsourcing & the changing face of major vendors
  • Why become an under-the-floor player?
  • Categorising under-the-floor services
  • Pure under-the-floor: the outsourced network
  • Under-the-floor ‘lite’: bilateral or multilateral network-sharing
  • Selective under-the-floor: Commercial open-access/wholesale networks
  • Mandated under-the-floor: Government networks
  • Summary categorisation of under-the-floor services
  • Next steps for operators
  • Build scale and a more sophisticated partnership approach
  • Final thoughts
  • Index


  • Figure 1 – Competition in the services layer means defending network capabilities is increasingly important for operators
  • Figure 2 – Telco 1.0 Wholesale & Infrastructure structure
  • Figure 3 – The battle over infrastructure services is intensifying
  • Figure 4 – Examples of network-sharing arrangements
  • Figure 5 – Examples of Government-run/influenced networks
  • Figure 6 – Four under-the-floor service categories
  • Figure 7: The need for operator collaboration & co-opetition strategies

Customer Experience 2.0: Learning from Amazon? (STL Presentation)

Customer Experience 2.0: Learning from Amazon?, Presentation by Phil Laidler, Director, Consulting, STL Partners. Can we learn from Amazon, or are we facing the fall of the Telco Empire at the hands of the OTT Invaders? Presented at EMEA Brainstorm, November 2011. Fall of the Telco Empire?

Download presentation here.

Links here for more on New Digital Economics brainstorms and Strategy 2.0 research, or call +44 (0) 207 247 5003.

Example slide from the presentation:

Broadband 2.0: Mobile CDNs and video distribution

Summary: Content Delivery Networks (CDNs) are becoming familiar in the fixed broadband world as a means to improve the experience and reduce the costs of delivering bulky data like online video to end-users. Is there now a compelling need for their mobile equivalents, and if so, should operators partner with existing players or build / buy their own? (August 2011, Executive Briefing Service, Future of the Networks Stream).
Telco 2.0 Mobile CDN Schematic Small
  Read in Full (Members only)    Buy This Report    To Subscribe

Below is an extract from this 25 page Telco 2.0 Report that can be downloaded in full in PDF format by members of the Telco 2.0 Executive Briefing service and Future Networks Stream here. Non-members can buy a Single User license for this report online here for £595 (+VAT) or subscribe here. For multiple user licenses, or to find out about interactive strategy workshops on this topic, please email contact@telco2.net or call +44 (0) 207 247 5003.

To share this article easily, please click:

//

Introduction

As is widely documented, mobile networks are witnessing huge growth in the volumes of 3G/4G data traffic, primarily from laptops, smartphones and tablets. While Telco 2.0 is wary of some of the headline shock-statistics about forecast “exponential” growth, or “data tsunamis” driven by ravenous consumption of video applications, there is certainly a fast-growing appetite for use of mobile broadband.

That said, many of the actual problems of congestion today can be pinpointed either to a handful of busy cells at peak hour – or, often, the inability of the network to deal with the signalling load from chatty applications or “aggressive” devices, rather than the “tonnage” of traffic. Another large trend in mobile data is the use of transient, individual-centric flows from specific apps or communications tools such as social networking and messaging.

But “tonnage” is not completely irrelevant. Despite the diversity, there is still an inexorable rise in the use of mobile devices for “big chunks” of data, especially the special class of software commonly known as “content” – typically popular/curated standalone video clips or programmes, or streamed music. Images (especially those in web pages) and application files such as software updates fit into a similar group – sizeable lumps of data downloaded by many individuals across the operator’s network.

This one-to-many nature of most types of bulk content highlights inefficiencies in the way mobile networks operate. The same data chunks are downloaded time and again by users, typically going all the way from the public Internet, through the operator’s core network, eventually to the end user. Everyone loses in this scenario – the content publisher needs huge servers to dish up each download individually. The operator has to deal with transport and backhaul load from repeatedly sending the same content across its network (and IP transit from shipping it in from outside, especially over international links). Finally, the user has to deal with all the unpredictability and performance compromises involved in accessing the traffic across multiple intervening points – and ends up paying extra to support the operator’s heavier cost base.

In the fixed broadband world, many content companies have availed themselves of a group of specialist intermediaries called CDNs (content delivery networks). These firms on-board large volumes of the most important content served across the Internet, before dropping it “locally” as near to the end user as possible – if possible, served up from cached (pre-saved) copies. Often, the CDN operating companies have struck deals with the end-user facing ISPs, which have often been keen to host their servers in-house, as they have been able to reduce their IP interconnection costs and deliver better user experience to their customers.

In the mobile industry, the use of CDNs is much less mature. Until relatively recently, the overall volumes of data didn’t really move the needle from the point of view of content firms, while operators’ radio-centric cost bases were also relatively immune from those issues as well. Optimising the “middle mile” for mobile data transport efficiency seemed far less of a concern than getting networks built out and handsets and apps perfected, or setting up policy and charging systems to parcel up broadband into tiered plans. Arguably, better-flowing data paths and video streams would only load the radio more heavily, just at a time when operators were having to compress video to limit congestion.

This is now changing significantly. With the rise in smartphone usage – and the expectations around tablets – Internet-based CDNs are pushing much more heavily to have their servers placed inside mobile networks. This is leading to a certain amount of introspection among the operators – do they really want to have Internet companies’ infrastructure inside their own networks, or could this be seen more as a Trojan Horse of some sort, simply accelerating the shift of content sales and delivery towards OTT-style models? Might it not be easier for operators to build internal CDN-type functions instead?

Some of the earlier approaches to video traffic management – especially so-called “optimisation” without the content companies’ permission of involvement – are becoming trickier with new video formats and more scrutiny from a Net Neutrality standpoint. But CDNs by definition involve the publishers, so potentially any necessary compression or other processing can be collaboratively, rather than “transparently” without cooperation or willingness.

At the same time, many of the operators’ usual vendors are seeing this transition point as a chance to differentiate their new IP core network offerings, typically combining CDN capability into their routing/switching platforms, often alongside the optimisation functions as well. In common with other recent innovations from network equipment suppliers, there is a dangled promise of Telco 2.0-style revenues that could be derived from “upstream” players. In this case, there is a bit more easily-proved potential, since this would involve direct substitution of the existing revenues already derived from content companies, by the Internet CDN players such as Akamai and Limelight. This also holds the possibility of setting up a two-sided, content-charging business model that fits OK with rules on Net Neutrality – there are few complaints about existing CDNs except from ultra-purist Neutralists.

On the other hand, telco-owned CDNs have existed in the fixed broadband world for some time, with largely indifferent levels of success and adoption. There needs to be a very good reason for content companies to choose to deal with multiple national telcos, rather than simply take the easy route and choose a single global CDN provider.

So, the big question for telcos around CDNs at the moment is “should I build my own, or should I just permit Akamai and others to continue deploying servers into my network?” Linked to that question is what type of CDN operation an operator might choose to run in-house.

There are four main reasons why a mobile operator might want to build its own CDN:

  • To lower costs of network operation or upgrade, especially in radio network and backhaul, but also through the core and in IP transit.
  • To improve the user experience of video, web or applications, either in terms of data throughput or latency.
  • To derive incremental revenue from content or application providers.
  • For wider strategic or philosophical reasons about “keeping control over the content/apps value chain”

This Analyst Note explores these issues in more details, first giving some relevant contextual information on how CDNs work, especially in mobile.

What is a CDN?

The traditional model for Internet-based content access is straightforward – the user’s browser requests a piece of data (image, video, file or whatever) from a server, which then sends it back across the network, via a series of “hops” between different network nodes. The content typically crosses the boundaries between multiple service providers’ domains, before finally arriving at the user’s access provider’s network, flowing down over the fixed or mobile “last mile” to their device. In a mobile network, that also typically involves transiting the operator’s core network first, which has a variety of infrastructure (network elements) to control and charge for it.

A Content Delivery Network (CDN) is a system for serving Internet content from servers which are located “closer” to the end user either physically, or in terms of the network topology (number of hops). This can result in faster response times, higher overall performance, and potentially lower costs to all concerned.

In most cases in the past, CDNs have been run by specialist third-party providers, such as Akamai and Limelight. This document also considers the role of telcos running their own “on-net” CDNs.

CDNs can be thought of as analogous to the distribution of bulky physical goods – it would be inefficient for a manufacturer to ship all products to customers individually from a single huge central warehouse. Instead, it will set up regional logistics centres that can be more responsive – and, if appropriate, tailor the products or packaging to the needs of specific local markets.

As an example, there might be a million requests for a particular video stream from the BBC. Without using a CDN, the BBC would have to provide sufficient server capacity and bandwidth to handle them all. The company’s immediate downstream ISPs would have to carry this traffic to the Internet backbone, the backbone itself has to carry it, and finally the requesters’ ISPs’ access networks have to deliver it to the end-points. From a media-industry viewpoint, the source network (in this case the BBC) is generally called the “content network” or “hosting network”; the destination is termed an “eyeball network”.

In a CDN scenario, all the data for the video stream has to be transferred across the Internet just once for each participating network, when it is deployed to the downstream CDN servers and stored. After this point, it is only carried over the user-facing eyeball networks, not any others via the public Internet. This also means that the CDN servers may be located strategically within the eyeball networks, in order to use its resources more efficiently. For example, the eyeball network could place the CDN server on the downstream side of its most expensive link, so as to avoid carrying the video over it multiple times. In a mobile context, CDN servers could be used to avoid pushing large volumes of data through expensive core-network nodes repeatedly.

When the video or other content is loaded into the CDN, other optimisations such as compression or transcoding into other formats can be applied if desired. There may also be various treatments relating to new forms of delivery such as HTTP streaming, where the video is broken up into “chunks” with several different sizes/resolutions. Collectively, these upfront processes are called “ingestion”.

Figure 1 – Content delivery with and without a CDN

Mobile CDN Schematic, Fig 1 Telco 2.0 Report

Source: STL Partners / Telco 2.0

Value-added CDN services

It is important to recognise that the fixed-centric CDN business has increased massively in richness and competition over time. Although some of the players have very clever architectures and IPR in the forms of their algorithms and software techniques, the flexibility of modern IP networks has tended to erode away some of the early advantages and margins. Shipping large volumes of content is now starting to become secondary to the provision of associated value-added functions and capabilities around that data. Additional services include:

  • Analytics and reporting
  • Advert insertion
  • Content ingestion and management
  • Application acceleration
  • Website security management
  • Software delivery
  • Consulting and professional services

It is no coincidence that the market leader, Akamai, now refers to itself as “provider of cloud optimisation services” in its financial statements, rather than a CDN, with its business being driven by “trends in cloud computing, Internet security, mobile connectivity, and the proliferation of online video”. In particular, it has started refocusing away from dealing with “video tonnage”, and towards application acceleration – for example, speeding up the load times of e-commerce sites, which has a measurable impact on abandonment of purchasing visits. Akamai’s total revenues in 2010 were around $1bn, less than half of which came from “media and entertainment” – the traditional “content industries”. Its H1 2011 revenues were relatively disappointing, with growth coming from non-traditional markets such as enterprise and high-tech (eg software update delivery) rather than media.

This is a critically important consideration for operators that are looking to CDNs to provide them with sizeable uplifts in revenue from upstream customers. Telcos – especially in mobile – will need to invest in various additional capabilities as well as the “headline” video traffic management aspects of the system. They will need to optimise for network latency as well as throughput, for example – which will probably not have the cost-saving impacts expected from managing “data tonnage” more effectively.

Although in theory telcos’ other assets should help – for example mapping download analytics to more generalised customer data – this is likely to involve extra complexity with the IT side of the business. There will also be additional efforts around sales and marketing that go significantly beyond most mobile operators’ normal footprint into B2B business areas. There is also a risk that an analysis of bottlenecks for application delivery / acceleration ends up simply pointing the finger of blame at the network’s inadequacies in terms of coverage. Improving delivery speed, cost or latency is only valuable to an upstream customer if there is a reasonable likelihood of the end-user actually having connectivity in the first place.

Figure 2: Value-added CDN capabilities

Mobile CDN Schematic - Functionality Chart - Telco 2.0 Report

Source: Alcatel-Lucent

Application acceleration

An increasingly important aspect of CDNs is their move beyond content/media distribution into a much wider area of “acceleration” and “cloud enablement”. As well as delivering large pieces of data efficiently (e.g. video), there is arguably more tangible value in delivering small pieces of data fast.

There are various manifestations of this, but a couple of good examples illustrate the general principles:

  • Many web transactions are abandoned because websites (or apps) seem “slow”. Few people would trust an airline’s e-commerce site, or a bank’s online interface, if they’ve had to wait impatiently for images and page elements to load, perhaps repeatedly hitting “refresh” on their browsers. Abandoned transactions can be directly linked to slow or unreliable response times – typically a function of congestion either at the server or various mid-way points in the connection. CDN-style hosting can accelerate the service measurably, leading to increased customer satisfaction and lower levels of abandonment.
  • Enterprise adoption of cloud computing is becoming exceptionally important, with both cost savings and performance enhancements promised by vendors. Sometimes, such platforms will involve hybrid clouds – a mixture of private (Internal) and public (Internet) resources and connectivity. Where corporates are reliant on public Internet connectivity, they may well want to ensure as fast and reliable service as possible, especially in terms of round-trip latency. Many IT applications are designed to be run on ultra-fast company private networks, with a lot of “hand-shaking” between the user’s PC and the server. This process is very latency-dependent, and especially as companies also mobilise their applications the additional overhead time in cellular networks may otherwise cause significant problems.

Hosting applications at CDN-type cloud acceleration providers achieves much the same effect as for video – they can bring the application “closer”, with fewer hops between the origin server and the consumer. Additionally, the CDN is well-placed to offer additional value-adds such as firewalling and protection against denial-of-service attacks.

To read the 25 note in full, including the following additional content…

  • How do CDNs fit with mobile networks?
  • Internet CDNs vs. operator CDNs
  • Why use an operator CDN?
  • Should delivery mean delivery?
  • Lessons from fixed operator CDNs
  • Mobile video: CDNs, offload & optimisation
  • CDNs, optimisation, proxies and DPI
  • The role of OVPs
  • Implementation and planning issues
  • Conclusion & recommendations

… and the following additional charts…

  • Figure 3 – Potential locations for CDN caches and nodes
  • Figure 4 – Distributed on-net CDNs can offer significant data transport savings
  • Figure 5 – The role of OVPs for different types of CDN player
  • Figure 6 – Summary of Risk / Benefits of Centralised vs. Distributed and ‘Off Net’ vs. ‘On-Net’ CDN Strategies

……Members of the Telco 2.0 Executive Briefing Subscription Service and Future Networks Stream can download the full 25 page report in PDF format here. Non-Members, please see here for how to subscribe, here to buy a single user license for £595 (+VAT), or for multi-user licenses and any other enquiries please email contact@telco2.net or call +44 (0) 207 247 5003.

Organisations and products referenced: 3GPP, Acision, Akamai, Alcatel-Lucent, Allot, Amazon Cloudfront, Apple’s Time Capsule, BBC, BrightCove, BT, Bytemobile, Cisco, Ericsson, Flash Networks, Huawei, iCloud, ISPs, iTunes, Juniper, Limelight, Netflix, Nokia Siemens Networks, Ooyala, OpenWave, Ortiva, Skype, smartphone, Stoke, tablets, TiVo, Vantrix, Velocix, Wholesale Content Connect, Yospace, YouTube.

Technologies and industry terms referenced: acceleration, advertising, APIs, backhaul, caching, CDN, cloud, distributed caches, DNS, Evolved Packet Core, eyeball network, femtocell, fixed broadband, GGSNs, HLS, HTTP streaming, ingestion, IP network, IPR, laptops, LIPA, LTE, macro-CDN, micro-CDN, middle mile, mobile, Net Neutrality, offload, optimisation, OTT, OVP, peering proxy, QoE, QoS, RNCs, SIPTO, video, video traffic management, WiFi, wireless.