MobiNEX: The Mobile Network Experience Index, H1 2016

Executive Summary

In response to customers’ growing usage of mobile data and applications, in April 2016 STL Partners developed MobiNEX: The Mobile Network Experience Index, which ranks mobile network operators by key measures relating to customer experience. To do this, we benchmark mobile operators’ network speed and reliability, allowing individual operators to see how they are performing in relation to the competition in an objective and quantitative manner.

Operators are assigned an individual MobiNEX score out of 100 based on their performance across four measures that STL Partners believes to be core drivers of customer app experience: download speed, average latency, error rate and latency consistency (the proportion of app requests that take longer than 500ms to fulfil).

Our partner Apteligent has provided us with the raw data for three out of the four measures, based on billions of requests made from tens of thousands of applications used by hundreds of millions of users in H1 2016. While our April report focused on the top three or four operators in just seven Western markets, this report covers 80 operators drawn from 25 markets spread across the globe in the first six months of this year.

The top ten operators were from Japan, France, the UK and Canada:

  • Softbank JP scores highest on the MobiNEX for H1 2016, with high scores across all measures and a total score of 85 out of 100.
  • Close behind are Bouygues FR (80) and Free FR (79), which came first and second respectively in the Q4 2015 rankings. Both achieve high scores for error rate, latency consistency and average latency, but are slightly let down by download speed.
  • The top six is completed by NTT DoCoMo JP (78), Orange FR (75) and au (KDDI) JP (71).
  • Slightly behind are Vodafone UK (65), EE UK (64), SFR FR (63), O2 UK (62) and Rogers CA (62). Except in the case of Rogers, who score similarly on all measures, these operators are let down by substantially worse download speeds.

The bottom ten operators all score a total of 16 or lower out of 100, suggesting a materially worse customer app experience.

  • Trailing the pack with scores of 1 or 2 across all four measures were Etisalat EG (4), Vodafone EG (4), Smart PH (5) and Globe PH (5).
  • Beeline RU (11) and Malaysian operators U Mobile MY (9) and Digi MY (9) also fare poorly, but benefit from slightly higher latency consistency scores. Slightly better overall, but still achieving minimum scores of 1 for download speed and average latency, are Maxis MY (14) and MTN ZA (12).

Overall, the extreme difference between the top and bottom of the table highlights a vast inequality in network quality customer experience across the planet. Customer app experience depends to a large degree on where one lives. However, our analysis shows that while economic prosperity does in general lead to a more advanced mobile experience as you might expect, it does not guarantee it. Norway, Sweden, Singapore and the US market are examples of high income countries with lower MobiNEX scores than might be expected against the global picture. STL Partners will do further analysis to uncover more on the drivers of differentiation between markets and players within them.


MobiNEX H1 2016 – included markets

MobiNEX H1 2016 – operator scores

 Source: Apteligent, OpenSignal, STL Partners analysis


  • About MobiNEX
  • Changes for H1 2016
  • MobiNEX H1 2016: results
  • The winners: top ten operators
  • The losers: bottom ten operators
  • The surprises: operators where you wouldn’t expect them
  • MobiNEX by market
  • MobiNEX H1 2016: segmentation
  • MobiNEX H1 2016: Raw data
  • Error rate
  • Latency consistency
  • Download speed
  • Average latency
  • Appendix 1: Methodology and source data
  • Latency, latency consistency and error rate: Apteligent
  • Download speed: OpenSignal
  • Converting raw data into MobiNEX scores
  • Setting the benchmarks
  • Why measure customer experience through app performance?
  • Appendix 2: Country profiles
  • Country profile: Australia
  • Country profile: Brazil
  • Country profile: Canada
  • Country profile: China
  • Country profile: Colombia
  • Country profile: Egypt
  • Country profile: France
  • Country profile: Germany
  • Country profile: Italy
  • Country profile: Japan
  • Country profile: Malaysia
  • Country profile: Mexico
  • Country profile: New Zealand
  • Country profile: Norway
  • Country profile: Philippines
  • Country profile: Russia
  • Country profile: Saudi Arabia
  • Country profile: Singapore
  • Country profile: South Africa
  • Country profile: Spain
  • Country profile: United Arab Emirates
  • Country profile: United Kingdom
  • Country profile: United States
  • Country profile: Vietnam


  • Figure 1: MobiNEX scoring breakdown, benchmarks and raw data used
  • Figure 2: MobiNEX H1 2016 – included markets
  • Figure 3: MobiNEX H1 2016 – operator scores breakdown (top half)
  • Figure 4: MobiNEX H1 2016 – operator scores breakdown (bottom half)
  • Figure 5: MobiNEX H1 2016 – average scores by country
  • Figure 6: MobiNEX segmentation dimensions
  • Figure 7: MobiNEX segmentation – network speed vs reliability
  • Figure 8: MobiNEX segmentation – network speed vs reliability – average by market
  • Figure 9: MobiNEX vs GDP per capita – H1 2016
  • Figure 10: MobiNEX vs smartphone penetration – H1 2016
  • Figure 11: Error rate per 10,000 requests, H1 2016 – average by country
  • Figure 12: Error rate per 10,000 requests, H1 2016 (top half)
  • Figure 13: Error rate per 10,000 requests, H1 2016 (bottom half)
  • Figure 14: Requests with total roundtrip latency > 500ms (%), H1 2016 – average by country
  • Figure 15: Requests with total roundtrip latency > 500ms (%), H1 2016 (top half)
  • Figure 16: Requests with total roundtrip latency > 500ms (%), H1 2016 (bottom half)
  • Figure 17: Average weighted download speed (Mbps), H1 2016 – average by country
  • Figure 18: Average weighted download speed (Mbps), H1 2016 (top half)
  • Figure 19: Average weighted download speed (Mbps), H1 2016 (bottom half)
  • Figure 20: Average total roundtrip latency (ms), H1 2016 – average by country
  • Figure 21: Average total roundtrip latency (ms), H1 2016 (top half)
  • Figure 22: Average total roundtrip latency (ms), H1 2016 (bottom half)
  • Figure 23: Benchmarks and raw data used

MobiNEX: The Mobile Network Experience Index, Q4 2015

Executive Summary

In response to customers’ growing usage of mobile data and applications, STL Partners has developed MobiNEX: The Mobile Network Customer Experience Index, which benchmarks mobile operators’ network speed and reliability by measuring the consumer app experience, and allows individual players to see how they are performing in relation to competition in an objective and quantitative manner.

We assign operators an individual MobiNEX score based on their performance across four measures that are core drivers of customer app experience: download speed; average latency; error rate; latency consistency (the percentage of app requests that take longer than 500ms to fulfil). Apteligent has provided us with the raw data for three out of four of the measures based on billions of requests made from tens of thousands of applications used by hundreds of millions of users in Q4 2015. We plan to expand the index to cover other operators and to track performance over time with twice-yearly updates.

Encouragingly, MobiNEX scores are positively correlated with customer satisfaction in the UK and the US suggesting that a better mobile app experience contributes to customer satisfaction.

The top five performers across twenty-seven operators in seven countries in Europe and North America (Canada, France, Germany, Italy, Spain, UK, US) were all from France and the UK suggesting a high degree of competition in these markets as operators strive to improve relative to peers:

  • Bouygues Telecom in France scores highest on the MobiNEX for Q4 2015 with consistently high scores across all four measures and a total score of 76 out of 100.
  • It is closely followed by two other French operators. Free, the late entrant to the market, which started operations in 2012, scores 73. Orange, the former national incumbent, is slightly let down by the number of app errors experienced by users but achieves a healthy overall score of 70.
  • The top five is completed by two UK operators: EE (65) and O2 (61) with similar scores to the three French operators for everything except download speed which was substantially worse.

The bottom five operators have scores suggesting a materially worse customer app experience and we suggest that management focuses on improvements across all four measures to strengthen their customer relationships and competitive position. This applies particularly to:

  • E-Plus in Germany (now part of Telefónica’s O2 network but identified separately by Apteligent).
  • Wind in Italy, which is particularly let down by latency consistency and download speed.
  • Telefónica’s Movistar, the Spanish market share leader.
  • Sprint in the US with middle-ranking average latency and latency consistency but, like other US operators, poor scores on error rate and download speed.
  • 3 Italy, principally a result of its low latency consistency score.

Surprisingly, given the extensive deployment of 4G networks there, the US operators perform poorly and are providing an underwhelming customer app experience:

  • The best-performing US operator, T-Mobile, scores only 45 – a full 31 points below Bouygues Telecom and 4 points below the median operator.
  • All the US operators perform very poorly on error rate and, although 74% of app requests in the US were made on LTE in Q4 2015, no US player scores highly on download speed.

MobiNEX scores – Q4 2015

 Source: Apteligent, OpenSignal, STL Partners analysis

MobiNEX vs Customer Satisfaction

Source: ACSI, NCSI-UK, STL Partners


  • Introduction
  • Mobile app performance is dependent on more than network speed
  • App performance as a measure of customer experience
  • MobiNEX: The Mobile Network Experience Index
  • Methodology and key terms
  • MobiNEX Q4 2015 Results: Top 5, bottom 5, surprises
  • MobiNEX is correlated with customer satisfaction
  • Segmenting operators by network customer experience
  • Error rate
  • Quantitative analysis
  • Key findings
  • Latency consistency: Requests with latency over 500ms
  • Quantitative analysis
  • Key findings
  • Download speed
  • Quantitative analysis
  • Key findings
  • Average latency
  • Quantitative analysis
  • Key findings
  • Appendix: Source data and methodology
  • STL Partners and Telco 2.0: Change the Game
  • About Apteligent


  • MobiNEX scores – Q4 2015
  • MobiNEX vs Customer Satisfaction
  • Figure 1: MobiNEX – scoring methodology
  • Figure 2: MobiNEX scores – Q4 2015
  • Figure 3: Customer Satisfaction vs MobiNEX, 2015
  • Figure 4: MobiNEX operator segmentation – network speed vs network reliability
  • Figure 5: MobiNEX operator segmentation – with total scores
  • Figure 6: Major Western markets – error rate per 10,000 requests
  • Figure 7: Major Western markets – average error rate per 10,000 requests
  • Figure 8: Major Western operators – percentage of requests with total roundtrip latency greater than 500ms
  • Figure 9: Major Western markets – average percentage of requests with total roundtrip latency greater than 500ms
  • Figure 10: Major Western operators – average weighted download speed across 3G and 4G networks (Mbps)
  • Figure 11: Major European markets – average weighted download speed (Mbps)
  • Figure 12: Major Western markets – percentage of requests made on 3G and LTE
  • Figure 13: Download speed vs Percentage of LTE requests
  • Figure 14: Major Western operators – average total roundtrip latency (ms)
  • Figure 15: Major Western markets – average total roundtrip latency (ms)
  • Figure 16: MobiNEX benchmarks

Fast-Tracking Operator Plans to Win in the $5bn Location Insights Market

If you don’t subscribe to our research yet, you can download the free report as part of our sample report series.

Preface

Subscriber location information is a much-heralded asset of the telecoms operator. Operators have generally understood the importance of this asset but have typically struggled to monetize their position. Some operators have used location information to enable third party services whilst others have attempted to address the opportunity more holistically, with mixed success.

This report updates and expands on a previous STL Partners study: “Making Money from Location Insights” (2013). It outlines how to address the potential opportunity around Location Services. It draws on interviews conducted amongst key stakeholders within the emerging ecosystem, supplemented by STL Partners’ research and analysis, with the objective of determining how operators can release the value from their unique position in the location value chain.

This report focuses on what we have defined as Location Insight Services. The report argues that operators should first seek to offer Location Insight Services before evolving to cover Location Based Services. This strategic approach allows operators to better understand their data and to build location services for enterprise customers rather than starting with consumer-orientated location services that require additional capabilities. This approach provides the most upside with the least associated risk, offering the potential for incremental learning.

This report was commissioned and supported by Viavi Solutions (formerly JDSU). The research, analysis and the writing of the report itself were carried out independently by STL Partners. The views and conclusions contained herein are those of STL Partners.

Location Based Services vs. Location Insight Services

In the 2013 report, STL made a clear distinction between different types of location services.

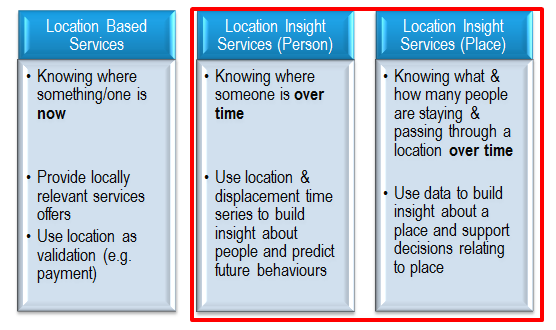
  • Location Based Services (LBS) are geared towards supporting business processes (typically marketing-oriented) that are dependent on the instant availability of real-time or near real-time data about an individually identifiable subscriber. These are provided on the reasonable assumption that knowing an individual’s location enables a company to deliver a service or make an offer that is more relevant, there and then. Typically these services require explicit consent and an interaction with the customer (e.g. push marketing) and therefore require compelling user interfaces and permissions.
  • Additionally there is an opportunity to derive and deliver Location Insight Services (LIS) from connected consumers’ mobile location data. This opportunity does not necessarily require real-time data and where insights are aggregated and anonymized, can safeguard individuals’ privacy. The underlying premise is that identification of repetitive patterns in location activity over time not only enables a much deeper understanding of the consumer in terms of behavior and motivation, but also builds a clearer picture of the visitor profile of the location. Additionally LIS has the potential to provide data that is not available via other routes (e.g. understanding the footfall within a competitor’s store).

Figure 7:  Mapping the Telco Opportunity Landscape

Source: STL Partners

The framework in Figure 7 has been developed by STL Partners specifically with the mobile operator’s perspective in mind. We have split out operator location opportunities along two dimensions:

  • Real-time vs. Non-real-time data acquisition
  • Individual vs. Aggregated data analysis and action

Choosing the Right Strategy

Where are we now?

Most operators understand the potential value of their location asset and have attempted to monetize their data. Some operators have used location to enable 3rd party services whilst others have attempted to address the opportunity more holistically. Both have achieved mixed success for a number of reasons.

Most operators who are attempting to monetize location data have been drawn towards Location Based Services, namely push-marketing and advertising. Whilst some operators have achieved moderate success here (e.g. O2 Priority Moments), most are acting as enablers for other services. They are therefore addressing a limited part of the value chain and subsequently are not realizing significant value from their data. We do not consider those that pursue this strategy to be Location Based Services Providers, rather they are simply enablers.

Similarly a number of operators are addressing Location Insights, albeit with different approaches. Some are partnering with analytics and insight companies (e.g. Telefonica and GfK), others are developing services mostly on their own (e.g. SingTel’s DataSpark), whilst others are simply launching pilots.

In order to maximize the value that operators can secure through Location Services, we believe that operators need to address the whole Location ‘Stack’, not simply enabling new services or providing raw data. STL believe that the best way to do this is to start with Location Insight Services.

Start with Location Insight Services

When considering how to develop and monetize their location assets we recommend that operator’s select to start with LIS. Whilst many operators are already engaged in LBS (e.g. enabling push-marketing) the majority are not actually providing the service but are simply sharing data and enabling a 3rd party service provider.
Starting with LIS has a number of strategic advantages:

  • It’s a big opportunity in its own right
  • Telcos (should) have a data capture/technology advantage for LIS over OTT players
  • LIS provides an opportunity to build & learn incrementally, proving value
  • Privacy risks are reduced (particularly with aggregated data)
  • LIS does not require 100% coverage of the population, unlike a number of LBS use cases
  • LIS can provide internal benefits and can bolster the Go-to-Market strategy for vertical specific offerings

These advantages are explored in more detail further in this report.


  • Location, Location, Location
  • The Importance of Information
  • Location Based Services vs. Location Insight Services
  • Choosing the Right Strategy
  • Where are we now?
  • Start with Location Insight Services
  • Improve your LIS offering, transition towards LBS & position yourself as a Trusted Data Provider
  • Location Insights – Marketplace Overview
  • Where is the Opportunity for Location Insight Services?
  • Which Sectors are most addressable?
  • Sizing the Opportunity
  • Why haven’t forecasts developed as quickly as expected?
  • Location Insights potentially worth $5bn globally by 2020
  • Benchmarks
  • Where does the value come from – the Location Insights ‘Stack’
  • Understanding the Technology Options
  • The Technology Options for Location Data Acquisition
  • Technology Advantages for Telcos
  • The Right Degree of Location Precision
  • Other Advantages of Starting with LIS
  • Incremental Learning
  • Addressing the Privacy Question
  • Market Coverage
  • LIS can provide internal benefits and can bolster the Go-to-Market strategy for vertical specific offerings
  • Expanding Beyond Insights
  • Addressing Location Based Services
  • Becoming a Trusted Data Provider
  • Practical Guidance to Launch Location Services
  • Market Strategy
  • Data Management
  • An agile approach, partnering, orchestration and governance
  • Conclusions
  • Appendices
  • Appendix 1: Location Acquisition Technologies in Detail
  • Appendix 2: Opportunity Sizing Methodology
  • Appendix 3: About STL Partners and Telco 2.0: Change the Game


  • Figure 1: Location Insight vs. Location Based Services
  • Figure 2: STL Partners’ Analysis of the value of Global Location Insight Services (by 2020)
  • Figure 3: Analysis of location data acquisition technologies suitability for Location Insight Services
  • Figure 4: The Strategy Beyond Location Insights
  • Figure 5: The Explosion of Smartphones (2007-2014)
  • Figure 6: ‘Non-Smart’ Data Insights Become More Important as More ‘Things’ are Connected
  • Figure 7: Mapping the Telco Opportunity Landscape
  • Figure 8: Four opportunity domains for operators
  • Figure 9: Turkcell’s Smart Map Tool
  • Figure 10: TomTom’s Fusion Engine to Analyze Real-Time Traffic Information
  • Figure 11: Tado’s Proximity Based Thermostat
  • Figure 12: Expanding Beyond LIS
  • Figure 13: Location Insights – Market Taxonomy
  • Figure 14: Telefónica Smart Steps Location Analytics Tool
  • Figure 15: Motionlogic’s Location Analytics Tool
  • Figure 16: The value of Global Location Insight Services by industry and sector (by 2020)
  • Figure 17: The Location Insights ‘Stack’
  • Figure 18: How well do different location data acquisition technologies support Location Insight Services needs?
  • Figure 19: Real-Time vs. Near Real-Time Location Information
  • Figure 20: Deveryware’s Dynamic Permissions Tool
  • Figure 21: Become a Trusted Data Provider
  • Figure 22: Analysis of App/OS based real-time location Technology
  • Figure 23: Analysis of App/OS based data stored on device Technology
  • Figure 24: Analysis of Emergency Services Location Technology
  • Figure 25: Analysis of Granular (building level) network based Technology
  • Figure 26: Analysis of Coarse (cell-level) network based Technology
  • Figure 27: Analysis of Indoor Technologies

Facebook: Telcos’ New Best Friend?

How Facebook is changing

A history of adaptation

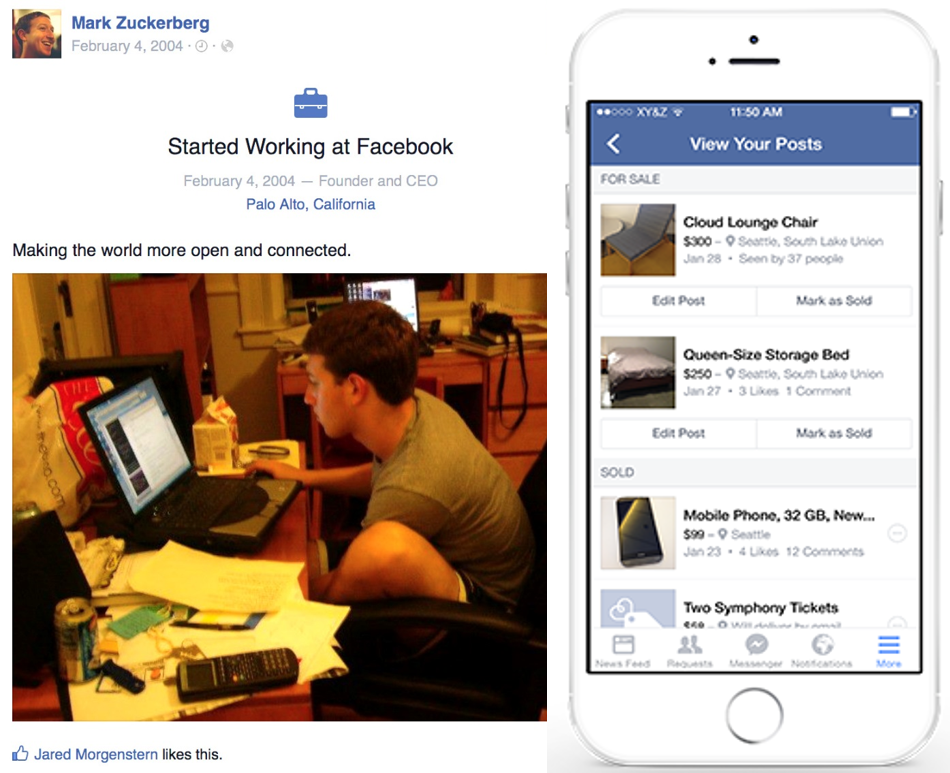
One of the things that sets Facebook apart from its largely defunct predecessors, such as MySpace, Geocities and Friends Reunited, is its ability to adapt to the evolution of the Internet and consumer behaviour. In its decade-long history, Facebook has evolved from a text-heavy, PC-based experience used by American students into a world-leading digital communications and commerce platform used by people of all ages. The basic student matchmaking service Zuckerberg and his fellow Harvard students created in 2004 now matches buyers and sellers in competition with Google, Amazon and eBay (see Figure 1).

Figure 1: From student matchmaking service to a leading digital commerce platform

Source: Zuckerberg’s Facebook page and Facebook investor relations

Launched in early 2004, Facebook initially served as a relatively basic directory with photos and limited communications functionality for Harvard students only. In the spring of 2004, it began to expand to other universities, supported by seed funding from Peter Thiel (co-founder of Paypal). In September 2005, Facebook was opened up to the employees of some technology companies, including Apple and Microsoft. By the end of 2005, it had reached five million users.

Accel Partners invested US$12.7 million in the company in May 2005 and Greylock Partners and others followed this up with another US$27.5 million in March 2006. The additional investment enabled Facebook to expand rapidly. During 2006, it added the hugely popular newsfeed and the share functions and opened up the registration process to anyone. By December 2006, Facebook had 12 million users.

The Facebook Platform was launched in 2007, enabling affiliate sites and developers to interact and create applications for the social network. In a far-sighted move, Microsoft invested US$240 million in October 2007, taking a 1.6% stake and valuing Facebook at US$15 billion. By August 2008, Facebook had 100 million users.

Achieving the 100 million user milestone appears to have given Facebook ‘critical mass’ because at that point growth accelerated dramatically. The company doubled its user base to 200 million in nine months (May 2009) and has continued to grow at a similar rate since then.

As usage continue to grow rapidly, it was increasingly clear that Facebook could erode Google’s dominant position in the Internet advertising market. In June 2011, Google launched the Google + social network – the latest move in a series of efforts by the search giant to weaken Facebook’s dominance of the social networking market. But, like its predecessors, Google+ has had little impact on Facebook.

2012-2013 – the paranoid years

Although Facebook shrugged off the challenge from Google+, the rapid rise of the mobile Internet did cause the social network to wobble in 2012. The service, which had been designed for use on desktop PCs, didn’t work so well on mobile devices, both in terms of providing a compelling user experience and achieving monetisation. Realising Facebook could be disrupted by the rise of the mobile Internet, Zuckerberg belatedly called a mass staff meeting and announced a “mobile first” strategy in early 2012.

In an IPO filing in February 2012, Facebook acknowledged it wasn’t sure it could effectively monetize mobile usage without alienating users. “Growth in use of Facebook through our mobile products, where we do not currently display ads, as a substitute for use on personal computers may negatively affect our revenue and financial results,” it duly noted in the filing.

Although usage of Facebook continued to rise on both the desktop and the mobile, there was increasing speculation that it could be superseded by a more mobile-friendly service, such as fast-growing photo-sharing service Instagram. Zuckerberg’s reaction was to buy Instagram for US$1 billion in April 2012 (a bargain compared with the $21 billion plus Facebook paid for WhatsApp less than two years later).

Moreover, Facebook did figure out how to monetise its mobile usage. Cautiously at first, it began embedding adverts into consumers’ newsfeeds, so that they were difficult to ignore. Although Facebook and some commentators worried that consumers would find these adverts annoying, the newsfeed ads have proven to be highly effective and Facebook continued to grow. In October 2012, now a public company, Facebook triumphantly announced it had one billion active users, with 604 million of them using the mobile site.

Even so, Facebook spent much of 2013 tinkering and experimenting with changes to the user experience. For example, it altered the design of the newsfeed making the images bigger and adding in new features. But some commentators complained that the changes made the site more complicated and confusing, rather than simplifying it for mobile users equipped with a relatively small screen. In April 2013, Facebook tried a different tack, launching Facebook Home, a user interface layer for Android-compatible phones that provides a replacement home screen.

And Zuckerberg continued to worry about upstart mobile-orientated competitors. In November 2013, a number of news outlets reported that Facebook offered to buy Snapchat, which enables users to send messages that disappear after a set period, for US$3 billion. But the offer was turned down.

A few months later, Facebook announced it was acquiring the popular mobile messaging app WhatsApp for what amounted to more than US$21 billion at the time of completion.

In 2014 – going on the offensive

By acquiring WhatsApp at great expense, Facebook alleviated immediate concerns that the social network could be dislodged by another disruptor, freeing up Zuckerberg to turn his attention to new technologies and new markets. The acquisition also put to rest investors’ immediate fears that Facebook could be superseded by a more fashionable, dedicated mobile service, pushing up the share price (see the section on Facebook’s valuation). In May 2014, Facebook wrong-footed many industry watchers and some of its rivals by announcing it had agreed to acquire Oculus VR, Inc., a leading virtual reality company, for US$2 billion in cash and stock.

Zuckerberg has since described the WhatsApp and Oculus acquisitions as “big bets on the next generation of communication and computing platforms.” And Facebook is also investing heavily in organic expansion, increasing its headcount by 45% in 2014, while opening another data center in Altoona, Iowa.

Zuckerberg also continues to devote time and attention to Internet.org, a multi-company initiative to bring free basic Internet services to people who aren’t connected. Announced in August 2013, Internet.org has since launched free basic internet services in six developing countries. For example, in February 2015, Facebook and Reliance Communications launched Internet.org in India. As a result, Reliance customers in six Indian states (Tamil Nadu, Mahararashtra, Andhra Pradesh, Gujarat, Kerala, and Telangana) now have access to about 40 services ranging from news, maternal health, travel, local jobs, sports, communication, and local government information.

Zuckerberg said that more than 150 million people now have the option to connect to the internet using Internet.org, and the initiative had, so far, succeeded in connecting seven million people to the internet who didn’t before have access. “2015 is going to be an important year for our long term plans,” he noted.

The Facebook exception – no fear, more freedom

Although it is now listed, Facebook is clearly not a typical public company. Its massive lead in the social networking market has given it an unusual degree of freedom. Zuckerberg has a controlling stake in the social network (he is able to exercise voting rights with respect to a majority of the voting power of the outstanding capital stock) and the self-confidence to ignore any grumblings on Wall Street. Facebook is able to make acquisitions most other companies couldn’t contemplate and can continue to put Zuckerberg’s long-term objectives ahead of those of short-term shareholders. Like Amazon, Facebook frequently reminds investors that it isn’t trying to maximise short-term profitability. And unlike Amazon, Facebook may not even be trying to maximize long-term profitability.

On Facebook’s quarterly earning calls, Zuckerberg likes to talk about Facebook’s broad, long-term aims, without explaining clearly how fulfilling these objectives will make the company money. “In the next decade, Facebook is focused on our mission to connect the entire world, welcoming billions of people to our community and connecting many more people to the internet through Internet.org (see Figure 2),” he said in the January 2015 earnings call. “Similar to our transition to mobile over the last couple of years, now we want to really focus on serving everyone in the world.”

Figure 2: Zuckerberg is pushing hard for the provision of basic Internet services


Source: Facebook.com

Not all of the company’s investors are entirely comfortable with this mission. On that earnings call, one analyst asked Zuckerberg: “Mark, I think during your remarks in every earnings call, you talk to your investors for a considerable amount of time about Facebook’s efforts to connect the world, and specifically about Internet.org which suggest you think this is important to investors. Can you clarify why you think this matters to investors?”

Zuckerberg’s response: “It matters to the kind of investors that we want to have, because we are really a mission-focused company. We wake up every day and make decisions because we want to help connect the world. That’s what we’re doing here.

“Part of the subtext of your question is that, yes, if we were only focused on making money, we might put all of our energy on just increasing ads to people in the US and the other most developed countries. But that’s not the only thing that we care about here.

“I do think that over the long term, that focusing on helping connect everyone will be a good business opportunity for us, as well. We may not be able to tell you exactly how many years that’s going to happen in. But as these countries get more connected, the economies grow, the ad markets grow, and if Facebook and the other services in our community, or the number one, and number two, three, four, five services that people are using, then over time we will be compensated for some of the value that we’ve provided. This is why we’re here. We’re here because our mission is to connect the world. I just think it’s really important that investors know that.”

Takeaways

Facebook may be a public company, but it doesn’t worry much about shareholders’ short-term aspirations. It often behaves like a private company that is focused first and foremost on fulfilling the goals of its founder. It is clear Zuckerberg is playing the long game. But it isn’t clear what yardsticks he is using to measure success. Although Zuckerberg knows Facebook needs to be profitable enough to ensure investors’ continued support, his primary goal may be to bring hundreds of millions more people online and secure his place in posterity. There is a danger that Zuckerberg’s focus on connecting people in Africa and developing Asia means that there won’t be sufficient top management attention on the multi-faceted digital commerce struggle with Google in North America and Western Europe.

Financials and business model

Network effects still strong

Within that wider mission to connect the world, Facebook continues to do a great job of connecting people to Facebook. Fuelled by network effects, Facebook says that 1.39 billion people now use Facebook each month (see Figure 3) and 890 million people use the service daily, an increase of 165 million monthly active users and 133 million daily active users in 2014. In developed markets, many consumers use Facebook as a primary medium for communications, relying on it to send messages, organize events and relay their news. As a result, in parts of Europe and North America, adults without a Facebook account are increasingly considered eccentric.

Figure 3: Facebook’s user base continues to grow rapidly

Source: Facebook and STL Partners analysis

Having said that, some active users are clearly more active and valuable than others. In a regulatory filing, Facebook admits that some active users may, in fact, be bots: “Some of our metrics have also been affected by applications on certain mobile devices that automatically contact our servers for regular updates with no user action involved, and this activity can cause our system to count the user associated with such a device as an active user on the day such contact occurs. The impact of this automatic activity on our metrics varied by geography because mobile usage varies in different regions of the world.”

This automatic polling of Facebook’s servers by mobile devices makes it difficult to judge the true value of the social network’s user base. Anecdotal evidence suggests many people with Facebook profiles are kept active on Facebook primarily by their smartphone apps, rather than because they are actively choosing to use the service. Still, Facebook would argue that these people are seeing the notifications on their mobile devices and are, therefore, at least partially engaged.


  • Executive Summary
  • How Facebook is changing
  • A history of adaptation
  • The Facebook exception – no fear, more freedom
  • Financials and business model
  • Growth prospects for the core business
  • User growth
  • Monetisation – better targeting, higher prices
  • Mobile advertising spend lags behind usage
  • The Facebook Platform – Beyond the Walled Garden
  • Multimedia – taking on YouTube
  • Search – challenging Google’s core business
  • Enabling transactions – moving beyond advertising
  • Virtual reality – a long-term game
  • Takeaways
  • Threats and risks
  • Facebook fatigue
  • Google – Facebook enemy number one
  • Privacy concerns
  • Wearables and the Internet of Things
  • Local commerce – in need of a map
  • Facebook and communication services
  • Conclusions
  • Facebook is spread too thin
  • Partnering with Facebook – why and how
  • Competing with Facebook – why and how


  • Figure 1: From student matchmaking service to a leading digital commerce platform
  • Figure 2: Zuckerberg is pushing hard for the provision of basic Internet services
  • Figure 3: Facebook’s user base continues to grow rapidly
  • Figure 4: Facebook’s revenue growth has accelerated in the past two years
  • Figure 5: Facebook’s ARPU has risen sharply in the past two years
  • Figure 6: After wobbling in 2012, investors’ belief in Facebook has strengthened
  • Figure 7: Despite a rebound, Facebook’s valuation per user is still below its peak
  • Figure 8: Facebook could be serving 2.3 billion people by 2020
  • Figure 9: Share of digital advertising – Facebook is starting to close the gap on Google but remains a long way behind
  • Figure 10: The gap between click through rates for search and social remains substantial
  • Figure 11: Social networks’ revenue per click is rising but remains 40% of search
  • Figure 12: Facebook’s advertising has moved from the right column to centre stage
  • Figure 13: Facebook’s startling mobile advertising growth
  • Figure 14: Zynga’s share price reflects decline of Facebook.com as an app platform
  • Figure 15 – Facebook Connect – an integral part of the Facebook Platform
  • Figure 16: Leading Internet players’ share of social log-ins over time
  • Figure 17: Facebook’s personalised search proposition
  • Figure 18: Facebook’s new buy button – embedded in a newsfeed post
  • Figure 19: The rise and rise of Android – not good for Facebook
  • Figure 21: Facebook and Google are both heavily associated with privacy issues
  • Figure 22: Facebook wants to conquer the Wheel of Digital Commerce
  • Figure 23: Facebook’s cash flow is far behind that of Google and Apple
  • Figure 24: Facebook’s capital expenditure is relatively modest compared with peers
  • Figure 25: Facebook’s capex/revenue ratio has been high but is falling


Winning Strategies: Differentiated Mobile Data Services

Introduction

Verizon’s performance in the US

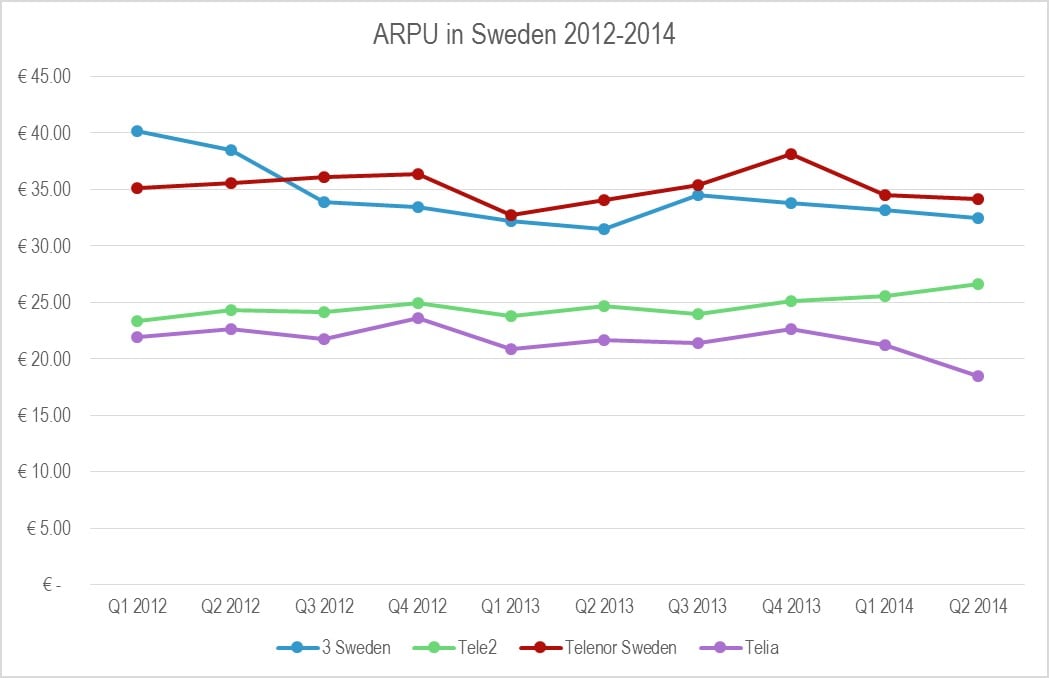
Our work on the US cellular market – for example, in the Disruptive Strategy: “Uncarrier” T-Mobile vs VZW, AT&T, and Free.fr  and Free-T-Mobile: Disruptive Revolution or a Bridge Too Far?  Executive Briefings – has identified that US carrier strategies are diverging. The signature of a price-disruption event we identified with regard to France was that industry-wide ARPU was falling, subscriber growth was unexpectedly strong (amounting to a substantial increase in penetration), and there was a shakeout of minor operators and MVNOs.

Although there are strong signs of a price war – for example, falling ARPU industry-wide, resumed subscriber growth, minor operators exiting, and subscriber-acquisition initiatives such as those at T-Mobile USA, worth as much as $400-600 in handset subsidy and service credit – it seems that Verizon Wireless is succeeding while staying out of the mire, while T-Mobile, Sprint, and minor operators are plunged into it, and AT&T may be going that way too. Figure 1 shows monthly ARPU, converted to Euros for comparison purposes.

Figure 1: Strategic divergence in the US

Figure 1 Strategic Divergence in the US
Source: STL Partners, themobileworld.com

We can also look at this in terms of subscribers and in terms of profitability, bringing in the cost side. The following chart, Figure 2, plots margins against subscriber growth, with the bubbles set proportional to ARPU. The base year 2011 is set to 100 and the axes are set to the average values. We’ve named the four quadrants that result appropriately.

Figure 2: Four carriers, four fates

Figure 2 Four carriers four fate
Source: STL Partners

Clearly, you’d want to be in the top-right, top-performer quadrant, showing subscriber growth and growing profitability. Ideally, you’d also want to be growing ARPU. Verizon Wireless is achieving all three, moving steadily north-west and climbing the ARPU curve.

At the same time, AT&T is gradually being drawn into the price war, getting closer to the lower-right “volume first” quadrant. Deep within that one, we find T-Mobile, which slid from a defensive crouch in the upper-left into the hopeless lower-left zone and then escaped via its price-slashing strategy. (Note that the last lot of T-Mobile USA results were artificially improved by a one-off spectrum swap.) And Sprint is thrashing around, losing profitability and going nowhere fast.

The usual description for VZW’s success is “network differentiation”. They’re just better than the rest, and as a result they’re reaping the benefits. (ABI, for example, reckons that they’re the world’s second most profitable operator on a per-subscriber basis  and the world’s most profitable in absolute terms.) We can restate this in economic terms, saying that they are the most efficient producer of mobile service capacity. This productive capacity can be used either to cut prices and gain share, or to increase quality (for example, data rates, geographic coverage, and voice mean-opinion score) at higher prices. This leads us to an important conclusion: network differentiation is primarily a cost concept, not a price concept.

If there are technical or operational choices that make network differentiation possible, they can be deployed anywhere. It’s also possible, though, that VZW is benefiting from structural factors, perhaps its ex-incumbent status, or its strong position in the market for backbone and backhaul fibre, or perhaps just its scale (although in that case, why is AT&T doing so much worse?). And another possibility often mooted is that the US is somehow a better kind of mobile market. Less competitive (although this doesn’t necessarily show up in metrics like the Herfindahl index of concentration), supposedly less regulated, and undoubtedly more profitable, it’s often held up by European operators as an example. Give us the terms, they argue, and we will catch up to the US in LTE deployment.

As a result, it is often argued in lobbying circles that European markets are “too competitive” or in need of “market repair”, and therefore, the argument runs, the regulator ought to turn a blind eye to more consolidation or at least accept a hollowing out of national operating companies. More formally, the prices (i.e. ARPUs) prevailing do not provide a sufficient margin over operators’ fixed costs to fund discretionary investment. If this was true, we would expect to find little scope for successful differentiation in Europe.

Further, if the “incumbent advantage” story was true of VZW over and above the strategic moves that it has made, we might expect to find that ex-incumbent, converged operators were pulling into the lead across Europe, benefiting from their wealth of access and backhaul assets. In this note, we will try to test these statements, and then assess what the answer might be.

How do European Operators compare?

We selected a clutch of European mobile operators and applied the same screen to identify what might be happening. In doing so we chose to review the UK, German, French, Swedish, and Italian markets jointly with the US, in an effort to avoid a purely European crisis-driven comparison.

Figure 3: Applying the screen to European carriers

Figure 3 Applying the screen to European carriers

Source: STL Partners

Our first observation is that the difference between European and American carriers has been more about subscriber growth than about profitability. The axes are set to the same values as in Figure 2, and the data points are concentrated to their left (showing less subscriber growth in Europe) not below them (less profitability growth).

Our second observation is that yes, there certainly are operators who are delivering differentiated performance in the EU. But they’re not the ones you might expect. Although the big converged incumbents, like T-Mobile Germany, have strong margins, they’re not increasing them and on the whole their performance is average only. Nor is scale a panacea, which brings us to our next observation.

Our third observation is that something is visible at this level that isn’t in the US: major opcos that are shrinking. Vodafone, not a company that is short of scale, gets no fewer than three of its OpCos into the lower-left quadrant. We might say that Vodafone Italy was bound to suffer in the context of the Italian macro-economy, as was TIM, but Vodafone UK is in there, and Vodafone Germany is moving steadily further left and down.

And our fourth observation is the opposite, significant growth. Hutchison OpCo 3UK shows strong performance growth, despite being a fourth operator with no fixed assets and starting with LTE after first-mover EE. Their sibling 3 Sweden is also doing well, while even 3 Italy was climbing up until the last quarter and it remains a valid price warrior. They are joined in the power quadrant with VZW by Telenor’s Swedish OpCo, Telia Mobile, and O2 UK (in the last two cases, only marginally). EE, for its part, has only marginally gained subscribers, but it has strongly increased its margins, and it may yet make it.

But if you want really dramatic success, or if you doubt that Hutchison could do it, what about Free? The answer is that they’re literally off the chart. In Figure 4, we add Free Mobile, but we can only plot the first few quarters. (Interestingly, since then, Free seems to be targeting a mobile EBITDA margin of exactly 9%.)

The distinction here is between the pure-play, T-Mobile-like price warriors in the lower right quadrant, who are sacrificing profitability for growth, and the group we’ve identified, who are improving their margins even as they gain subscribers. This is the signature of significant operational improvement, an operator that can move traffic more efficiently than its competitors. Because the data traffic keeps coming, ever growing at the typical 40% annual clip, it is necessary for any operator to keep improving in order to survive. Therefore, the pace of improvement marks operational excellence, not just improvement.

Figure 4: Free Mobile, a disruptive force that’s literally off the charts

Figure 4 Free Mobile a disruptive force thats literally off the charts

Source: STL Partners

We can also look at this at the level of the major multinational groups. Again, Free’s very success presents a problem to clarity in this analysis – even as part of a virtual group of independents, the ‘Indies’ in Figure 5, it’s difficult to visualise. T-Mobile USA’s savage price cutting, though, gets averaged out and the inclusion of EE boosts the result for Orange and DTAG. It also becomes apparent that the “market repair” story has a problem in that there isn’t a major group committed to hard discounting. But Hutchison, Telenor, and Free’s excellence, and Vodafone’s pain, stand out.

Figure 5: The differences are if anything more pronounced within Europe at the level of the major multinationals

Figure 5 The differences are if anything more pronounced within Europe at the level of the major multinationals

Source: STL Partners

In the rest of this report we analyse why and how these operators (3UK, Telenor Sweden and Free Mobile) are managing to achieve such differentiated performance, identify the common themes in their strategic approaches and the lessons from comparison to their peers, and the important wider consequences for the market.


  • Executive Summary
  • Introduction
  • Applying the Screen to European Mobile
  • Case study 1: Vodafone vs. 3UK
  • 3UK has substantially more spectrum per subscriber than Vodafone
  • 3UK has much more fibre-optic backhaul than Vodafone
  • How 3UK prices its service
  • Case study 2: Sweden – Telenor and its competitors
  • The network sharing issue
  • Telenor Sweden: heavy on the 1800MHz
  • Telenor Sweden was an early adopter of Gigabit Ethernet backhaul
  • How Telenor prices its service
  • Case study 3: Free Mobile
  • Free: a narrow sliver of spectrum, or is it?
  • Free Mobile: backhaul excellence through extreme fixed-mobile integration
  • Free: the ultimate in simple pricing
  • Discussion
  • IP networking metrics: not yet predictive of operator performance
  • Network sharing does not obviate differentiation
  • What is Vodafone’s strategy for fibre in the backhaul?
  • Conclusions


  • Figure 1: Strategic divergence in the US
  • Figure 2: Four carriers, four fates
  • Figure 3: Applying the screen to European carriers
  • Figure 4: Free Mobile, a disruptive force that’s literally off the charts
  • Figure 5: The differences are if anything more pronounced within Europe at the level of the major multinationals
  • Figure 6: Although Vodafone UK and O2 UK share a physical network, O2 is heading for VZW-like territory while VF UK is going nowhere fast
  • Figure 7: Strategic divergence in the UK
  • Figure 8: 3UK, also something of an ARPU star
  • Figure 9: 3UK is very different from Hutchison in Italy or even Sweden
  • Figure 10: 3UK has more spectrum on a per-subscriber basis than Vodafone
  • Figure 11: Vodafone’s backhaul upgrades are essentially microwave; 3UK’s are fibre
  • Figure 12: 3 Europe is more than coping with surging data traffic
  • Figure 13: 3UK service pricing
  • Figure 14: The Swedish market shows a clear winner…
  • Figure 15: Telenor.se is leading on all measures
  • Figure 16: How Swedish network sharing works
  • Figure 17: Network sharing does not equal identical performance in the UK
  • Figure 18: Although extensive network sharing complicates the picture, Telenor Sweden has a strong position, especially in the key 1800MHz band
  • Figure 19: If the customers want more data, why not sell them more data?
  • Figure 20: Free Mobile, network differentiator?
  • Figure 21: Free Mobile, the price leader as always
  • Figure 22: Free Mobile succeeds with remarkably little spectrum, until you look at the allocations that are actually relevant to its network
  • Figure 23: Free’s fixed-line network plans
  • Figure 24: Free leverages its FTTH for outstanding backhaul density
  • Figure 25: Free: value on 3G, bumper bundler on 4G
  • Figure 26: The carrier with the most IPv4 addresses per subscriber is…
  • Figure 27: AS_PATH length – not particularly predictive either
  • Figure 28: The buzzword count. “Fibre” beats “backhaul” as a concern
  • Figure 29: Are Project Spring’s targets slipping?


Telefonica leads Vodafone in more attractive markets

Introduction

As part of the recently launched Telco 2.0 Transformation Index, STL Partners has been analysing the transformation efforts of major telecoms operators.  We are close to completing a major analysis report on Vodafone which will complement those already completed for Telefonica, SingTel, Verizon, AT&T and Ooredoo.  Vodafone’s scores will also be added to an update of the Benchmarking Report which will be released in May.

The full analysis of each player covers 5 domains:

  1. Marketplace.   The context in which the Communications Service Provider (CSP) operates.  It consists of the economic and regulatory environment, the growth of the telecom market, the individual company’s competitive positioning and the relative strength of its relationships with customers.
  2. Service Offering.  What the CSP delivers to customers in a particular market segment. It is defined by the CSP’s corporate and services strategy.
  3. Value Network.  The way the CSP organises itself to deliver service offerings and includes both the internal structure and processes and external partnerships.
  4. Technology.  The technical architecture and functionality that a CSP uses to deliver service offerings.
  5. Finance.  The way the CSP generates a return from its investments and service offerings.  It also measures the CSP’s success in generating returns and metrics used to manage and drive performance.

In this report we explore a small part of the Marketplace analysis for Vodafone and compare its competitive positioning with another European-centric multi-national, Telefonica.

The results, we think, are surprising and instructive.  Vodafone, often held up as the strongest and most global player, actually has relatively weak competitive positions in its leading markets (it does not hold market leader positions) and is exposed to structurally competitive markets (even those that are developing).  Within this context, the company faces substantial challenges if it is to grow in the foreseeable future.

Of course, this is a small extract of a much deeper analysis on Vodafone.  In the full report, we explore Vodafone’s growth and transformation strategy in full and make specific recommendations on 3 different strategic options for management.

Overview: Vodafone operates in more competitive markets and has weaker market positions than Telefonica

STL Partners full report on Vodafone and Telefonica covers four areas of analysis within the Marketplace domain:

1. Economic environment & digital maturity:

  • The overall health of the economies in which Vodafone and Telefonica operate as reflected by GDP size and growth.
  • The digital maturity of Vodafone’s and Telefonica’s markets as reflected by consumer and enterprise adoption and usage of telecommunications and internet services.

2. Regulation:

  • The regulatory framework that Vodafone and Telefonica operate within. Includes legislation and attitudes to pricing, net neutrality, CSP technical and commercial collaboration for new Telco 2.0 solutions, etc.

3. Competition and positioning:

  • The nature of competition – how players compete, their goals, the strategies they deploy, the products they develop
  • How Vodafone and Telefonica are competing in the marketplace and their strengths and weaknesses

4. Customers and customer engagement:

  • What customers want and, more importantly, are trying to achieve (physically, intellectually, socially) and how this is reflected in their (digital) behaviour including how they use products, react to companies and brands, share information about themselves etc.
  • Specifically, the regard with which customers hold Vodafone and Telefonica

For the purposes of this report, we have extracted elements of the full analysis and present them along two dimensions: Market Attractiveness (the underlying growth, maturity and structure of Vodafone and Telefonica’s markets) and Competitive Position (Vodafone and Telefonica’s relative strength within these markets).

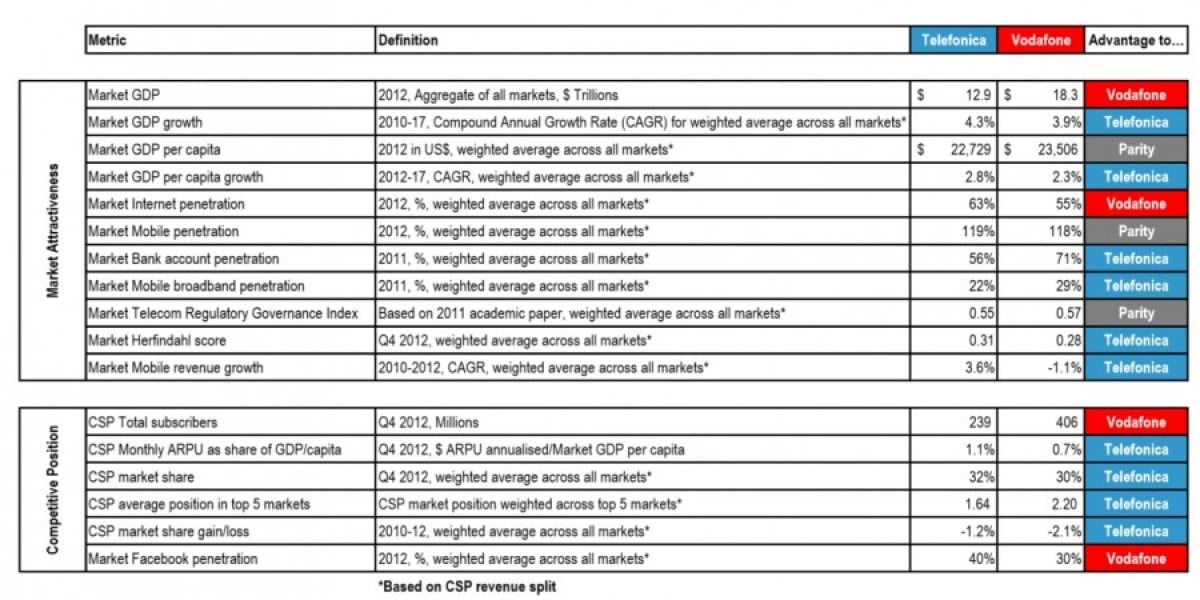
We explore a number of individual metrics within each dimension and, as we show in Figure 1 below, have collected data for each operator and then evaluated which of the two is in a stronger position.  Setting aside the three metrics where the CSPs are broadly at parity, at a summary level it appears that Telefonica appears to be in a stronger position than Vodafone:

  • Telefonica’s markets look more attractive than Vodafone’s: Telefonica outscores Vodafone by 6 metrics to 2 for Market Attractiveness including for GDP growth, GDP per capita growth, Bank account penetration, Broadband penetration, Herfindahl Score (a measure of a market’s structural attractiveness) and Mobile revenue growth.  Vodafone’s markets, by contrast, are only more attractive than Telefonica’s in terms of overall GDP size and Internet penetration.
  • Telefonica’s competitive position appears to be stronger than Vodafone’s: Telefonica outperforms Vodafone in 4 out of 6 metrics including ARPU as % of GDP per capita (ie share of wallet), market share, market position in top 5 markets, market share gain/loss.  Vodafone only outperforms Telefonica in 2 metrics: Total subscribers and Facebook penetration (with a lower penetration acting as a proxy for weaker OTT competition).

The ‘tale of the tape’ in Figure 1 is a top-line snapshot.  The rest of this report digs into a few of the metrics in more detail and seeks to explain where and how Telefonica is enjoying an advantage over Vodafone.

Figure 1: Telefonica and Vodafone Market Attractiveness and Competitive Positioning –

The Tale of the Tape

Figure 1: Telefonica and Vodafone Market Attractiveness and Competitive Positioning – The Tale of the Tape

Source: Company accounts; Market regulators, World Bank, International Monetary Fund, ITU, Internetworldstats.com, Benchmarking telecoms regulation – The Telecommunications Regulatory Governance Index (TRGI) by Leonard Wavermana, Pantelis Koutroumpis (published by Elsevier 2011) STL Partners analysis

  • Overview: Vodafone operates in more competitive markets and has weaker market positions than Telefonica
  • Telefonica is more exposed to fast-growing emerging markets
  • Vodafone has only 30% of revenue in emerging markets…
  • …compared with over 50% for Telefonica
  • Telefonica’s Latin American markets have grown much quicker than Vodafone’s Emerging ones…
  • …and Telefonica’s European markets have contracted at a similar rate to Vodafone’s Developed ones
  • Telefonica’s has a stronger competitive position than Vodafone in the most important markets
  • Overall, Telefonica has a stronger market position and is performing better in more attractive markets than Vodafone
  • Figure 1: Telefonica and Vodafone Market Attractiveness and Competitive Positioning – The Tale of the Tape
  • Figure 2:  Vodafone subscribers and revenue
  • Figure 3: Telefonica subscribers and revenue
  • Figure 4: Vodafone and Telefonica mobile market growth
  • Figure 5: Market shares in top 5 revenue-generating markets
  • Figure 6: Market Positioning Maps
  • Figure 7: Overall, Telefonica enjoys a 56% advantage over Vodafone using STL Partners’ Market Attractiveness-Competitive Situation (MACS) score
  • Figure 8: Portfolio Strategy Maps
  • Figure 9: Telefonica’s performance is broadly neutral and Vodafone’s negative using STL Partners’ EBITDA Margin-Market Share (EMMS) score

Facing Up to the Software-Defined Operator

Introduction

At this year’s Mobile World Congress, the GSMA’s eccentric decision to split the event between the Fira Gran Via (the “new Fira”, as everyone refers to it) and the Fira Montjuic (the “old Fira”, as everyone refers to it) was a better one than it looked. If you took the special MWC shuttle bus from the main event over to the developer track at the old Fira, you crossed a culture gap that is widening, not closing. The very fact that the developers were accommodated separately hints at this, but it was the content of the sessions that brought it home. At the main site, it was impressive and forward-thinking to say you had an app, and a big deal to launch a new Web site; at the developer track, presenters would start up a Web service during their own talk to demonstrate their point.

There has always been a cultural rift between the “netheads” and the “bellheads”, of which this is just the latest manifestation. But the content of the main event tended to suggest that this is an increasingly serious problem. Everywhere, we saw evidence that core telecoms infrastructure is becoming software. Major operators are moving towards this now. For example, AT&T used the event to announce that it had signed up Software Defined Networks (SDN) specialists Tail-F and Metaswitch Networks for its next round of upgrades, while Deutsche Telekom’s Terastream architecture is built on it.

This is not just about the overused three letter acronyms like “SDN and NFV” (Network Function Virtualisation – see our whitepaper on the subject here), nor about the duelling standards groups like OpenFlow, OpenDaylight etc., with their tendency to use the word “open” all the more the less open they actually are. It is a deeper transformation that will affect the device, the core network, the radio access network (RAN), the Operations Support Systems (OSS), the data centres, and the ownership structure of the industry. It will change the products we sell, the processes by which we deliver them, and the skills we require.

In the future, operators will be divided into providers of the platform for software-defined network services and consumers of the platform. Platform consumers, which will include MVNOs, operators, enterprises, SMBs, and perhaps even individual power users, will expect a degree of fine-grained control over network resources that amounts to specifying your own mobile network. Rather than trying to make a unitary public network provide all the potential options as network services, we should look at how we can provide the impression of one network per customer, just as virtualisation gives the impression of one computer per user.

To summarise, it is no longer enough to boast that your network can give the customer an API. Future operators should be able to provision a virtual network through the API. AT&T, for example, aims to provide a “user-defined network cloud”.

Elements of the Software-Defined Future

We see five major trends leading towards the overall picture of the ‘software defined operator’ – an operator whose boundaries and structure can be set and controlled through software.

1: Core network functions get deployed further and further forwards

Because core network functions like the Mobile Switching Centre (MSC) and Home Subscriber Server (HSS) can now be implemented in software on commodity hardware, they no longer have to be tied to major vendors’ equipment deployed in centralised facilities. This frees them to migrate towards the edge of the network, providing for more efficient use of transmission links, lower latency, and putting more features under the control of the customer.

Network architecture diagrams often show a boundary between “the Internet” and an “other network”. This is called the ‘Gi interface’ in 3G and 4G networks. Today, the “other network” is usually itself an IP-based network, making this distinction simply that between a carrier’s private network and the Internet core. Moving network functions forwards towards the edge also moves this boundary forwards, making it possible for Internet services like content-delivery networking or applications acceleration to advance closer to the user.

Increasingly, the network edge is a node supporting multiple software applications, some of which will be operated by the carrier, some by third-party services like – say – Akamai, and some by the carrier’s customers.

2: Access network functions get deployed further and further back

A parallel development to the emergence of integrated small cells/servers is the virtualisation and centralisation of functions traditionally found at the edge of the network. One example is so-called Cloud RAN or C-RAN technology in the mobile context, where the radio basebands are implemented as software and deployed as virtual machines running on a server somewhere convenient. This requires high capacity, low latency connectivity from this site to the antennas – typically fibre – and this is now being termed “fronthaul” by analogy to backhaul.

Another example is the virtualised Optical Line Terminal (OLT) some vendors offer in the context of fixed Fibre to the home (FTTH) deployments. In these, the network element that terminates the line from the user’s premises has been converted into software and centralised as a group of virtual machines. Still another would be the increasingly common “virtual Set Top Box (STB)” in cable networks, where the TV functions (electronic programming guide, stop/rewind/restart, time-shifting) associated with the STB are actually provided remotely by the network.

In this case, the degree of virtualisation, centralisation, and multiplexing can be very high, as latency and synchronisation are less of a problem. The functions could actually move all the way out of the operator network, off to a public cloud like Amazon EC2 – this is in fact how Netflix does it.

3: Some business support and applications functions are moving right out of the network entirely

If Netflix can deliver the world’s premier TV/video STB experience out of Amazon EC2, there is surely a strong case to look again at which applications should be delivered on-premises, in the private cloud, or moved into a public cloud. As explained later in this note, the distinctions between on-premises, forward-deployed, private cloud, and public cloud are themselves being eroded. At the strategic level, we anticipate pressure for more outsourcing and more hosted services.

4: Routers and switches are software, too

In the core of the network, the routers that link all this stuff together are also turning into software. This is the domain of true SDN – basically, the effort to substitute relatively smart routers with much cheaper switches whose forwarding rules are generated in software by a much smarter controller node. This is well reported elsewhere, but it is necessary to take note of it. In the mobile context, we also see this in the increasing prevalence of virtualised solutions for the LTE Enhanced Packet Core (EPC), Mobility Management Entity (MME), etc.

5: Wherever it is, software increasingly looks like the cloud

Virtualisation – the approach of configuring groups of computers to work like one big ‘virtual computer’ – is a key trend. Even when, as with the network devices, software is running on a dedicated machine, it will be increasingly found running in its own virtual machine. This helps with management and security, and most of all, with resource sharing and scalability. For example, the virtual baseband might have VMs for each of 2G, 3G, and 4G. If the capacity requirements are small, many different sites might share a physical machine. If large, one site might be running on several machines.

This has important implications, because it also makes sharing among users easier. Those users could be different functions, or different cell sites, but they could also be customers or other operators. It is no accident that NEC’s first virtualised product, announced at MWC, is a complete MVNO solution. It has never been as easy to provide more of your carrier needs yourself, and it will only get easier.

The following Huawei slide (from their Carrier Business Group CTO, Sanqi Li) gives a good visual overview of a software-defined network.

Figure 1: An architecture overview for a software-defined operator
An architecture overview for a software-defined operator March 2014

Source: Huawei


  • The Challenges of the Software-Defined Operator
  • Three Vendors and the Software-Defined Operator
  • Ericsson
  • Huawei
  • Cisco Systems
  • The Changing Role of the Vendors
  • Who Benefits?
  • Who Loses?
  • Conclusions
  • Platform provider or platform consumer
  • Define your network sharing strategy
  • Challenge the coding cultural cringe


  • Figure 1: An architecture overview for a software-defined operator
  • Figure 2: A catalogue for everything
  • Figure 3: Ericsson shares (part of) the vision
  • Figure 4: Huawei: “DevOps for carriers”
  • Figure 5: Cisco aims to dominate the software-defined “Internet of Everything”

Telco 2.0: Making Money from Location Insights

Preface

The provision of Location Insight Services (LIS) represents a significant opportunity for Telcos to monetise subscriber data assets. This report examines the findings of a survey conducted amongst representatives of key stakeholders within the emerging ecosystem, supplemented by STL Partners’ research and analysis with the objective of determining how operators can release the value from their unique position in the location value chain.

The report concentrates on the Location Insight Services (LIS), which leverage the aggregated and anonymised data asset derived from connected consumers’ mobile location data, as distinct from Location Based Services (LBS), which are dependent on the availability of individual real time data.

The report draws the distinction between Location Insight Services that are Person-centric and those that are Place-centric and assesses the different uses for each data set.

In order to service the demand from specific use cases as diverse as Benchmarking, Transport & Infrastructure Planning, Site Selection and Advertising Evaluation, operators face a choice between fulfilling the role of Data Supplier, providing the market with Raw Big Data or offering Professional Services, adding value through a combination of location insight reports and interpretation consultancy.

The report concludes with a comparative evaluation of options for operators in the provision of LIS services and a series of recommendations for operators to enable them to release the value in Location Insight Services.

Location data – untapped oil

The ubiquity of mobile devices has led to an explosion in the amount of location-specific data available and the market has been quick to capitalise on the opportunity by developing a range of Location-Based Services offering consumers content (in the form of information, promotional offers and advertising). Industry analysts predict that this market sector is already worth nearly $10 billion.

The vast majority of these Location Based Services (LBS) are dependent on the availability of real time data, on the reasonable assumption that knowing an individual’s location enables a company to make an offer that is more relevant, there and then.  But within the mobile operator community, there is a growing conviction that a wider opportunity exists in deriving Location Insight Services (LIS) from connected consumers’ mobile location data. This opportunity does not necessarily require real time data (see Figure 9). The underlying premise is that identification of repetitive patterns in location activity over time not only enables a much deeper understanding of the consumer in terms of behaviour and motivation, but also builds a clearer picture of the visitor profile of the location itself.

Figure 1:  Focus of this study is on Location Insight Services
Focus of this Study on Location Insight Services

  • As part of our Telco 2.0 Initiative, we have surveyed a number of companies from within the evolving location ecosystem to assess the potential value of operator subscriber data assets in the provision of Location Insight Services. This report examines the findings and illustrates how operators can release the value from their unique position in the location value chain.

Location Insight Services is a fast growing, high value opportunity

The demand is “Where”?

For operators to invest in the technology and resources required to enter this market, a compelling business case is required. Firstly, various analysts have confirmed that there is a massive latent demand for location-centric information within the business community to enable the delivery of location-specific products and services that are context-relevant to the consumer. According to the Economist Business Unit, there is a consensus amongst marketers that location information is an important element in developing marketing strategy, even for those companies where data on customer and prospect location is not currently collected.3

Figure 2: Location is seen as the most valuable information for developing marketing strategy
Location is seen as the most valuable information for developing marketing strategy

Source: Mind the marketing gap – A report from Economist Business Intelligence Unit

Scoping the LIS opportunity by industry and function

In order to understand the market potential for Location Insight Services, we have considered both industry sectors and job functions where insights derived from location data at scale improve business efficiencies. Our research has suggested that Location Insight Services have an application to many organisations that are seeking to address the broader issue of how to extract the benefits concealed within Big Data.

A recent report from Cisco concentrating on how to unlock the value of digital analytics suggested that Big Data has an almost universal application and

“Big Data could help almost any organization run better and more efficiently. A service provider could improve the day-to-day operations of its network. A retailer could create more efficient and lucrative point-of-sale interactions. And virtually any supply chain would run more smoothly. Overall, a common information fabric would improve process efficiency and provide a complete asset view.” 

Our research suggests that the following framework facilitates understanding of the different elements that together comprise the market for non-real time Location Insight Services.

The matrix considers the addressable market by reference to vertical industry sectors and horizontal function or disciplines.

We have rated the opportunities High, Medium and Low based on a high level assessment of the potential for uptake within each defined segment. In order to produce an estimate of the potential market size for non-real time Location Insight Services, STL Partners have taken into account the current revenue estimates for both industry sectors and functions.

Figure 3:  Location Insight Market Overview (telecoms excluded)
Location Insight Services Market Taxonomy

Report Contents

  • Preface
  • Executive Summary
  • Location data – untapped oil
  • Location Insight Services is a fast growing, high value opportunity
  • Scoping the LIS opportunity by industry and function
  • Location Insight Services could be worth $11bn globally by 2016
  • Which use cases will drive uptake of LIS?
  • Use cases – industry-specific illustrations
  • How should Telcos “productise” location insights services?
  • Operators are uniquely placed to deliver location insights and secure a significant share of this opportunity
  • What is the operator LIS value proposition?
  • Location insight represents a Big Data challenge for Telcos.
  • There is a demand for more granular location data
  • Increasing precision commands a premium
  • Meeting LIS requirements – options for operators
  • What steps should operators take?
  • Methodology and reference sources
  • References
  • Appendix 1 – Opportunity Sizing
  • Definition
  • Methodology


  • Figure 1: Focus of this study is on Location Insight Services
  • Figure 2: Location is seen as the most valuable information for developing marketing strategy
  • Figure 3: Location Insight Market Overview (telecoms excluded)
  • Figure 4: The value of Global Location Insight Services by industry and sector (by 2016)
  • Figure 5: How UK retail businesses use location based insights
  • Figure 6: Illustrative use cases within the Location Insights taxonomy
  • Figure 7: How can Telcos create value from customer data?
  • Figure 8: Key considerations for Telco LIS service strategy formulation
  • Figure 9: Real time service vs. Insight
  • Figure 10: The local link in global digital markets
  • Figure 11: Customer Data generated by Telcos
  • Figure 12: Power of insight from combining three key domains
  • Figure 13: Meeting LIS Requirements – Options for Operators

Finance: Optimising the Telco 2.0 revenue and cost model

Summary: Structuring finances is key for the success of innovations in general and Telco 2.0 projects in particular. In this detailed extract from our new strategy report ‘A Practical Guide to Implementing Telco 2.0’, we describe the best ways to approach the management of revenues and costs of new business models, and how to get the CFO and finance department onside with the new approaches required (February 2013, Executive Briefing Service, Transformation Stream). Small table on finances
  Read in Full (Members only)  To Subscribe click here

Below is an extract from this 15 page Telco 2.0 Report that can be downloaded in full in PDF format by members of the Telco 2.0 Executive Briefing service and the Telco 2.0 Transformation Stream here. Non-members can subscribe here or other enquiries, please email contact@telco2.net / call +44 (0) 207 247 5003.

We’ll also be discussing our findings at the New Digital Economics Brainstorms in Silicon Valley, 19-20 March, 2013 and in EMEA 2013 in London, June 5-6.

Telco 2.0 has a different financial model to Telco 1.0

Cash Returns On Invested Capital (CROIC) is a good measure of company performance because it demonstrates how much cash investors get back on the money they deploy in a business. It removes measures that can be open to interpretation or manipulation such as earnings, depreciation or amortisation. In simple terms CROIC is calculated as:

Figure 1: Cash Returns On Invested Capital (CROIC)
CROIC Definition

While it is simplistic, STL Partners broadly sees the benefits of a Telco 2.0 Happy Pipe strategy accruing to a CSP in the form of higher EBITDA (Earnings Before Interest, Tax, Depreciation and Amortisation) margins (owing to lower costs) and lower capital expenditures. A Telco 2.0 Service Provider strategy will seek to also achieve this as well as generate sales growth. It is, therefore, easy to see why many operators are interested in pursuing a Telco 2.0 Service Provider strategy: if they can execute successfully then they will receive a double-whammy benefit on CROIC because lower opex and higher sales will result in more free cash flow being generated from lower levels of invested capital.

CROIC also demonstrates how the current financial metrics used by operators – particularly EBITDA margins – preclude operators from considering different operational and business models which may have lower EBITDA margins but higher overall cash returns on invested capital. Thus, as shown in Figure 2 (showing relative rather than actual financials), CSPs tend to focus on the existing capital-intensive business which currently generates CROIC of around 6% for most operators rather than investing in new business model areas which yield higher returns. The new business model areas require relatively low levels of incremental capital investment so, although they generate lower EBITDA margins than existing Telco 1.0 services, they can generate substantial CROIC margins and can ‘move the needle’ for operators.

Specifically, Figure 2 illustrates the way that different skills and operational models translate into different financial models by showing:

  • Telco 1.0 (Core Services + Vertical Industries Solutions (SI) + Infrastructure Services) requires high capital investment and generates relative low levels of revenue for each $1 of invested capital ($0.5-0.7) but at high EBITDA margin (30-50%). This results in healthy cash generation (EBITDA) but a large proportion of this cash needs to be reinvested as capital expenditure each year resulting in relatively modest levels of free cash flow and CROIC of 5.2-6.4% for a typical CSP.
  • Even if we exclude any capex and opex savings generated from becoming a Telco 2.0 Happy Pipe, the addition of additional revenues from Embedded Communications (see Strategy 2.0: The Six Key Telco 2.0 Opportunities) mean that a Happy Piper generates new revenues that require relatively low levels of capital investment. Although these ‘embedded communications’ revenues are at a lower margin than the core services (28% compared with 45%), they require little incremental capital expenditure. This means that free cash flow is healthy and CROIC for Embedded Communications is 10.7% lifting the Happy Piper overall CROIC percentage.
  • For the Telco 2.0 Service Provider, again setting aside any efficiency benefits from adopting Telco 2.0 principles, the two pure-play Telco 2.0 service areas – Third-party Business Enablers and Own-brand OTT – have very different financial characteristics. They generate much lower EBITDA margins (15-20%) but generate significantly higher sales relative to capital investment ($1.4-2.0) and so are able to generate substantially higher CROIC than the Telco 1.0 services.

In essence, the new ‘product innovation’ businesses associated with being a Telco 2.0 Service Provider are much closer to an internet player such as Amazon or the early Google business (prior to heavy capital investment in fibre and data centres) in the way they make money. Not convinced? Look at Figure 3 which demonstrates the return on total assets generated by CSPs and three key internet players – Microsoft, Google and Amazon. Microsoft, a software business, generates high margins on a relatively low capital base (and hence generates very strong returns) owing to its dominant position on the desktop. Microsoft’s issue is growth not profitability, hence the big investments it is making in its internet business and in mobile. The young

Google and Amazon are classic product innovation businesses – low margin and high sales generation relative to invested capital. The CSP group all generate sales of $0.3-0.7 per $1 of capital but generate higher margins than Amazon and Google before 2005.

So we can see that the new Telco 2.0 business model makes money in a different way to the traditional business and needs to be managed and measured in a new way. Let’s explore the implications of this in more detail.

Figure 2: Cash Returns on Invest Capital of different Telco 2.0 opportunity areas

This table demonstrates the relative, rather than absolute, financial metrics for different CSP opportunity areas. The starting point is a nominal $1,000 of invested capital in the CSP network that results in $500 of annualised ‘Core Services’ revenues. Levels of invested capital, sales, EBITDA, annual capex, tax and free cash flow are then shown for each of the opportunity areas.

Different returns of different business models

Figure 3: Different financial models illustrated – CSPs vs Internet Players

This chart shows how different businesses generate returns by plotting asset intensity (x-axis) against profitability (y-axis). Note that the profitability measure here (NOPAT margin) is not directly comparable to the EBITDA margin in Figure 2 as this is post-taxation.

Different returns at different stages of business development

Revenue model implications and guiding principles

The different types of revenue to be considered when developing a new Telco 2.0 service are outlined in detail in the A Practical Guide to Implementing Telco 2.0 in the section on the Telco 2.0 Service Development Process. These include different revenue types (such as single stream, multi-stream, interdependent), different revenue models (subscriptions, unit charges, advertising, licensing and commissions) and different sources (consumer, SME, enterprise as both end users and as third-party service providers – advertisers, merchants, etc.). It is clear that:

  • Telco 1.0 services are largely single stream, confined to a few models (subscription and per unit charging) and sourced from end users (consumers, SMEs and enterprises).
  • Telco 2.0 services typically have more revenue types, including interdependent (two-sided revenues), introduce more revenue models, including advertising and commission, and source revenues from third-parties as well as end-users.

But what about how these new revenue types, models and sources impact the overall CSP business? How should (finance) managers now evaluate services given the different financial models between Telco 1.0 and Telco 2.0? What constitutes ‘attractive’ now? What metrics are the right ones to use? What trade-offs between the Telco 1.0 and Telco 2.0 revenue models need to be considered?

Five guiding principles for revenue models

We lay out 5 revenue model guiding principles to help you address these knotty questions below:

1. Ensure your revenue model supports your overall strategy and need to build appropriate ecosystem control points.

In the Telco 1.0 world, the revenue model is simple and, although pricing is complex, decision- making is simplified by clear goals – to maximise the number of paying users and manage the price-volume trade-off (higher prices = lower volume of users or transactions) to maximise overall returns from communications services. The Telco 2.0 world is far more complex. As well as having ‘more revenue levers to pull’, management needs to consider the company’s overall digital strategy beyond communications.

CSPs need to consider where and how they will create one or more control points within the digital ecosystem. Revenue and pricing strategy is a core component of this. In some arenas – payments for example – CSPs may choose to price their services very low or make them free to build up a large number of mobile wallet users and a strong merchant network that can be monetised in another arena – mobile advertising perhaps. In other words, management cannot take a siloed approach to the CSP revenue model – there is a need to think horizontally across the CSP digital platform.

To read the note in full, including the following additional analysis…

  • The rest of the five guiding principles for revenue models
  • Five guiding principles for cost models
  • Final thoughts on Telco 2.0 finances – how to work with the Finance team


…and the following figures

  • Figure 1: Cash Returns On Invested Capital (CROIC)
  • Figure 2: Cash Returns on Invest Capital of different Telco 2.0 opportunity areas
  • Figure 3: Different financial models illustrated – CSPs vs Internet Players
  • Figure 4: Revenue metrics – Telco 1.0 and Telco 2.0 examples
  • Figure 5: Product Innovation vs Infrastructure cost models – Unilever & Vodafone


Members of the Telco 2.0 Executive Briefing Subscription Service and the Telco 2.0 Transformation Stream can download the full 15 page report in PDF format hereNon-Members, please subscribe here or email contact@telco2.net / call +44 (0) 207 247 5003.