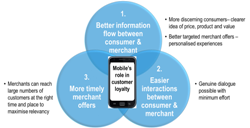
How can telcos be loved?

Why should telcos care about being a ‘loved brand’?

If you are from an engineering or financial background, it can be tempting to look at branding and think it is a trivial or ‘soft’ aspect of business. This is valid in the sense that perceptions are inherently subjective, but this subjectivity does not mean that such perceptions are unimportant. People respond very strongly and instinctively to emotional stimuli. These responses are deep in our nature. We have evolved to quickly learn the characteristics of things that we want to repeat; the things we like. This extends to social behaviours too: Who do we want to be with, and be seen to be with? Which ‘tribe’ are we in, and who do we associate with?

Businesses have learnt a lot about this, because it has proved hugely valuable to the best practitioners, and the study and practices of marketing, advertising and branding have developed significantly in the past seventy years as a result. To be a ‘loved brand’ is a shorthand description of the ideal state.

What is a loved brand and what are the advantages?

Loved brands create strong emotional bonds with their customers, through a set of values and beliefs that customers can identify with and incorporate into their daily lives. In theory, businesses with loved brands have a range of advantages over others, which over time create significant financial benefits.

Business advantages for loved brands

Source: STL Partners

They enable businesses to charge a premium over other competitors as consumers pay less notice to the price of products sold by the loved brand.

  1. Loved brands can charge a premium over other competitors as consumers pay less notice to the price of products sold by the loved brand. Apple iPhones are generally more expensive than competitors’ phones with similar feature sets. However, many Apple customers remain loyal with the status of owning the latest iPhone outweighing the additional cost.
  2. The emotional bonds with loved brands can become so robust that their customers do not consider their competitors and forcefully defend the brand. Customers are even willing to forgive the brand for making some mistakes.In 2010, Ferrari recalled more than one thousand Italia 458 cars after reports that a design fault could cause them to catch fire.Despite the obvious negative publicity, which would have had a catastrophic consequence on many manufacturers, Ferrari’s strong emotional connection with its customers protected their position in the luxury car market.
  3. Customers become valuable promotors of loved brands on their social networks, pushing the benefits and encouraging others to join. Tesla provides a great illustration of this advantage, where many of the customers are not only delighted with their new electric vehicle, but they are also strong advocates in persuading their friends and family to purchase a Tesla for themselves.
  4. Loved brands attract the best talent, which helps the business to sustain its success.

Enter your details below to request an extract of the report

Table of Contents

  • Executive Summary
  • Loved brands
    • Why should telcos care about being a ‘loved brand’?
    • What is a loved brand and what are the advantages?
  • Challenges for telcos in being a loved brand
    • How are telcos viewed by their customers?
    • Why do telcos find it hard to be loved?
  • Common telco strategies that have had limited success to date
    • Focus on having the best network
    • Offering the lowest prices in the market
    • Differentiating on customer relationship
    • Offering content bundles
    • Launching new service innovation and diversification strategies
  • What strategies could telcos adopt to succeed going forward?
  • Case study 1: TELUS brand positioning
  • Case study 2: o2 Priority Moments
  • Case study 3: MTN – sustainable economic value
  • Case study 4: Telstra Health
  • Deep dive: What learnings can be drawn from successful strategies adopted by Orange
    • What has Orange done?
    • What has been the impact on Orange’s results?
    • How has strategy contributed to Orange being a loved brand?
    • What lessons are there for other operators?
  • How do others develop and sustain “the love”?
  • Recommendations for being a loved brand in the new era for telecoms
  • Index

Related research


Why the consumer IoT is stuck in the slow lane

A slow start for NB-IoT and LTE-M

For telcos around the world, the Internet of Things (IoT) has long represented one of the most promising growth opportunities. Yet for most telcos, the IoT still only accounts for a low single digit percentage of their overall revenue. One of the stumbling blocks has been relatively low demand for IoT solutions in the consumer market. This report considers why that is and whether low cost connectivity technologies specifically-designed for the IoT (such as NB-IoT and LTE-M) will ultimately change this dynamic.

NB-IoT and LTE-M are often referred to as Massive IoT technologies because they are designed to support large numbers of connections, which periodically transmit small amounts of data. They can be distinguished from broadband IoT connections, which carry more demanding applications, such as video content, and critical IoT connections that need to be always available and ultra-reliable.

The initial standards for both technologies were completed by 3GPP in 2016, but adoption has been relatively modest. This report considers the key B2C and B2B2C use cases for Massive IoT technologies and the prospects for widespread adoption. It also outlines how NB-IoT and LTE-M are evolving and the implications for telcos’ strategies.

This builds on previous STL Partners’ research, including LPWA: Which way to go for IoT? and Can telcos create a compelling smart home?. The LPWA report explained why IoT networks need to be considered across multiple generations, including coverage, reliability, power consumption, range and bandwidth. Cellular technologies tend to be best suited to wide area applications for which very reliable connectivity is required (see Figure below).

IoT networks should be considered across multiple dimensions

IoT-networks-disruptive-analysis-stl-2021
Source: Disruptive Analysis


Enter your details below to request an extract of the report

The smart home report outlined how consumers could use both cellular and short-range connectivity to bolster security, improve energy efficiency, charge electric cars and increasingly automate appliances. One of the biggest underlying drivers in the smart home sector is peace of mind – householders want to protect their properties and their assets, as rising population growth and inequality fuels fear of crime.

That report contended that householders might be prepared to pay for a simple and integrated way to monitor and remotely control all their assets, from door locks and televisions to solar panels and vehicles.  Ideally, a dashboard would show the status and location of everything an individual cares about. Such a dashboard could show the energy usage and running cost of each appliance in real-time, giving householders fingertip control over their possessions. They could use the resulting information to help them source appropriate insurance and utility supply.

Indeed, STL Partners believes telcos have a broad opportunity to help coordinate better use of the world’s resources and assets, as outlined in the report: The Coordination Age: A third age of telecoms. Reliable and ubiquitous connectivity is a key enabler of the emerging sharing economy in which people use digital technologies to easily rent the use of assets, such as properties and vehicles, to others. The data collected by connected appliances and sensors could be used to help safeguard a property against misuse and source appropriate insurance covering third party rentals.

Do consumers need Massive IoT?

Whereas some IoT applications, such as connected security cameras and drones, require high-speed and very responsive connectivity, most do not. Connected devices that are designed to collect and relay small amounts of data, such as location, temperature, power consumption or movement, don’t need a high-speed connection.

To support these devices, the cellular industry has developed two key technologies – LTE-M (LTE for Machines, sometimes referred to as Cat M) and NB-IoT (Narrowband IoT). In theory, they can be deployed through a straightforward upgrade to existing LTE base stations. Although these technologies don’t offer the capacity, throughput or responsiveness of conventional LTE, they do support the low power wide area connectivity required for what is known as Massive IoT – the deployment of large numbers of low cost sensors and actuators.

For mobile operators, the deployment of NB-IoT and LTE-M can be quite straightforward. If they have relatively modern LTE base stations, then NB-IoT can be enabled via a software upgrade. If their existing LTE network is reasonably dense, there is no need to deploy additional sites – NB-IoT, and to a lesser extent LTE-M, are designed to penetrate deep inside buildings. Still, individual base stations may need to be optimised on a site-by-site basis to ensure that they get the full benefit of NB-IoT’s low power levels, according to a report by The Mobile Network, which notes that operators also need to invest in systems that can provide third parties with visibility and control of IoT devices, usage and costs.

There are a number of potential use cases for Massive IoT in the consumer market:

  • Asset tracking: pets, bikes, scooters, vehicles, keys, wallets, passport, phones, laptops, tablets etc.
  • Vulnerable persontracking: children and the elderly
  • Health wearables: wristbands, smart watches
  • Metering and monitoring: power, water, garden,
  • Alarms and security: smoke alarms, carbon monoxide, intrusion
  • Digital homes: automation of temperature and lighting in line with occupancy

In the rest of this report we consider the key drivers and barriers to take-up of NB-IoT and LTE-M for these consumer use cases.

Table of Contents

  • Executive Summary
  • Introduction
  • Do consumers need Massive IoT?
    • The role of eSIMs
    • Takeaways
  • Market trends
    • IoT revenues: Small, but growing
  • Consumer use cases for cellular IoT
    • Amazon’s consumer IoT play
    • Asset tracking: Demand is growing
    • Connecting e-bikes and scooters
    • Slow progress in healthcare
    • Smart metering gains momentum
    • Supporting micro-generation and storage
    • Digital buildings: A regulatory play?
    • Managing household appliances
  • Technological advances
    • Network coverage
  • Conclusions: Strategic implications for telcos


Enter your details below to request an extract of the report

AI is starting to pay: Time to scale adoption

=======================================================================================

Download the additional file on the left for the PPT chart pack accompanying this report

=======================================================================================

AI adoption yields positive results

Over the last five years, telcos have made measurable progress in AI adoption and it is starting to pay off.  When compared to all industries, telcos have become adept at handling large data sets and implementing automation. Over the last several years the telecoms industry has gone from not knowing where or how to implement AI, to having developed and implemented hundreds of AI and automation applications for network operations, fraud prevention, customer channel management, and sales and marketing. We have discussed these use cases and operator strategies and opportunities in detail in previous reports.

For the more advanced telcos, the challenge is no longer setting up data management platforms and systems and identifying promising use cases for AI and automation, but overcoming the organisational and cultural barriers to becoming truly data-centric in mindset, processes and operations. A significant part of this challenge includes disseminating AI adoption and expertise of these technologies and associated skills to the wider organisation, beyond a centralised AI team.The benchmark for success here is not other telcos, or companies in other industries with large legacy and physical assets, but digital- and cloud-native companies that have been established with a data-centric mindset and practices from the start. This includes global technology companies like Microsoft, Google and Amazon, who increasingly see telecoms operators as customers, or perhaps even competitors one day, as well as greenfield players such as Rakuten, Jio and DISH, which as well as more modern networks have fewer ingrained legacy processes and cultural practices to overcome.

Enter your details below to request an extract of the report

Enter your details below to request an extract of the report

Telecoms has a high AI adoption rate compared with other industries

AI pays off

Source: McKinsey

In this report, we assess several telcos’ approach to AI and the results they have achieved so far, and draw some lessons on what kind of strategy and ambition leads to better results. In the second section of the report, we explore in more detail the concrete steps telcos can take to help accelerate and scale the use of AI and automation across the organisation, in the hopes of becoming more data-driven businesses.

While not all telcos have an ambition to drive new revenue growth through development of their own IP in AI, to form the basis of new enterprise or consumer services, all operators will need AI to permeate their internal processes to compete effectively in the long term. Therefore, whatever the level ambition, disseminating fundamental AI and data skills across the organisation is crucial to long term success. STL Partners believes that the sooner telcos can master these skills, the higher their chances of successfully applying them to drive innovation both in core connectivity and new services higher up the value chain.

Contents

  • Executive Summary
  • Introduction
  • Developing an AI strategy: What is it for?
    • Telefónica: From AURA and LUCA to Telefónica Tech
    • Vodafone: An efficiency focused strategy
    • Elisa: A vertical application approach
    • Takeaways: Comparing three approaches
  • AI maturity progression
    • Adopt big data analytics: The basic building blocks
    • Creating a centralised AI unit
    • Creating a new business unit
    • Disseminating AI across the organisation
  • Using partnerships to accelerate and scale AI
    • O2 and Cardinality
    • AT&T Acumos
  • Conclusion and recommendations
  • Index

Enter your details below to request an extract of the report

Telcos in healthcare: Winning in a long game, Babylon, and the impact of 5G

Introduction: telcos in healthcare

This is a summary of some of the learnings from another fascinating session at the TELUS Carrier Health Summit in Toronto, May 22nd 2019. This is an annual gathering that was hosted by TELUS Global Solutions for telcos and their partners in healthcare.

Of the hosts, Fawad Shaikh, VP TELUS Global Solutions, said it ran this years’ session because it wants “to develop an alliance of like-minded telcos in health”. David Thomas, VP TELUS Health Solutions, added that “healthcare has to be delivered locally, which is a real plus for telcos. Yet we all need to gain global scale to compete, so it is a great opportunity for non-competitive collaboration.”

About sixty people from telcos and health tech companies were there this year, and the audience was global, with representatives from Latin America, N America, Europe, the Middle East, Asia and Australasia.

STL Partners presented its research on nine telco healthcare studies, and caught up with participants, including Dr Ali Parsa, CEO and founder of Babylon Health, and Mairi Johnson, its Global Partnerships Director.

Enter your details below to request an extract of the report

Healthcare: the problem to be solved

Healthcare is one of our favourite examples of the drive behind the Coordination Age. The explanation is simple:

The problem with healthcare in most economies is not that there isn’t great medicine and healthcare professionals. It’s getting it all delivered to the patients at the right time and at a cost that’s affordable.

This is fundamentally a coordination problem: bringing the right assets (whether physical or digital – a nurse, a treatment, or the patients’ records) together for the patient. Then maintaining the order throughout the patients’ treatment, and indeed, their lives.

All healthcare systems face multiple mounting pressures: growing and ageing populations, greater costs, skills challenges, and more pressure on funding from other sources to name a few.

There’s money in health

It’s also an area of HUGE expenditure. PWC’s Tara McCarville shared figures showing that:

  • Global healthcare spend is forecast to grow from $9.7 Trillion in 2014, to $18 Trillion in 2040, growing at 21% CAGR over the next 5 years.
  • Even so, it’s perhaps surprising that 84% of Fortune 50 companies are engaged in healthcare in some way.

Given this, it’s less surprising to note that the big tech players are seriously engaged in digital health too, with Amazon’s recent tie up with JP Morgan and Berkshire Hathaway to create the Haven Group being the most eye-catching. Others between CVS and Aetna, and Sanofi and Click Therapies involve less broadly familiar names, but are weighty nonetheless.

From a government perspective the numbers are big too. In the UK for example, which is one of the EU’s lower healthcare spenders per capita, the NHS’s annual bill is currently £154 billion, and it’s forecast to rise to £188 billion in 15 years (to 2033).

A 5% tax rise?

Without borrowing, this would lead to something like a 5% increase in overall taxation. Over 98% of UK tax funding is from ‘general taxation and national insurance’ – so mainly income tax, VAT and ongoing employment contributions.  In other words, people would have to pay.

Despite the UK’s love of the NHS, a permanent 5% tax rise would draw many concerned breaths from both politicians and the public. The need to find better solutions is genuinely pressing.

(NB Try out this calculator made by the Institute of Fiscal Studies if you fancy yourself as a policy guru. To fund healthcare, would you raise taxes, cut pensions, defence, or education?)

Figure 2: The Institute of Fiscal Studies’ (IFS) Health Budget Calculator

IFS NHS Budget Calculator
Meeting the NHS’s future funding needs would mean a 5% UK tax rise

Source: https://explore.ifs.org.uk/tools/nhs_funding/tool NB At £154bn, the Health spending category is already bigger than all those above.

The rest of the report contains:

  • The road to Babylon – one of the ways ahead?
  • Some telcos are scared by health, others are serious about it
  • 5G, Healthcare – or both?
  • Conclusions: telcos in healthcare – making a long game a good one

And includes the following figures:

  • Figure 1: How to succeed in telco health – key learnings from the Summit
  • Figure 2: The Institute of Fiscal Studies’ (IFS) Health Budget Calculator
  • Figure 3: Babyl has particular strength in Rwanda’s rural areas
  • Figure 4: A flavour of Babylon’s UK online offering
  • Figure 5: Pros and cons of telcos in healthcare
  • Figure 6: Telstra’s National Cervical Cancer Screening programme benefits
  • Figure 7: Telcos face a serious choice in Capex / Opex investments

Enter your details below to request an extract of the report

MobiNEX: The Mobile Network Experience Index, H1 2016

Executive Summary

In response to customers’ growing usage of mobile data and applications, in April 2016 STL Partners developed MobiNEX: The Mobile Network Experience Index, which ranks mobile network operators by key measures relating to customer experience. To do this, we benchmark mobile operators’ network speed and reliability, allowing individual operators to see how they are performing in relation to the competition in an objective and quantitative manner.

Operators are assigned an individual MobiNEX score out of 100 based on their performance across four measures that STL Partners believes to be core drivers of customer app experience: download speed, average latency, error rate and latency consistency (the proportion of app requests that take longer than 500ms to fulfil).

Our partner Apteligent has provided us with the raw data for three out of the four measures, based on billions of requests made from tens of thousands of applications used by hundreds of millions of users in H1 2016. While our April report focused on the top three or four operators in just seven Western markets, this report covers 80 operators drawn from 25 markets spread across the globe in the first six months of this year.

The top ten operators were from Japan, France, the UK and Canada:

  • Softbank JP scores highest on the MobiNEX for H1 2016, with high scores across all measures and a total score of 85 out of 100.
  • Close behind are Bouygues FR (80) and Free FR (79), which came first and second respectively in the Q4 2015 rankings. Both achieve high scores for error rate, latency consistency and average latency, but are slightly let down by download speed.
  • The top six is completed by NTT DoCoMo JP (78), Orange FR (75) and au (KDDI) JP (71).
  • Slightly behind are Vodafone UK (65), EE UK (64), SFR FR (63), O2 UK (62) and Rogers CA (62). Except in the case of Rogers, who score similarly on all measures, these operators are let down by substantially worse download speeds.

The bottom ten operators all score a total of 16 or lower out of 100, suggesting a materially worse customer app experience.

  • Trailing the pack with scores of 1 or 2 across all four measures were Etisalat EG (4), Vodafone EG (4), Smart PH (5) and Globe PH (5).
  • Beeline RU (11) and Malaysian operators U Mobile MY (9) and Digi MY (9) also fare poorly, but benefit from slightly higher latency consistency scores. Slightly better overall, but still achieving minimum scores of 1 for download speed and average latency, are Maxis MY (14) and MTN ZA (12).

Overall, the extreme difference between the top and bottom of the table highlights a vast inequality in network quality customer experience across the planet. Customer app experience depends to a large degree on where one lives. However, our analysis shows that while economic prosperity does in general lead to a more advanced mobile experience as you might expect, it does not guarantee it. Norway, Sweden, Singapore and the US market are examples of high income countries with lower MobiNEX scores than might be expected against the global picture. STL Partners will do further analysis to uncover more on the drivers of differentiation between markets and players within them.


MobiNEX H1 2016 – included markets

MobiNEX H1 2016 – operator scores

 Source: Apteligent, OpenSignal, STL Partners analysis


  • About MobiNEX
  • Changes for H1 2016
  • MobiNEX H1 2016: results
  • The winners: top ten operators
  • The losers: bottom ten operators
  • The surprises: operators where you wouldn’t expect them
  • MobiNEX by market
  • MobiNEX H1 2016: segmentation
  • MobiNEX H1 2016: Raw data
  • Error rate
  • Latency consistency
  • Download speed
  • Average latency
  • Appendix 1: Methodology and source data
  • Latency, latency consistency and error rate: Apteligent
  • Download speed: OpenSignal
  • Converting raw data into MobiNEX scores
  • Setting the benchmarks
  • Why measure customer experience through app performance?
  • Appendix 2: Country profiles
  • Country profile: Australia
  • Country profile: Brazil
  • Country profile: Canada
  • Country profile: China
  • Country profile: Colombia
  • Country profile: Egypt
  • Country profile: France
  • Country profile: Germany
  • Country profile: Italy
  • Country profile: Japan
  • Country profile: Malaysia
  • Country profile: Mexico
  • Country profile: New Zealand
  • Country profile: Norway
  • Country profile: Philippines
  • Country profile: Russia
  • Country profile: Saudi Arabia
  • Country profile: Singapore
  • Country profile: South Africa
  • Country profile: Spain
  • Country profile: United Arab Emirates
  • Country profile: United Kingdom
  • Country profile: United States
  • Country profile: Vietnam


  • Figure 1: MobiNEX scoring breakdown, benchmarks and raw data used
  • Figure 2: MobiNEX H1 2016 – included markets
  • Figure 3: MobiNEX H1 2016 – operator scores breakdown (top half)
  • Figure 4: MobiNEX H1 2016 – operator scores breakdown (bottom half)
  • Figure 5: MobiNEX H1 2016 – average scores by country
  • Figure 6: MobiNEX segmentation dimensions
  • Figure 7: MobiNEX segmentation – network speed vs reliability
  • Figure 8: MobiNEX segmentation – network speed vs reliability – average by market
  • Figure 9: MobiNEX vs GDP per capita – H1 2016
  • Figure 10: MobiNEX vs smartphone penetration – H1 2016
  • Figure 11: Error rate per 10,000 requests, H1 2016 – average by country
  • Figure 12: Error rate per 10,000 requests, H1 2016 (top half)
  • Figure 13: Error rate per 10,000 requests, H1 2016 (bottom half)
  • Figure 14: Requests with total roundtrip latency > 500ms (%), H1 2016 – average by country
  • Figure 15: Requests with total roundtrip latency > 500ms (%), H1 2016 (top half)
  • Figure 16: Requests with total roundtrip latency > 500ms (%), H1 2016 (bottom half)
  • Figure 17: Average weighted download speed (Mbps), H1 2016 – average by country
  • Figure 18: Average weighted download speed (Mbps), H1 2016 (top half)
  • Figure 19: Average weighted download speed (Mbps), H1 2016 (bottom half)
  • Figure 20: Average total roundtrip latency (ms), H1 2016 – average by country
  • Figure 21: Average total roundtrip latency (ms), H1 2016 (top half)
  • Figure 22: Average total roundtrip latency (ms), H1 2016 (bottom half)
  • Figure 23: Benchmarks and raw data used

MobiNEX: The Mobile Network Experience Index, Q4 2015

Executive Summary

In response to customers’ growing usage of mobile data and applications, STL Partners has developed MobiNEX: The Mobile Network Customer Experience Index, which benchmarks mobile operators’ network speed and reliability by measuring the consumer app experience, and allows individual players to see how they are performing in relation to competition in an objective and quantitative manner.

We assign operators an individual MobiNEX score based on their performance across four measures that are core drivers of customer app experience: download speed; average latency; error rate; latency consistency (the percentage of app requests that take longer than 500ms to fulfil). Apteligent has provided us with the raw data for three out of four of the measures based on billions of requests made from tens of thousands of applications used by hundreds of millions of users in Q4 2015. We plan to expand the index to cover other operators and to track performance over time with twice-yearly updates.

Encouragingly, MobiNEX scores are positively correlated with customer satisfaction in the UK and the US suggesting that a better mobile app experience contributes to customer satisfaction.

The top five performers across twenty-seven operators in seven countries in Europe and North America (Canada, France, Germany, Italy, Spain, UK, US) were all from France and the UK suggesting a high degree of competition in these markets as operators strive to improve relative to peers:

  • Bouygues Telecom in France scores highest on the MobiNEX for Q4 2015 with consistently high scores across all four measures and a total score of 76 out of 100.
  • It is closely followed by two other French operators. Free, the late entrant to the market, which started operations in 2012, scores 73. Orange, the former national incumbent, is slightly let down by the number of app errors experienced by users but achieves a healthy overall score of 70.
  • The top five is completed by two UK operators: EE (65) and O2 (61) with similar scores to the three French operators for everything except download speed which was substantially worse.

The bottom five operators have scores suggesting a materially worse customer app experience and we suggest that management focuses on improvements across all four measures to strengthen their customer relationships and competitive position. This applies particularly to:

  • E-Plus in Germany (now part of Telefónica’s O2 network but identified separately by Apteligent).
  • Wind in Italy, which is particularly let down by latency consistency and download speed.
  • Telefónica’s Movistar, the Spanish market share leader.
  • Sprint in the US with middle-ranking average latency and latency consistency but, like other US operators, poor scores on error rate and download speed.
  • 3 Italy, principally a result of its low latency consistency score.

Surprisingly, given the extensive deployment of 4G networks there, the US operators perform poorly and are providing an underwhelming customer app experience:

  • The best-performing US operator, T-Mobile, scores only 45 – a full 31 points below Bouygues Telecom and 4 points below the median operator.
  • All the US operators perform very poorly on error rate and, although 74% of app requests in the US were made on LTE in Q4 2015, no US player scores highly on download speed.

MobiNEX scores – Q4 2015

 Source: Apteligent, OpenSignal, STL Partners analysis

MobiNEX vs Customer Satisfaction

Source: ACSI, NCSI-UK, STL Partners


  • Introduction
  • Mobile app performance is dependent on more than network speed
  • App performance as a measure of customer experience
  • MobiNEX: The Mobile Network Experience Index
  • Methodology and key terms
  • MobiNEX Q4 2015 Results: Top 5, bottom 5, surprises
  • MobiNEX is correlated with customer satisfaction
  • Segmenting operators by network customer experience
  • Error rate
  • Quantitative analysis
  • Key findings
  • Latency consistency: Requests with latency over 500ms
  • Quantitative analysis
  • Key findings
  • Download speed
  • Quantitative analysis
  • Key findings
  • Average latency
  • Quantitative analysis
  • Key findings
  • Appendix: Source data and methodology
  • STL Partners and Telco 2.0: Change the Game
  • About Apteligent


  • MobiNEX scores – Q4 2015
  • MobiNEX vs Customer Satisfaction
  • Figure 1: MobiNEX – scoring methodology
  • Figure 2: MobiNEX scores – Q4 2015
  • Figure 3: Customer Satisfaction vs MobiNEX, 2015
  • Figure 4: MobiNEX operator segmentation – network speed vs network reliability
  • Figure 5: MobiNEX operator segmentation – with total scores
  • Figure 6: Major Western markets – error rate per 10,000 requests
  • Figure 7: Major Western markets – average error rate per 10,000 requests
  • Figure 8: Major Western operators – percentage of requests with total roundtrip latency greater than 500ms
  • Figure 9: Major Western markets – average percentage of requests with total roundtrip latency greater than 500ms
  • Figure 10: Major Western operators – average weighted download speed across 3G and 4G networks (Mbps)
  • Figure 11: Major European markets – average weighted download speed (Mbps)
  • Figure 12: Major Western markets – percentage of requests made on 3G and LTE
  • Figure 13: Download speed vs Percentage of LTE requests
  • Figure 14: Major Western operators – average total roundtrip latency (ms)
  • Figure 15: Major Western markets – average total roundtrip latency (ms)
  • Figure 16: MobiNEX benchmarks

Mobile app latency in Europe: French operators lead; Italian & Spanish lag

Latency as a proxy for customer app experience

Latency is a measure of the time taken for a packet of data to travel from one designated point to another. The complication comes in defining the start and end point. For an operator seeking to measure its network latency, it might measure only the transmission time across its network.

However, to objectively measure customer app experience, it is better to measure the time it takes from the moment the user takes an action, such as pressing a button on a mobile device, to receiving a response – in effect, a packet arriving back and being processed by the application at the device.

This ‘total roundtrip latency’ time is what is measured by our partner, Crittercism, via embedded code within applications themselves on an aggregated and anonymised basis. Put simply, total roundtrip latency is the best measure of customer experience because it encompasses the total ‘wait time’ for a customer, not just a portion of the multi-stage journey

Latency is becoming increasingly important

Broadband speeds tend to attract most attention in the press and in operator advertising, and speed does of course impact downloads and streaming experiences. But total roundtrip latency has a bigger impact on many user digital experiences than speed. This is because of the way that applications are built.

In modern Web applications, the business logic is parcelled-out into independent ‘microservices’ and their responses re-assembled by the client to produce the overall digital user experience. Each HTTP request is often quite small, although an overall onscreen action can be composed of a number of requests of varying sizes so broadband speed is often less of a factor than latency – the time to send and receive each request. See Appendix 2: Why latency is important, for a more detailed explanation of why latency is such an important driver of customer app experience.

The value of using actual application latency data

As we have already explained, STL Partners prefers to use total roundtrip latency as an indicator of customer app experience as it measures the time that a customer waits for a response following an action. STL Partners believes that Crittercism data reflects actual usage in each market because it operates within apps – in hundreds of thousands of apps that people use in the Apple App Store and in Google Play. This is a quite different approach to other players which require users to download a specific app which then ‘pings’ a server and awaits a response. This latter approach has a couple of limitations:

1. Although there have been several million downloads of the OpenSignal and Actual Experience app, this doesn’t get anywhere near the number of people that have downloaded apps containing the Crittercism measurement code.

2. Because the Crittercism code is embedded within apps, it directly measures the latency experienced by users when using those apps1. A dedicated measurement app fails to do this. It could be argued that a dedicated app gives the ‘cleanest’ app reading – it isn’t affected by variations in app design, for example. This is true but STL Partners believes that by aggregating the data for apps such variation is removed and a representative picture of total roundtrip latency revealed. Crittercism data can also show more granular data. For example, although we haven’t shown it in this report, Crittercism data can show latency performance by application type – e.g. Entertainment, Shopping, and so forth – based on the categorisation of apps used by Google and Apple in their app stores.

A key premise of this analysis is that, because operators’ customer bases are similar within and across markets, the profile of app usage (and therefore latency) is similar from one operator to the next. The latency differences between operators are, therefore, down to the performance of the operator.

Why it isn’t enough to measure average latency

It is often said that averages hide disparities in data, and this is particularly true for latency and for customer experience. This is best illustrated with an example. In Figure 2 we show the distribution of latencies for two operators. Operator A has lots of very fast requests and a long tail of requests with high latencies.

Operator B has much fewer fast requests but a much shorter tail of poor-performing latencies. The chart clearly shows that operator B has a much higher percentage of requests with a satisfactory latency even though its average latency performance is lower than operator A (318ms vs 314ms). Essentially operator A is let down by its slowest requests – those that prevent an application from completing a task for a customer.

This is why in this report we focus on average latency AND, critically, on the percentage of requests that are deemed ‘unsatisfactory’ from a customer experience perspective.

Using latency as a measure of performance for customers

500ms as a key performance cut-off

‘Good’ roundtrip latency is somewhat subjective and there is evidence that experience declines in a linear fashion as latency increases – people incrementally drop off the site. However, we have picked 500ms (or half a second) as a measure of unsatisfactory performance as we believe that a delay of more than this is likely to impact mobile users negatively (expectations on the ‘fixed’ internet are higher). User interface research from as far back as 19682 suggests that anything below 100ms is perceived as “instant”, although more recent work3 on gamers suggests that even lower is usually better, and delay starts to become intrusive after 200-300ms. Google experiments from 20094 suggest that a lasting effect – users continued to see the site as “slow” for several weeks – kicked in above 400ms.

Percentage of app requests with total roundtrip latency above 500ms – markets

Five key markets in Europe: France, Germany, Italy, and the UK.

This first report looks at five key markets in Europe: France, Germany, Italy, and the UK. We explore performance overall for Europe by comparing the relative performance of each country and then dive into the performance of operators within each country.

We intend to publish other reports in this series, looking at performance in other regions – North America, the Middle East and Asia, for example. This first report is intended to provider a ‘taster’ to readers, and STL Partners would like feedback on additional insight that readers would welcome, such as latency performance by:

  • Operating system – Android vs Apple
  • Specific device – e.g. Samsung S6 vs iPhone 6
  • App category – e.g. shopping, games, etc.
  • Specific countries
  • Historical trends

Based on this feedback, STL Partners and Crittercism will explore whether it is valuable to provide specific total roundtrip latency measurement products.

Contents

  • Latency as a proxy for customer app experience
  • ‘Total roundtrip latency’ is the best measure for customer ‘app experience’
  • Latency is becoming increasingly important
  • STL Partners’ approach
  • Europe: UK, Germany, France, Italy, Spain
  • Quantitative Analysis
  • Key findings
  • UK: EE, O2, Vodafone, 3
  • Quantitative Analysis
  • Key findings
  • Germany: T-Mobile, Vodafone, e-Plus, O2
  • Quantitative Analysis
  • Key findings
  • France: Orange, SFR, Bouygues Télécom, Free
  • Quantitative Analysis
  • Key findings
  • Italy: TIM, Vodafone, Wind, 3
  • Quantitative Analysis
  • Key findings
  • Spain: Movistar, Vodafone, Orange, Yoigo
  • Quantitative Analysis
  • Key findings
  • About STL Partners and Telco 2.0
  • About Crittercism
  • Appendix 1: Defining latency
  • Appendix 2: Why latency is important


  • Figure 1: Total roundtrip latency – reflecting a user’s ‘wait time’
  • Figure 2: Why a worse average latency can result in higher customer satisfaction
  • Figure 3: Major European markets – average total roundtrip latency (ms)
  • Figure 4: Major European markets – percentage of requests above 500ms
  • Figure 5: The location of Google and Amazon’s European data centres favours operators in France, UK and Germany
  • Figure 6: European operators – average total roundtrip latency (ms)
  • Figure 7: European operators – percentage of requests with latency over 500ms
  • Figure 8: Customer app experience is likely to be particularly poor at 3 Italy, Movistar (Spain) and Telecom Italia
  • Figure 9: UK Operators – average latency (ms)
  • Figure 10: UK operators – percentage of requests with latency over 500ms
  • Figure 11: German Operators – average latency (ms)
  • Figure 12: German operators – percentage of requests with latency over 500ms
  • Figure 13: French Operators – average latency (ms)
  • Figure 14: French operators – percentage of requests with latency over 500ms
  • Figure 15: Italian Operators – average latency (ms)
  • Figure 16: Italian operators – percentage of requests with latency over 500ms
  • Figure 17: Spanish Operators – average latency (ms)
  • Figure 18: Spanish operators – percentage of requests with latency over 500ms
  • Figure 19: Breakdown of HTTP requests in facebook.com, by type and size

The European Telecoms market in 2020, Report 1: Evaluating 10 forces of change

Introduction

Telecoms – the times they are a changin’

The global telecoms market is experiencing change at an unprecedented pace.  As recently as 2012 , few would have predicted that consumer voice and messaging would be effectively ‘given away’ with data packages in 2015.  Yet today, the shift towards data as the ‘valuable’ part of the mobile bundle has been made in many European markets and, although many operators still allocate a large proportion of revenue to voice and messaging, the value proposition is clearly now ‘data-led’.

Europe, in particular, is facing great uncertainty

While returns on investment have steadily reduced in European telecoms, the market has remained structurally fragmented with a large number of disparate players – fixed-only; mobile-only; converged; wholesalers; enterprise-only; content-oriented players (cablecos); and so forth. Operators generally have continued to make steady economic returns for investors and have been considered ‘defensive stocks’ by the capital markets owing to an ability to generate strong dividend yields and withstand economic down-turns (although Telefonica’s woes in Spain will attest to the limitations of the telco business model to recession).

But the forces of change in Europe are growing and, as a company’s ‘Safe Harbor’ statement would put it, ‘past performance does not guarantee future results’. Strategists are puzzling over what the European telecoms industry might look like in 2020 (and how might that affect their own company) given the broad range of forces being exerted on it in 2015.

STL Partners believes there are 12 questions that need to be considered when considering what the European telecoms market might look like in 2020:

  1. How will regulation of national markets and the wider European Union progress?
  2. How will government policies and the new EC Digital Directive impact telecoms?
  3. How will competition among traditional telecoms players develop?
  4. How strong will new competitors be and how will they compete with operators?
  5. What is the revenue and margin outlook for telecoms core services?
  6. Will new technologies such as NFV, SDN, and eSIM, have a positive or negative effect on operators?
  7. How will the capital markets’ attitude towards telecoms operators change and how much capital will be available for investment by operators?
  8. How will the attitudes and behaviours of customers – consumer and enterprise – evolve and what bearing might this have on operators’ business models?
  9. How will the vision and aspirations of telecoms senior managers play out – will digital services become a greater focus or will the ‘data pipe’ model prevail? How important will content be for operators? What will be the relative importance of fixed vs mobile, consumer vs enterprise?
  10. Will telcos be able to develop the skills, assets and partnerships required to pursue a services strategy successfully or will capabilities fall short of aspirations?
  11. What M&A strategy will telco management pursue to support their strategies: buying other telcos vs buying into adjacent industries? Focus on existing countries only vs moves into other countries or even a pan-European play?
  12. How effective will the industry be in reducing its cost base – capex and opex – relative to the new competitors such as the internet players in consumer services and IT players in enterprise services?

Providing clear answers to each of these 12 questions and their combined effect on the industry is extremely challenging because:

  • Some forces are, to some extent at least, controllable by operators whereas other forces are largely outside their control;
  • Although some forces are reasonably well-established, many others are new and/or changing rapidly;
  • Establishing the interplay between forces and the ‘net effect’ of them together is complicated because some tend to create a domino effect (e.g. greater competition tends to result in lower revenues and margins which, in turn, means less capital being available for investment in networks and services) whereas other forces can negate each other (e.g. the margin impact of lower core service revenues could be – at least partially – offset by a lower cost base achieved through NFV).

The role of this report

In essence, strategists (and investors) are finding it very difficult to understand the many and varied forces affecting the telecoms industry (this report) and predict the structure of and returns from the European telecoms market in 2020 (Report 2). This, in turn, makes it challenging to determine how operators should seek to compete in the future (the focus of a STL Partners report in July, Four strategic pathways to Telco 2.0).

In summary, the European Telecoms market in 2020 reports therefore seek to:

  • Identify the key forces of change in Europe and provide a useful means of classifying them within a simple and logical 2×2 framework (this report);
  • Help readers refine their thoughts on how Europe might develop by outlining four alternative ‘futures’ that are both sufficiently different from each other to be meaningful and internally consistent enough to be realistic (Report 2);
  • Provide a ‘prediction’ for the future European telecoms market based on the responses of two ‘wisdom of crowds’ votes conducted at a recent STL Partners event for senior managers from European telcos plus our STL Partners’ own viewpoint (Report 2).
  • Executive Summary
  • Introduction
  • Telecoms – the times they are a changin’
  • Europe, in particular, is facing great uncertainty
  • The role of this report
  • Understanding and classifying the forces of change
  • External (market) forces
  • Internal (telco) forces
  • Summary: The impact of internal and external forces over the next 5 years
  • STL Partners and Telco 2.0: Change the Game


  • Figure 1: O2’s SIM-only pay monthly tariffs – many with unlimited voice and messaging bundled in
  • Figure 2: A framework for classifying telco market forces: internal and external
  • Figure 3: Telefonica dividend yield vs Spanish 10-year bond yield
  • Figure 4: Customer attitudes to European telecoms brands – 2003 vs 2015
  • Figure 5: Summarising the key skills, partnerships, assets and culture needed to realise ambitions
  • Figure 6: SMS Price vs. penetration of Top OTT messaging apps in 2012
  • Figure 7: Summary of how internal and external forces could develop in the next 5 years

Digital Commerce: Leading Apps and Strategies for Retailers, Online Players and Telcos in the $10Bn Loyalty Market

Summary:  The advent of smartphones and tablets is disrupting the $10Bn+ loyalty market by opening up new ways for brands and retailers to engage with their customers in a highly interactive fashion.  This briefing analyses that market, why mobile is a compelling medium in it, key mobile app types, and leading edge strategies used by online players and traditional retailers. It concludes by outlining the strategies telcos need to employ to add value and exploit their assets and capabilities to play a major role in the value chain. (July 2013, Executive Briefing Service, Dealing with Disruption Stream.)

Loyalty and Mobile Venn Diagram 2013

  Read in Full (Members only)  Buy a single user license online  To Subscribe click here

Below is an extract from this 44 page Telco 2.0 Report that can be downloaded in full in PDF format by members of the Telco 2.0 Executive Briefing service and the Dealing with Disruption Stream here. Non-members can subscribe here, buy a Single User license for this report online here for £795 (+VAT for UK buyers), or for multi-user licenses or other enquiries, please email contact@telco2.net / call +44 (0) 207 247 5003.

To share this article easily, please click:


Who is this report for?

  • CxOs, strategists, marketing strategists and managers, loyalty programme managers, digital commerce and experience managers, new business development and sales people
  • In Telecoms operators and Vendors in Digital and Mobile Commerce, and in Financial Services and Online and / or ‘Bricks and Mortar’ Retail
  • More broadly, any executive or investor looking for an informed new perspective on the digital loyalty market

Key benefits

  • Better and more benchmarked decisions about your own company’s use of digital and mobile media to deliver loyalty progammes, increase loyalty and reduce churn
  • Better and more informed views about the potential needs of 3rd party digital loyalty programmes in this $10Bn + market, and how telcos in particular could address them
  • A broader understanding of the loyalty ecosystem and links to other aspects of digital commerce

Introduction

STL Partners defines Digital Commerce 2.0 as the use of new digital and mobile technology to bring buyers and sellers together more efficiently and effectively. Fast-growing usage of mobile and social networking is opening up direct communication channels for bricks-and-mortar companies that could strengthen relationships with customers and, as a result, improve both sales performance and operating efficiency.

With consumers permanently connected via mobile and social networking, leveraging the collective influence of loyal customers has never been more important. Now, more than ever, retailers are looking to facilitate information access and sharing – such as comparison tools, vouchers, personalised offers, and loyalty points – with their customers. An engaged and loyal customer base is likely to spend more and act as a ‘brand ambassador’ community for the company.

This executive briefing builds on STL Partners’ previously-published reports, Digital Commerce: Show me the Money and The Mobile Commerce Land-grab, which map out a comprehensive mobile commerce strategy and systematic approach to deploy services. In this briefing, STL Partners focuses on a specific aspect of our Digital Commerce “Wheel of Commerce”: Mobile loyalty. It explores opportunities for mobile operators to establish themselves as strong strategic position in the mobile loyalty space. In this briefing, we:

  • Define the loyalty market and explore the role of mobile technologies as an loyalty-enabler
  • Estimate the size of the loyalty market in Europe and in the U.S.
  • Identify, categorise and analyse some of the best global practices of both start-ups and Internet players, such as FidMe, Foursquare or Shopkick and well-known retailers and brands; namely Starbucks and Sephora
  • Examine how telcos can participate in the loyalty value chain
  • Highlight the key next steps for telcos to become successful in the mobile loyalty space

Market size and opportunity

The growing importance of mobile in commerce

In the mid-1990s, e-commerce platforms began disrupting the retail sector by promoting a new consumption model that gave consumers greater control and access to a wider choice of products, price comparison tools, and customer feedback information. Online players thus not only enjoyed cost advantages, but also customer experience advantages over high-street retailers.  Bricks-and-mortar players had to re-examine and re-evaluate their relationships with customers.

While mobile technology continues to create challenges for high-street players by enabling, for example, ‘show-rooming’ in which customers browse products in the store while simultaneously finding the best price for the same product online, mobile also provides the tools for a ‘high-street fight-back’.  By communicating with individual customers through the mobile channel, brands and shops have the ability to provide relevant personalised messages and offers that promote brand loyalty, as well as directly affecting purchasing behaviour.

The impact of mobile technologies on purchasing decisions is, therefore, increasing rapidly.  As well as using their handsets to buy more, consumers are also using mobile phones as a key tool for research and to make buying decisions.

Figure 1: digital buying is a multi-channel process

Consumers Take a Multi-Device Path to Purchase May 2013

Source: Google

Defining the loyalty market

We define loyalty as covering three principle activities within the ‘Retain’ section of STL Partners’ Digital Commerce ‘Wheel of Commerce (see Figure 2) – a schematic representation of all the key elements of a holistic digital commerce offering:

  • Loyalty programmes: A loyalty programme is a marketing initiative that rewards – and, therefore, encourages – loyal “buying behaviour” amongst an existing customer base. Examples of successful loyalty programmes are Tesco Clubcard and Nectar in the UK, Air Miles or AMEX cashback rewards.
  • Advocacy programmes: “Customer advocates” are customers who have a high degree of affinity or emotional equity towards a brand and will proactively talk about a brand, engage others in discussions about it, and influence people to buy a specific product and service. These ad-hoc promotional activities are usually not monitored or regulated by the brand itself. Luxury hotel chains, such as the Hilton or Carlson, are examples of brands with these kinds of advocates.
  • Brand communities: A brand community is essentially a group of ardent consumers organised around a lifestyle and the interests, activities, and ethos of the brand. Those users are “continuously” in touch with the brand and each other, not only responding to company initiatives, but also initiating and continuing conversations of their own about any aspect of the brand/business. Apple, Nike, Harley Davidson and Oracle are examples of brands, which have successfully created brand communities. Although brand communities have traditionally existed offline, the internet has strongly facilitated communication and information sharing between people. The primary difference to Advocacy programmes is that the key interactions are within the brand community as opposed to with potential new users and customers.

Things are complicated, of course, by the fact that the other sections of the ‘Wheel of Commerce’ are used in loyalty activities – customer profiling (in the plan section), offers and deals (promote), recommendations (guide), coupon redemptions and loyalty rewards (transact), and customer ratings (satisfy) are all potentially part of an effective loyalty or advocacy program.

Figure 2: STL Partners’ ‘Wheel of Commerce’
STL Partners’ ‘Wheel of Commerce’ May 2013

Source: STL Partners

A loyalty market estimated at $1.7+ billion in Europe and $9 billion in the US

For the reasons outlined above, it is not easy to size loyalty as a distinct market separate from other marketing and payment activities associated with digital commerce. 

As one benchmark, the AIMIA UK coalition estimates that £1 out of every £15 spent by UK consumers was eligible for a loyalty reward – or 6.7% of their spending. According to Payment Council, the UK spent around £312 billion in retail in 2012, so using the AIMIA UK coalition’s 6.7% estimate, this equates to a total retail value of £21 billion being eligible for loyalty schemes. Based on the major UK loyalty schemes (Tesco, Nectar), for each pound spent in retail, customers are rewarded with a penny voucher (1:100 ratio).  Therefore, the estimated UK loyalty spending by retailers in terms of rewards issued (as opposed to redeemed) is £210 million, i.e. US$325 million.

The UK loyalty marketplace is mature compared to other European countries. According to Global Vision, the UK represents 15 percent of the EU25 Purchasing Power Parity (PPP), suggesting a potential USD1.4 billion European loyalty market value.

Moreover Colloquy estimates that the perceived value of points sold to third-parties in 2011 in the US was worth $9 billion.

Figure 3: US Loyalty Market $Bns
US Loyalty Market $Bns May 2013

Sources: Colloquy, AIMIA, Payment Council, Global Vision, STL Partners
Exchange rate: £1= USD1.55

Some estimates of the value of the loyalty market are much higher. For example, Colloquy estimated the 2011 U.S. loyalty market at USD 48bn, while AIMIA has predicted that the global loyalty market will be worth USD 100bn in 2015. Those higher estimates refer to the broader loyalty market, which notably includes the transport and hospitality industries (with their popular ‘Airmiles’ type schemes). In this study, STL Partners is only considering the retail industry. Also some industry estimates include valuations relating to consumers’ perceived value of their earned and collected points, as opposed to the effective cost to the merchant, which we have used to give a more relevant comparison for players considering the business case in more depth.

Why is mobile such an important component in generating customer loyalty?

Mobile technologies open up new and creative ways for brands and retailers to interact with their target audiences. They can use the mobile channel to exchange value with their target audiences in order to generate leads, as well as on-going dialogue, which can be used, for example, to learn more about customers or to test new product and service concepts. An increasing proportion of retailers are integrating innovative mobile and digital technology into their marketing and loyalty strategy as a mean to differentiate and to fulfil customers’ needs for more personalisation, interactivity, and proximity.

Personalised shopping experiences

The relationship that retailers maintain with their customers is being reinvented. The combination of the Internet, online commerce platforms and advanced analytics tools is enabling new forms of interaction with online consumers.

Consumers are now expecting more personalised shopping experiences.  Amazon has, for example, strengthened its customer relationships by offering support across the whole customer life cycle – recommendations, purchase decision, delivery, after-sale service and customer retention.

As shoppers grow more fluent in browsing and comparing prices via smartphone, pure ‘bricks-and-mortar’ retail channels are struggling to keep pace with discount online merchants that contribute to the rise of “showrooming”, in which customers browse for products in stores and then buy them online from Amazon and other retailers for less. Such is Amazon’s confidence that it can offer prices unmatched by stores that its ‘price checker’ application is even encouraging consumers to visit bricks-and-mortar retailers to trial products before ordering them online from Amazon.

By placing the Internet in the hands of consumers all the time, mobile devices are enhancing consumers’ information and control over their shopping experience. Retailers of any kind must respond by offering competitively-priced and personalised offerings.

Effective customer engagement and interactivity

As more consumer attention and transactions move on to mobile, it is no surprise that retailers and brands see this as an increasingly important way to engage with customers.  Mobile advertising, heavily hyped between 2005 and 2007, is finally beginning to attract material budgets.  However, there has been a shift away from traditional display advertising (common on the Internet) towards more interactive forms of engagement that take advantage of mobile’s unique characteristics of immediacy and ability to influence consumers while they are out and about combined with an effective ‘return path’ – whether that be via SMS or WAP.  Moreover, the ubiquity and intrinsic characteristics of mobile phones have enabled and facilitate “on-the-go” dialogue and content sharing activities.

Retailers are now encouraging loyal customers to populate social media channels with engaging content: (Micro)-blogging sites, photo galleries, forums, polls, and videos are all examples of social communication channels that are being used by merchants and brands to interact with existing customers. It is no surprise that the battleground for Internet players that offer marketing and advertising support, such as Facebook, Google and Microsoft (Online Services division), is shifting rapidly to mobile.

Mobile increases merchant timeliness and reach

As the level of ‘marketing noise’ for consumers rises remorselessly on the Internet, merchants increasingly need to offer appropriate relevant messages at the right time. For example, product offers need to be made while consumers are in-store (and before they reach the point of sale), not while they are at home opening mail or, worse, overseas in a different time zone. Mobile does not just provide reach but, with the addition of location and presence, also allows merchants to interact with consumers efficiently at the right place and the right time.

Figure 4: Three ways mobile can support retailer and brand loyalty schemes
Three ways mobile can support retailer and brand loyalty schemes May 2013

 Source: STL Partners/Telco 2.0

To read the note in full, including the following additional analysis…

  • Two major mobile loyalty app categories
  • Physical loyalty card replacement
  • Loyalty-oriented digital commerce applications
  • Retailers’ loyalty strategies
  • Starbucks – Deepen customer relationship to drive loyalty
  • Sephora – loyalty scheme to unify its social and mobile marketing strategy
  • Where and how could telcos play in the loyalty market?
  • 1. Implement and experiment with your own loyalty programme
  • 2. Create compelling and powerful rewards
  • 3. Exploit your customer data to enable third-party businesses
  • 4. Build loyalty into m-wallet services
  • 5. Provide connectivity to deepen the communication channels between retailers and their consumers
  • What should operators do?
  • 1. Explore, Experiment and Collaborate
  • 2. Develop a compelling “in-door” coverage proposition to retailers
  • 3. Invest in customer data skills
  • About STL Partners

…and the following figures…

  • Figure 1: digital buying is a multi-channel process
  • Figure 2: STL Partners’ ‘Wheel of Commerce’
  • Figure 3: US Loyalty Market $Bns
  • Figure 4: Three ways mobile can support retailer and brand loyalty schemes
  • Figure 5: Key Ring aggregates loyalty cards within a single ‘wallet-like’ application
  • Figure 6: FidMe – a simple loyalty card scheme for local brands
  • Figure 7: Snapp’ business model
  • Figure 8: Foursquare’s SoMoLo app
  • Figure 9: Shopkick’s automated shopper rewards – ‘kicks’
  • Figure 10: Mobile Shopping Apps Average Time Spent per Month
  • Figure 11: Starbucks’ Facebook page
  • Figure 12: Starbucks’ promotional offers on Twitter
  • Figure 13: Starbucks’ Pinterest boards
  • Figure 14: Frappucino.com
  • Figure 15: Starbuck’s mobile application
  • Figure 16: Starbucks leading approach to digital loyalty
  • Figure 17: Starbucks 2000 – 2012
  • Figure 18: Sephora’s employees on Pinterest
  • Figure 19: Sephora virtual mirror application
  • Figure 20: Sephora on Passbook
  • Figure 21: “Beauty Insider” is unifying Sephora’s customer experience
  • Figure 22: Sephora 2000 – 2012
  • Figure 23: How the MinuTrade cash back programme works
  • Figure 24: MinuTrade value proposition
  • Figure 25: Value of telcos’ capabilities to retailers
  • Figure 26: How Wi-Fi fits into O2’s mobile commerce strategy
  • Figure 27: Telcos advantages to support retailer and brand loyalty activities
  • Figure 28: Relative value to telcos versus ease of implementation

Members of the Telco 2.0 Executive Briefing Subscription Service and the Dealing with Disruption Stream can download the full 44 page report in PDF format hereNon-Members, please subscribe here, buy a Single User license for this report online here for £795 (+VAT for UK buyers), or for multi-user licenses or other enquiries, please email contact@telco2.net / call +44 (0) 207 247 5003.

Technologies and industry terms referenced: 

Innovation Strategies: Telefonica 2.0 Vs. Vodafone 2.0

Summary: Telefonica and Vodafone are both European-based tier 1 CSPs with substantial revenues, cash flows and subscribers. They have both expanded beyond Europe – Vodafone into Africa and Asia and Telefonica into Latin America. However, their Telco 2.0 strategies are rather different. In this extract from our forthcoming report, A Practical Guide to Implementing Telco 2.0, we outline their Telco 2.0 strategies and their benefits and risks. (September 2012, Executive Briefing Service, Transformation Stream.)

Telefonica Strategy 2.0 Chart

  Read in Full (Members only)   To Subscribe click here

Below is an extract from this 14 page Telco 2.0 report that can be downloaded in full in PDF format by members of the Telco 2.0 Executive Briefing service and the Telco 2.0 Transformation Stream here. Non-members can subscribe here

This report is itself an edited section taken from our forthcoming strategy report, A Practical Guide to Implementing Telco 2.0We will be sharing some of the findings, and exploring them in the market context at Digital Arabia, the Telco 2.0 invitation only Executive Brainstorm taking place in Dubai, 6-7 November, in and Digital Asia in Singapore, 3-5 December, 2012. 

To find out more about any of these services, apply for an invitation to the Brainstorms, and for any other enquiries, please email contact@telco2.net / call +44 (0) 207 247 5003.

To share this article easily, please click:

Two Different Telco 2.0 Strategies

‘Full Service Telco 2.0’ Vs. Telco 2.0 ‘Happy Piper’

In our reports the ‘Roadmap to New Telco 2.0 Business Models’ and ‘A Practical Guide to Implementing Telco 2.0’, we identify two archetypal Telco 2.0 strategies: ‘Full Service Telco 2.0’; and ‘Telco 2.0 Happy Piper’.

Figure 1 – Porter and Telco 2.0 competitive strategies

Telefonica Vodafone Telco 2.0 Porter diagram Sept 2012

Source: Michael Porter / STL Partners / Telco 2.0

  • Full-Service Telco 2.0’. In this ‘two-sided’ business model, CSPs have two clear customer groups: end-users and other 3rd Party Organisations who interact with end-users (what we call ‘Upstream’ companies – banks, retailers, advertisers, government, utilities, software developers other telcos). CSPs seek to compete with each other and with others, such as the ‘internet players’, by differentiating both in the end-user services (communications, content, etc.) and with the enabling services they provide to other service providers (identity and authentication, customer targeting/marketing services, payments, customer care, and so forth).
  • The ‘Telco 2.0 Happy Piper’. CSPs that pursue this strategy will focus on retail or wholesale connectivity to upstream and/or downstream customers rather than on higher-level (value-added) services. It is worth noting that although simplicity and cost control are key themes of the ‘Telco 2.0 Happy Piper’, there remains scope for revenue growth through providing ‘enhanced connectivity’ options.

Overview: Telefonica 2.0 and Vodafone 2.0

At a top-level, Telefonica is pursuing a ‘Telco 2.0 Service Provider’ strategy whereas Vodafone, although dabbling in Telco 2.0 services, is largely committed to a defensive approach to digital services (protecting voice and messaging) and is aggressively pursuing a ‘Happy Piper’ strategy. We illustrate a qualitative assessment of where the two CSPs sit on the Happy Piper-Service Provider continuum, together with a selection of other CSPs in Figure 2.

Figure 2: Positioning CSPs on the Happy Piper – Service Provider continuum

Telefonica Vodafone Continuum diagram Sept 2012

Source: STL Partners / Telco 2.0

Telefonica: Telco 2.0 Service Provider

Background: Digital Innovator

STL Partners believes that Telefonica is arguably the most advanced operator globally in moving from traditional telecoms (Telco 1.0) to a Telco 2.0 Service Provider strategy. This belief was reinforced by the reorganisation in Autumn 2011 in which Matthew Key, the European CEO, was appointed head of a new unit, Telefonica Digital, which has the objective to build the company’s presence and value in the digital world. A press release in September 2011 summarised the objectives of the division as being:

  • To take full advantage of the opportunities afforded by the digital world with respect to new products, services and value chains, both in markets where the company operates directly and those in which it has industrial alliances or the potential to operate directly in OTT (over the top) businesses.
  • This unit will be responsible for developing and globally exploiting businesses like, among others, video and entertainment, e-advertising, e-health, financial services, cloud and M2M. It will aim its activity both at the corporate and residential segments. 
  • To actively help the two major geographic regions, Europe and Latin America, take advantage of their distinguishing traits (relationship with and proximity to more than 300 million customers, capillarity, invoicing and distribution capabilities).
  • To attain this goal, the unit will develop top-flight global competencies in the areas of business intelligence, pricing strategies and management of alliances in the digital environment with respect to both hardware (i.e. devices) and software.
  • Generate new growth opportunities by investing in new digital businesses, while grouping together or reinforcing initiatives such as Amerigo, Wayra and Vc’s.

Figure 3: Telefonica’s Telco 2.0 Service Provider strategy

Telefonica 2.0 Strategy chart Sept 2012

Source: Telefonica

Telefonica Digital is a significant development in the company’s commitment to Telco 2.0 services for three reasons:

  1. For the first time a CSP has been transparent about how much revenue it is generating from non-traditional ‘digital’ services. In 2011, Telefonica Digital generated revenue of €2.4 billion and intends to grow this by around 20% a year to reach around €5 billion in 2015.
  2. Telefonica Digital is a relatively autonomous entity with separate headquarters (in London rather than Slough) and separate product and service development capabilities. It can both leverage Telefonica’s commercial distribution capabilities (via the operating companies) and, crucially, distribute services over-the-top via app stores and the internet. Essentially, it has been given the authority to compete with the core business as an in-house ‘OTT player’.
  3. It is specifically focused on the services layer – both end-user services and enabling services for third-party service providers (including advertising and security). It will leverage Telefonica’s network where it makes sense to do so (e.g. for M2M) but will not be tied to the network if it makes sense to build OTT services (e.g. Tu Me, one of its OTT voice services, is available for non-Telefonica customers). It also seeks to buy (e.g. Terra, Tuenti), build (e.g. Priority Moments) and partner (via various models including Wayra, in which Telefonica makes seed capital available to early stage businesses).

Figure 4: Telefonica’s Telco 2.0 service portfolio

Telefonica digital innovation calendar diagram sept 2012

Source: Telefonica

To read the note in full, including the following additional sections detailing support for the analysis…

  • Telefonica’s Telco 2.0 products and services
  • Vodafone’s approach
  • Background: safety first
  • Vodafone’s Telco 2.0 services
  • Vodafone One Net: Unified Communications in the Cloud for SMBs
  • Vodafone Freebees: Retaining the Pre-pay base
  • Summary: Strategic Evaluation

…and the following figures…

  • Figure 1 – Porter and Telco 2.0 competitive strategies
  • Figure 2: Positioning CSPs on the Happy Piper – Service Provider continuum
  • Figure 3: Telefonica’s Telco 2.0 Service Provider strategy
  • Figure 4: Telefonica’s Telco 2.0 service portfolio
  • Figure 5: Vodafone – main messages are about being an efficient data pipe
  • Figure 6: Vodafone One Net – a defensive play in the SMB market
  • Figure 7: Telefonica and Vodafone Telco 2.0 strategies – evaluation

Members of the Telco 2.0 Executive Briefing Subscription Service and the Telco 2.0 Transformation Stream can download the full 14 page report in PDF format hereNon-Members, please subscribe here. For this or other enquiries, please email contact@telco2.net / call +44 (0) 207 247 5003.

Companies and Technologies Featured: Vodafone, Telefonica, O2, Priority Moments, Top-Up Surprises, Freebees, Tu Me, Tuenti, Terra, OneNet, Wayra, M2M, OTT, Jajah, Happy Piper, Full Service, Telco 2.0.

Telco 2.0: Killing Ten Misleading Myths

Summary: ‘Telco 2.0’ has evolved considerably since we put forward the original concept for telcos’ future success in 2006. Here we dispel ten myths and misunderstandings that have also evolved that can misdirect strategy. (August 2012, Executive Briefing Service, Transformation Stream.)

impact of 2sbm aug 2012

  Read in Full (Members only)   To Subscribe click here

Below is an extract from this 24 page Telco 2.0 report that can be downloaded in full in PDF format by members of the Telco 2.0 Executive Briefing service and the Telco 2.0 Transformation stream here. Non-members can subscribe here and for this and other enquiries, please email contact@telco2.net / call +44 (0) 207 247 5003.

We are about to publish a new strategy report ‘A Practical Guide to Implementing Telco 2.0‘ and will be previewing findings at the invitation only Executive Brainstorms in Dubai (November 5-7, 2012), Singapore (3-5 December, 2012), Silicon Valley (19-20 March 2013), and London (23-24 April, 2013). Email contact@stlpartners.com or call +44 (0) 207 243 5003 to order the report or find out more.

To share this article easily, please click:


Executive Summary – Killing Ten Myths

As an organisation devoted to driving innovation, Telco 2.0’s thinking has continually evolved. Today, most of our work is focused on how to implement new business models, and helping industry players develop strategies and activities to address new threats and opportunities presented by adjacent players.

We have also learned that as the thinking has evolved it has spawned some myths and misconceptions. (NB. This is not an attempt to stifle insightful criticism or debate, as intelligent challenges and critiques are essential to the development of sound strategy and well informed decision making, and we welcome such challenges.)

What matters about these myths is that they can inject a misleading or distracting idea capable of derailing balanced strategic consideration. The propagandists’ favourite weapons of ‘fear, uncertainty and doubt’ can easily and accidentally be triggered in this way. To counter this, here in summary are our ‘Telco 2.0 realities’ to what we’ve found to be the most prevalent and injurious misconceptions of Telco 2.0.

Figure 1 – Telco 2.0: Misleading Myths Vs. Realities

Misleading Myths and Realities of Telco 2.0

Source: STL Partners / Telco 2.0

Background: Telco 2.0 – then and now

When we first started the Telco 2.0 Initiative in 2006, the decline of the traditional telecoms industry business model based on voice and messaging seemed a long way off to most. ‘Broadband’ and ‘mobile data’ were still relatively immature propositions with great prospects for growing the industry further. ‘Smartphone’ was barely even a word, let alone a global phenomenon, and ‘tablets’ were what you took for a headache.

Most of our initial concepts have stood the tests of time and hindsight well. We drove for radical change in how the telecoms industry looked at:

  • Voice and messaging communications services;
  • The separation of services and network;
  • How networks would be increasingly powerful and intelligent ‘at the edge’;
  • The ongoing empowerment and participation of consumers;
  • Platforms’ that enabled new business to consumer services by re-purposing telco assets.

Subsequently, we looked at:

Next Steps

Our next action on the overall Telco 2.0 strategy agenda will to be to publish a new report: ‘A Practical Guide to Implementing Telco 2.0’. We will also presenting key findings at the Digital Arabia (Dubai, 5-7 November 2012) and Digital Asia (Singapore, 3-5 December 2012) Executive Brainstorms.

We are also launching two new services:

  • The Telco 2.0 Benchmarking Index, starting with a major report on the strategies of the top and most innovative telcos, and showing how the world’s telcos measure up to the leading standards of innovation;
  • The Telco 2.0 Innovation Scouting Service, designed to identify and evaluate, in a structured but flexible process, the best innovations for client members.  The service focuses on a full suite of revenue-generating products and services but can encompass other initiatives such as process improvements in customer care, operations etc.

To find out more about these or apply for an invitation to the Brainstorms, please email contact@stlpartners.com or call +44 (0) 207 247 5003. Additionally, we’ll be publishing major new research into Strategies in Voice and Messaging, ‘Telco Strategies in the Cloud’, and the impact and opportunities of combining personal data and digital and mobile commerce.

The rest of this report outlines the myths and their antidote realities in more depth (first two sections previewed below).

Telco 2.0 is about transforming telecoms business models

Myth 1: Telco 2.0 is just about two-sided business models

The concept of the two-sided telecoms business model has certainly had an impact on the industry, as can be seen for example in the illustrations below from Vodafone and Telefonica investor presentations.

Figure 2 – The impact of the Telco 2.0 Two-Sided Telecoms Business Model

Impact of Telco 2.0 on Investor Presentations

Source: STL Partners / Telco 2.0

While we’re pleased to see the idea of the two-sided business model propagated, there is a degree to which the idea has been a victim of its own success. It appears that some people now think that the two ideas of ‘Telco 2.0’ and ‘Two-Sided Telco Business Models’ are one and the same, and that the two-sided model is the totality of Telco 2.0.

This is not correct. While we still use the concept of the two-sided telco business model as a tool to explain how operators need to consider how they add value to consumer and enterprises and show that revenues can flow from multiple sources, ‘Telco 2.0’ is much more than this and includes:

  • Extending and enhancing existing core services – voice, messaging, data, content – to deliver more value to customers.
  • Developing bespoke communications and IT solutions for specific vertical industries.
  • Leveraging infrastructure more effectively to improve the customer experience (offer greater speed and responsiveness) while reducing cost (offloading traffic onto cheaper networks) and generating new revenue (‘onloading’ traffic from more expensive networks).
  • Distributing existing products and services via new channels and to new customers such as embedding voice within enterprise business processes or bundling connectivity in with consumer products.
  • Deploying assets including identity and authentication capabilities and customer data to both improve customers’ experience of existing core services and develop valuable new services for third-party enterprises and consumers.
  • Developing products and services that are largely ‘OTT’ – independent of the network.

STL Partners believes that business model innovation equates to business transformation.  Innovation can occur or be originated in many different ways and that each of these can have a knock-on effect through an organisation and beyond it to other organisations and industries.  Our analytical framework for business model innovation covers 5 domains (see Figure 3).

Figure 3 – Analytical framework for business model innovation

STL Partners Business Model Framework

Source: Source: Faber et al; Designing business models for mobile ICT services, 2001; adapted and developed by STL Partners

Redesigning Telco 1.0 really matters

Myth 2: Telco 1.1 isn’t part of it

Figure 4 – Existing service revenues in the UK market

Current Data Revenue Growth EMEA June 12


Source: STL Partners / Telco 2.0

To illustrate the challenges facing the existing business model, Chris Barraclough, MD and Chief Strategist, Telco 2.0 / STL Partners, presented the above example analysis of voice and data revenues from the UK market at the EMEA Brainstorm in June 2012 as a preview of analysis we are conducting across the main markets in Europe. Two-thirds of the delegates supported this analysis, with over half saying they thought this was ‘about right’ – although just under a third thought it too pessimistic. Whatever the eventual outcome in the market, there is little doubt that the existing business model is under increasing pressure across many regions and for many operators.

There is a natural temptation when presented with forecasts like this for executives to just seek out the nearest red pen and start to cut their way to profits. While a degree of cost reduction is clearly required, this cannot be the sole strategy or commoditisation and a total lack of flexibility is the only possible outcome.

It is obviously important to extend the life of the core business model, and telcos have long been adept at lobbying the regulator as a primary strategy. Further to this, both continuing to re-price data and bundle in new services are also proven strategies. But this really cannot change the game enough and telcos need to fundamentally improve the interactions they have with their customers to retain any relevance as consumer-facing entities.

We have looked at many ways in which telcos can learn how to improve their customers’ experience from the leading web and physical retailers, with Amazon as a particular case in point. This is critical both to telcos existing business and to their prospects for building new businesses. Better service / product experience design and delivery, and the use of customer data to drive personalisation and intelligence in their experiences, are key opportunities to improve customer interactions for telcos, as shown in Figure 5 – The ‘Telco 2.0 Flywheel’.

Figure 5 – The ‘Telco 2.0 Flywheel’

Telco 2 Customer Experience Flywheel

Source: STL Partners / Telco 2.0

And quality is not the only issue: the quantity of customer interactions matters too, and for many telcos the quantity is now declining. For customers it is a simple equation: experience = relevance, so if your customers start using you less, you become less relevant.  Telcos need to find new ways to interact with customers.  

To read the note in full, including the following sections detailing support for the analysis…

  • All telcos need to innovate
  • New Digital Business Models impact all global marketsTelcos need to act now
  • Some new models will create value
  • There’s more to strategy than ‘OTT’
  • Collaboration and Innovation both have roles
  • Strategy, platforms, people, and skills are the priorities
  • It’s not just a ‘Pipe Dream’

…and the following figures…

  • Figure 1 – Telco 2.0: Misleading Myths Vs. Realities
  • Figure 2 – The impact of the Telco 2.0 Two-Sided Telecoms Business Model
  • Figure 3 – Analytical framework for business model innovation
  • Figure 4 – Existing service revenues in the UK market
  • Figure 5 – The ‘Telco 2.0 Flywheel’
  • Figure 6 – Optimism in APAC
  • Figure 7 – Time remaining on key strategic control points
  • Figure 8 – Different Business Models need Different Metrics
  • Figure 9 – The six opportunity areas have different models
  • Figure 10 – ‘Under The Floor’ Pressures
  • Figure 11 – Six Telco 2.0 implementation strategies
  • Figure 12 – Telcos need new skills, systems, structures and incentives
  • Figure 13: The STL Partners 12-stage innovation development and launch process
  • Figure 14: A non-exhaustive collection of Telefonica’s Telco 2.0 projects
  • Figure 15: Vodafone – from splendid isolation in 2005 to local collaborator in 2011

Members of the Telco 2.0 Executive Briefing Subscription Service and the Telco 2.0 Transformation stream can download the full 24 page report in PDF format hereNon-Members, please subscribe here. For this or other enquiries, please email contact@telco2.net / call +44 (0) 207 247 5003.

Companies and Technologies Featured: ISIS, E5, Oscar, 4T Sverige, Vodafone, Telenor, Telefonica, Singtel, O2, Priority Moments, Top-Up Surprises.

Public Wifi: Destroying LTE/Mobile Value?

Summary: By building or acquiring Public WiFi networks for tens of $Ms, highly innovative fixed players in the UK are stealthily removing $Bns of value from 3G and 4G mobile spectrum as smartphone and other data devices become increasingly carrier agnostic. What are the lessons globally?

Below is an extract from this 15 page Telco 2.0 Analyst Note that can be downloaded in full in PDF format by members of the Telco 2.0 Executive Briefing service and Future Networks Stream using the links below.

Read in Full (Members only)        To Subscribe

The mobile broadband landscape is a key session theme at our upcoming ‘New Digital Economics’ Brainstorm (London, 11-13 May). Please use the links or email contact@telco2.net or call +44 (0) 207 247 5003 to find out more.

To share this article easily, please click:

//

Two recent announcements have reignited interest in the UK Public WiFi space: Sky buying The Cloud for a reputed figure just short of £50m and Virgin Media announcing their intention to invest in building a metro WiFi network based around their significant outdoor real estate in the major conurbations.

These can be seen narrowly as competitive reactions to the success of the BT Openzone public WiFi product, which is a clear differentiator for the BT home broadband offer in the eyes of the consumer. The recent resurgence of BT market share in the home broadband market hints that public WiFi is an ingredient valued by consumers, especially when the price is bundled into the home access charges and therefore perceived as “free” by the consumer.

This trend is being accelerated by the new generation of Smartphones sensing whether private and public WiFi access or mobile operator network access offer the best connection for the end-user and then making the authentication process much easier. Furthermore, the case of the mobile operators is not helped by laptops and more importantly tablets and other connected devices such as e-readers offering WiFi as a default means of access with mobile operator 3G requiring extra investment in both equipment and access with a clumsy means of authentication.

In a wider context, the phenomena should be extremely concerning for the UK mobile operators. There has been a two decade trend of voice traffic inside the home moving from fixed to mobile networks with a clear revenue gain for the mobile operators. In the data world, it appears that the bulk of the heavy lifting appears to being served within the home by private WiFi and outside of the home in nomadic spots served by public WiFi.

With most of the public WiFi hotspots in the UK being offered by fixed operators, there is a potential value shift from mobile to fixed networks reversing that two decade trend. As the hotspots grow and critically, once they become interconnected, there is an increasing risk to mobile operators in terms of the value of investment in expensive ‘4G’ / LTE spectrum.

Beyond this, a major problem for mobile operators is that the current trend for multi-mode networking (i.e. combination of WiFi and 3G access) limits the ability of operators to provide VAS services and/or capture 2-sided business model revenues, since so much activity is off-network and outside of the operator’s control plane.

The history of WiFi presents reality lessons for Mobile Operators, namely:

  • With Innovation, it not always the innovators who gain the most;
  • Similarly, with Standards setting, it not always the people who set the standards who gain the most; and
  • WiFi is a classic case of Apple driving mass adoption and reaping the benefits – to this day, Apple still seems to prefer WiFi over 3G.

This analyst note explains the flurry of recent announcements in the context of:

  • The unique UK market structure;
  • Technology Adoption Cycles;
  • How intelligence at the edge of the network will drive both private and public WiFi use;
  • How public WiFi in the UK might evolve;
  • The longer term value threat to the mobile operators;
  • How O2 and Vodafone are taking different strategies to fight back; and
  • Lessons for other markets.

Unique Nature of the UK Market Structure

In May 2002, BT Cellnet, the mobile arm of BT, soon to be renamed O2, demerged from BT leaving the UK market as one of few markets in the world where the incumbent PTT did not have a mobile arm. Ever since BT has tried to get into the mobility game with varying degrees of success:

  • In the summer of 2002, it launched its public WiFi service called OpenZone;
  • In September 2003 it announced plans for WiFi in all public phone boxes ;
  • In May 2004, it launched an MVNO with Vodafone with plans for the doomed BT Fusion UMA (Bluetooth then WiFi ) phone;
  • In May 2006, with Metro WiFi plans in partnership with local authorities in 12 cities; and
  • In Oct 2007, in partnership with FON to put public WiFi in each and every BT home routers.

After trying out different angles in the mobility business for five years, BT finally discovered a workable business model with public WiFi around the FON partnership. BT now effectively bundle free public WiFi to its broadband users in return for establishing a public hotspot within their own home.

Huge Growth in UK Public Wifi Usage

Approximately 2.6m or 47% customers of a total of 5.5m BT broadband connections have taken this option. This creates the image of huge public WiFi coverage and clearly currently differentiates BT from other home broadband providers. And, the public WiFi network is being used much more: 881 million minutes in the current quarter compared to 335 million minutes in the previous year.

The other significant element of the BT public WiFi network is the public hotspots they have built with hotels, restaurants, airports. The hotspots number around 5k, of which 1.2k are wholesale arrangements with other public WiFi hotspot providers. While not significant in number, these provide the real incremental value to the BT home broadband user who can connect for “free” in these high traffic locations.

BT was not alone in trying to build a public WiFi business. The Cloud was launched in the UK in 2003 and tried to build a more traditional public WiFi business building upon a combination of direct end user revenues and wholesale and interconnect arrangements. That Sky are paying “south of £50m” for The Cloud compared to the “€50m invested” over the years by the VC backers implies the traditional public WiFi business model just doesn’t work. A different strategy will be taken by Sky going forward.

Sky is the largest pay-tv provider in the UK currently serving approximately 10m homes by satellite DTH. In 2005, Sky decided upon a change of strategy and decided that in addition to offering its customers video services, they needed to offer broadband and phone services. Sky has subsequently invested approximately £1bn in buying an altnet, Easynet, for £211m, in building a LLU network on top of BT infrastructure and acquiring 3m broadband customers. If the past is anything to go by, Sky will be planning on investing considerable further sums in The Cloud to make it at a minimum a comparable service to BT Openzone for its customers.

Virgin Media is the only cable operator of any significance in the UK with a footprint of around 50% of the UK mainly in the dense conurbations. Virgin Media is the child of many years of cable consolidation and historically suffered from disparate metro cable networks of varying quality and an overleveraged balance sheet. The present management has a done a good job of tidying up the mess and upgrading the networks to DOCSIS 3.0 technology. In the last year, Virgin Media has started to expand its footprint again and investing in new products with plans for building a metro WiFi network based around its large footprint of cabinets in the street.

Virgin Media has a large base of 4.3m home broadband users to protect and an even larger base of potential homes to sell services into. In addition, Virgin Media is the largest MVNO in the UK with around 3m mobile subscribers. In recent years, Virgin Media have focused upon selling mobile services into their current cable customers. Although, Virgin Media’s public WiFi strategy is not in the public domain, it is clear that they plan on investing in 2011.

TalkTalk is the only other significant UK Home Broadband player with 4.2m home broadband users and currently has no declared public WiFi strategies.

The mobile operators which have invested in broadband, namely O2 and Orange, have failed to gain traction in the marketplace.

The key trend here is that the fixed broadband network providers are moving outside of the home and providing more value to their customers on the move.

Technology Adoption Cycles

Figure 1: Geoffrey Moore’s Technology Adoption Cycle

Geoffrey Moore documented technology adoption cycles, originally in the “Crossing the Chasm” book and subsequently in the “Living in the Fault Line” book. These books described the pain in products crossing over from early adopters to the mass market. Since publication, they have established themselves as the bible for a generation of Technology marketers. Moore distinguishes six zones, which are adopted to describe the situation of public WiFi in the UK.

  1. The early market: a time of great excitement when visionaries are looking to get on board. In the public WiFi market this period was clearly established in mid-2005 era when public WiFi networks where promoted as real alternatives to private MNOs.
  2. The chasm: a time of great despair as initial interest wanes and the mainstream is not comfortable with adoption. The UK WiFi market has been stagnating for the previous few years as investment in public WiFi has declined and customer adoption has not accelerated beyond the techno-savvy.
  3. The bowling alley: a period of niche adoption ahead of the general marketplace. The UK market is currently in this period. The two key skittles to fall were the BT FON deal changing the public WiFi business model, and the launch of the iPhone with auto-sensing and easy authentication of public WiFi.
  4. The tornado: a period of mass-market adoption. The UK market is about to enter in this phase as public WiFi investment is reinvigorated deploying providing “bundled” access to most home broadband users.
  5. Main street: Base infrastructure has been deployed and the goal is to flesh out the potential. We are probably a few years away from this and this phase will focus on ease-of-use, interconnect of public WiFi networks, consolidation of smaller players and alternate revenue sources such as advertising.
  6. Total Assimilation: Everyone is using the technology and the market is ripe for another wave of disruption. For UK WiFi, this is probably at least a decade away, but who know what the future holds?

Flashback: How Private WiFi crossed the Chasm

It is worthwhile at this point to revisit the history of WiFi as it provides some perspective and pointers for the future, especially who the winners and losers will be in the public WiFi space.

Back in 1985 when deregulation was still in fashion, the USA FCC opened up some spectrum to provide an innovation spurt to US industry under a license exempt and “free-to-use” regime. This was remarkable in itself given that previously spectrum, whether for radio and television broadcasting or public and private communications, had been exclusively licensed. Any applications in the so-called ISM (Industrial, Scientific and Medical) bands would have to deal with contention from other applications using the spectrum and therefore the primary use was seen as indoor and corporate applications.

Retail department stores, one of the main clients of NCR (National Cash Registers), tended to reconfigure their floor space on a regular basis and the cost of continual rewiring of point-of-sales equipment was a significant expense. NCR saw an opportunity to use the ISM bands to solve this problem and started a R&D project in the Netherlands to create wireless local area networks which required no cabling.

At this time, the IEEE were leading the standardization effort for local area networks and the 802.3 Ethernet specification initially approved in 1987 still forms the basis of the most wired LAN implementations today. NCR decided that the standards road was the route to take and played a leading role in the eventual creation of 802.11 wireless LAN standards in 1997. Wireless LAN was considered too much of a mouthful and was reinvented as WiFi in 1999 with the help of a branding agency.

Ahead of the standards approval, NCR launched products under the WaveLAN brand in 1990 but the cost of the plug-in cards at US$1,400 were very expensive compared to the wired ethernet cards which were priced at around US$400. Product take-up was slow outside of early adopters.

In 1991 an early form of Telco-IT convergence emerged as AT&T bought NCR. An early competitor for the ISM bandwidth emerged with AT&T developing a new generation of digital cordless phones using the 2.4GHz band. To this day, in the majority of UK and worldwide households, DECT handsets in the home compete with WiFi for spectrum. Product development of the cards continued and was made consumer friendly easier with the adoption on the PCMIA card slots in PCs.

By 1997, WiFi technology was firmly stuck in the chasm. The major card vendors (Proxim, Aironet, Xircom and AT&T) all had non-standardized products and the vendors were at best marginally profitable struggling to grow the market.
AT&T had broken up and the WiFi business became part of Lucent Technologies. The eyes and brains of the big communications companies (Alcatel, Ericsson, Lucent, Motorola, Nokia, Nortel and Siemens) were focused on network solutions with 3G holding the promise for the future.

All that was about to change in early 1998 with a meeting between Steve Jobs of Apple and Richard McGinn, CEO of Lucent:

  • Steve Jobs declared “Wireless LANs are the greatest thing on earth, Apple wants a radio card for US$50, which Apple will retail at US$99”;
  • Rich McGinn declared 1999 to be the year of DSL and asked if Apple would be ready; and
  • Steve Jobs retort was revealing to this day “Probably not next, maybe the year after; depends upon whether there is one standard worldwide”.

Figure 2: The Apple Airport

In early 1998 the cost of the cards was still above US$100 and needed a new generation of chips to bring the cost down to the Apple price point. Further, Apple wanted to use the 11Mbit/s standard which had just been developed rather than the current 2Mbit/s. However, despite the challenges the product was launched in July 1999 as the Apple Airport with the PCMCIA card at US$99 and the access point at US$299. Apple was the first skittle to fall as private WiFi crossed the chasm. The Windows based OEMs rushed to follow.

By 2001, Lucent had spun out its chip making arm as Agere Systems which had a market share of 50% of a US$1bn WiFi market, which would have been nothing but a pin prick on either the AT&T or Lucent profit and loss had Agere remained as part of them.

The final piece in the WiFi jigsaw fell into place when Intel acquired Xircom in 1999 and developed the Xircom technology and used their WiFi patents as protection against competitors. In 2003, Intel launched its Centrino chipset with built in WiFi functionality for laptops supported by a US$300m worldwide marketing campaign. Effectively for the consumer WiFi had become part the laptop bundle.

Agere Systems and all its WiFi heritage was finished and they discontinued its WiFi activities in 2004.

There are three clear pointers for the future:

  • The players who take a leading role in the early market will not necessary be the ones to succeed in Main Street;
  • Apple took a leading role in the adoption of WiFi and still seems massively committed to WiFi technology to this day;
  • Technology adoption cycles tend to be longer than expected.

Intelligence at the edge of the Network

As early as 2003, Broadcom and Phillips were launching specialized WiFi chips aimed at mobile phones. Several cellular handsets were launched with WiFi combined with 2G/3G connectivity, but the connectivity software was clunky for the user.

The launch of the iPhone in 2007 began a new era where the device automatically attempts to connect to any WiFi network if the signal strength is better than the 2G/3G network. The era of the home or work WiFi network being the preferred route for data traffic was ushered in.

Apple is trying to make authentication as simple as possible: enter the key for any WiFi network once and it will be remembered for the handset’s lifetime and connect automatically when a user returns in range. However, in dense urban networks with multiple WiFi access points, it is quite annoying to be prompted for key after key. The strength of the federated authentication system in cellular networks is therefore still a critical advantage.

The iPhone also senses that some applications can only be used when WiFi connections are available. The classic example is Apple’s own Facetime (video calling) application. Mobile Operators seem happy in the short run that bandwidth intensive applications are kept off their networks. But, there is a longer term value statement with the users being continually being reminded that WiFi networks are superior to mobile operators’ networks.

Other mobile operating systems, such as Android and Windows Phone 7, have copied the Apple approach and today there is no going back: multi-modal mobile phones are here to stay and the devices themselves decide which network to use unless the user over-rides this choice.

One of underlying rules of the internet is that intelligence moves to the edge of the network. The edges are probably in the eyes of Apple and Google the handsets and their server farms. It is not beyond the realms of possibility that future Smartphones will be supplied with automatic authentication for both WiFi and Cellular networks with least-cost routing software determining the best price for the user. As intelligence moves to the edge so does value.

Public WiFi Hotspots – the Business Model challenges

The JiWire directory estimates that there are c. 414k public WiFi locations across the globe at the end of 2010, and there are WiFi hotspots currently located 26.5k in the UK. Across the globe, there is a shift from a paid-for model to a free-model with the USA being top of the free chart with 54% of public WiFi locations being free.

For a café chain offering free access to WiFi is a good model to follow. The theory is that people will make extra visits to buy a coffee just to check their email or some other light internet visit. Starbucks started the trend by offering free WiFi access, all the rest felt compelled to follow. Nowadays, all the major chains whether Costa Coffee, Café Nero and even McDonalds offer free WiFi access provided by either BT Openzone or Sky’s The Cloud. A partnership with a public WiFi provider is perfect as the café chain doesn’t have to provide complicated networking support or regulatory compliance. The costs for the public WiFi provider are relativity small especially if they are amortized across a large base of broadband users.

For hotels and resorts, the business case is more difficult as most hotels are quite large and multiple access points are required to provide decent coverage to all rooms. Furthermore, hotels traditionally have made additional revenues from most services and therefore complexity is added with billing systems. For most hotels and resorts a revenue share agreement is negotiated with the WiFi service provider.

For public places, such as airports and train stations, the business case is also complicated by the owners knowing these sites are high in footfall and therefore demand a premium for any activity whether retail or service based. It is a similar problem that mobile operators face when trying to provide coverage in major locations: access to prime locations is expensive. In the UK, the entry of Sky into the public WiFi and its long association with Sports brings an intriguing possible partnership with the UK’s major venues.

These three types of locations currently account for 75% of current public WiFi usage according to JiWire.

To read the rest of the article, including:

  • How will UK Public WiFi Evolve?
  • Challenge to Mobile Operators
  • O2 Tries an Alternative
  • Vodafone Goes with Femtos
  • Lessons for Other Markets

Members of the Telco 2.0TM Executive Briefing Subscription Service and Future Networks Stream can access and download a PDF of the full report here. Non-Members, please see here for how to subscribe. Alternatively, please email contact@telco2.net or call +44 (0) 207 247 5003 for further details. ‘Growing the Mobile Internet’ and ‘Lessons from Apple: Fostering vibrant content ecosystems’ are also featured at our AMERICAS and EMEA Executive Brainstorms and Best Practice Live! virtual events.