Lessons from AT&T’s bruising entertainment experience

How AT&T entered and exited the media business

AT&T enters the satellite market at its peak

In 2014, AT&T announced it was buying DirecTV. By that time, AT&T was already bundling DirecTV with its phone and internet service and had approximately 5.9 million linear pay-TV (U-Verse) video subscribers. However, this pay-TV business was already experiencing decline, to the extent that when the DirecTV merger completed in mid-2015, U-Verse subscribers had fallen to 5.6 million by the end of that year.

With the acquisition of DirecTV, AT&T went from a small player in the media and entertainment industry to one of the largest media players in the world adding 39.1 million (US and Latin American) subscribers and paying $48.5bn ($67bn including debt) to acquire the business. The rationale for this acquisition (the satellite business) was to compete with cable operators by being able to offer broadband, increasing AT&T’s addressable market beyond its fibre-based U-Verse proposition which was only available in certain locations/states.

AT&T and DirecTV enjoyed an initial honeymoon, period recording growth up until the end of 2016 when DirecTV subscribers peaked at just over 21 million in the US.

From this point onwards however, AT&T’s satellite subscribers went into decline as customers switched to cheaper competitor offers as well as online streaming services. The popularity of streaming services was reflected by moves among traditional media players to develop their own streaming services such as Time Warner’s HBO GO and HBO NOW. In 2015, DirectTV’s satellite competitor Dish TV likewise launched its own streaming service Sling TV.

Even though it was one of the largest TV distributors on a satellite platform, AT&T also believed online streaming was its ultimate destination. Prior to the launch of its streaming service in late 2016, Bloomberg reported that AT&T envisioned DirecTV NOW as its primary video platform by 2020.

A softwarised platform delivered lowered costs as the service could be self-installed by customers and didn’t rely on expensive truck roll installation or launching satellites. The improved margins would enable AT&T to promote TV packages at attractive price points which would balance inflation demands from broadcasters for the cost of TV programming. AT&T could also more easily bundle the softwarised TV service with its broadband, fibre and wireless propositions and earn more lucrative advertising revenue based on its own network and viewer insights.

Enter your details below to request an extract of the report

The beginnings of a bumpy journey in TV

AT&T’s foray into satellite and streaming TV can be characterised by a series of confusing service propositions for both consumers and AT&T staff, expensive promotional activity and overall pricing/product design misjudgements as well as troubled relations with TV broadcasters resulting in channel blackouts and ultimately churn.

Promotion, pull back and decline of DirecTV NOW

DirectTV NOW launched in November 2016, as AT&T’s first over the top (OTT) low cost online streaming service. Starting at $35 per month for 60+ channels with no contract period, analysts called the skinny TV package as a loss leader given the cost of programming rights and high subscriber acquisition costs (SACs). The loss leader strategy was aimed at acquiring wireless and broadband customers and included initiatives such as:

  • Promotional discounts to its monthly $60 mid-tier 100+ channel package reduced to $35 per month for life (subject to programming costs).
  • Device promotions and monthly waivers. The service eventually became available on popular streaming devices (Roku, Xbox and PlayStation) and included promotions such as an Apple TV 4K with a four month subscription waiver, a Roku Streaming Stick with a one month waiver or a $25 discount on the first month.
  • Customers could also add HBO or Cinemax for an additional $5 per month, which again was seen as a costly subsidy for AT&T to offer.

The service didn’t include DirecTV satellite’s popular NFL Sunday Ticket programming as Verizon held the smartphone rights to live NFL games, nor did it come with other popular shows from programme channels such as CBS. Features such as cloud DVR (digital video recording) functionality were also initially missing, but would follow as AT&T’s TV propositions and functionalities iterated and improved over time.

The DirecTV NOW streaming service enjoyed continuous quarterly growth through 2017 but peaked in Q3 2018 with net additions turning immediately negative in the final quarter of 2018 as management pulled back on costly promotions and discounted pricing.

The proposition became unsustainable financially in terms of its ability to cover rising programming costs and was positioned comparatively as a much less expensive service to its larger DirecTV satellite pay-TV propositions.

The DirecTV satellite service sold some of the most expensive TV propositions on the market and reported higher pay-TV ARPU ($131) than peers such as Dish ($89) and Comcast ($86) in Q4 2019.

  • The launch of a $35 DirecTV NOW streaming service with no contract and with a similar sounding name to the full linear service confused both new and existing DirecTV satellite customers and some would have viewed their satellite package as expensive compared to the cheaper steaming option.

Rising programming costs

AT&T’s low-cost skinny TV packages brought them into direct confrontation with TV programmers in terms of negotiating fees for content. When the streaming service launched, analysts highlighted the channels within AT&T’s base package were expected to rise in price annually by around 10% each year and this would eventually require AT&T to eventually balance programming costs with rising monthly package pricing.

Confrontations with programmers included a three-week dispute with CBS and an eight week dispute with Nexstar in 2019, which resulted in a blackout of both CBS and Nexstar channels across AT&T’s TV platforms such as Direct TV, U-Verse, DirectTV NOW. Commenting on the blackouts in Q3 2019, Randall Stephenson noted there were “a couple of significant blackouts in terms of content, and those blackouts drove some sizable subscriber losses”.

AT&T’s confrontation with content owners may have been a contributory reason to consider acquiring a content creation platform of its own in the form of Time Warner.

In mid-2018, as AT&T withdrew promotions and discounts for DirecTV NOW (later rebranded it to AT&T TV NOW), customers began to drop the OTT TV service.

  • AT&T TV NOW went from a peak of 1.86 million subscribers in Q3 2018 to 656,000 at the end of 2020.

DirecTV NOW subscriptions

DirecTV-subs-AT-T-stlpartners

Source: STL Partners, AT&T Q2 Earnings 2021

Name changes and new propositions create more confusion

In 2019, DirecTV NOW was re-branded to AT&T TV NOW , and continued to be promoted as a skinny bundle operating alongside AT&T TV, a new full fat live TV streaming version of the DirecTV satellite TV proposition. AT&T TV  was first piloted in August 2019 and soft launched in November 2019. The AT&T TV service included an Android set-top box with cloud DVR functionality and supported other apps such as Netflix.
AT&T TV required a contract period and offered pricing (once promotional discount periods ended) resembling a linear pay-TV service, i.e. $90+. This was, in effect, the very type of pay-TV proposition customers were abandoning.
AT&T TV was seen as an ultimate replacement for the satellite business based on the advantages a softwarised platform provided and the ability to bundle it with AT&T broadband, fibre and wireless services.

Confusion amongst staff and customers

The new AT&T TV proposition confused not only customers but also AT&T staff, as they were found mixing up the AT&T TV proposition with the skinny AT&T TV NOW proposition. By 2019 the company diverted its attention away from AT&T TV NOW  pulling back on promotional activity in order to focus on its core AT&T TV live TV service.

According to Cord Cutters News, both services used the same app but remained separate services. AT&T’s app store marketing incorrectly communicated the DirectTV NOW service was now AT&T TV when in fact it was AT&T TV NOW. Similarly, technical support was also incorrectly labelled with online navigation sending customers to the wrong support channels.

AT&T’s own customer facing teams misunderstood the new propositions

DirecTV-Cordcutter-news

Source: Cord Cutters News

Withdrawal of AT&T TV NOW

By January 2021, AT&T TV NOW was no longer available to new customers but continued to be available to existing customers. The AT&T TV proposition, which was supposed to offer “more value and simplicity” was updated to include some features of the skinny bundle such as the option to go without an annual contract requirement. Customers were also not required to own the set-top box but could instead stream over Amazon Fire TV or Apple TV.  In terms of pricing, AT&T TV was twice the price of the originally launched DirecTV NOW proposition costing $70 to $95 per month.

The short life of AT&T Watch TV

In April 2018, while giving testimony for AT&T’s merger with Time Warner, AT&T’s then CEO Randall Stephenson positioned AT&T Watch TV as a potential new low-cost service that would benefit consumers if the merger was successful. Days following AT&T’s merger approval in the courts, the low cost $15 per month, ultra-skinny bundle launched as a suitable low-cost cord-cutter/cord-never option for cable, broadband and mobile customers from any network. The service was also free to select AT&T Unlimited mobile customers.

By the end of 2018, the operator claimed it had 500,000 AT&T Watch TV“established accounts”. By the end of 2019 the operator had updated its mobile tariffs removing Watch TV for new customers subscribing to its updated Unlimited mobile tariffs. Some believed the company didn’t fully commit to the service, referring to the lack of roll out support for streaming devices such as Roku. The operator was now committed to rolling out its new service HBO Max in 2020. AT&T has informed Watch TV subscribers the service will close 30 November 2021.

Timeline of AT&T entertainment propositions

AT-T-Timeline-Entertainment

Source: STL Partners

The decline of DirecTV

As the graphic belowshows, in June 2021 there were 74.3 million pay-TV households in the US, reflecting continued contraction of the traditional pay-TV market supplied by multichannel video programming distributor (MVPD) players such as cable, satellite, and telco operators. According to nScreenMedia, traditional pay-TV or MVPD market lost 6.3 and 6.2 million customers over 2019 and 2020, but not all were cord-cutters. Cord-shifters dropped their pay-TV but shifted across to virtual MVPD (vMVPD) propositions such as Hulu Live, Sling TV, YouTube TV, AT&T TV NOW, Fubo TV and Philo. Based on current 2021 cord-cutting levels, nScreenMedia predicts 2021 will be the highest year of cord-cutting yet.

Decline in traditional pay-TV households

pay-tv-decline-nscreenmedia

Source: nScreenMedia, STL Partners

Satellite subscribers to Dish and DirecTV 2015-2020

Satellite-pay-tvdish-nscreenmedia

Source: nScreenMedia, STL Partners

When considering AT&T’s management of DirecTV, nScreenMedia research shows the market number of MVPD subscribers declined by over 20 million between 2016 and 2020. In that time, DirecTV lost eight million subscribers. While it represented 20% of the MVPD market in 2016, DirecTV accounted for 40% of the pay-TV losses in the market (40% of 20 million equals ~8 million). AT&T’s satellite rival Dish weathered the decline in pay-TV slightly better over the period.

  • In Q4 2020 the operator wrote down $15.5bn on its premium TV business, which included DirecTV decline, to reflect the cord cutting trend as customers found cheaper streaming alternatives online. The graphic (below) shows a loss of 8.76 million Premium TV subscribers between 2017 and 2020 with large losses of 3.4 million and 2.9 million subscribers in 2019 and 2020.

AT&T’s communications business has also been enduring losses in legacy voice and data (DSL) subscriptions in recent years. AT&T has used a bundling strategy for both products. As customers switched to AT&T fibre or competitor broadband offerings this also impacted the video subscription.

Table of contents

  • Executive Summary
    • What can others learn from AT&T’s experience?
  • How AT&T entered and exited the media business
    • AT&T enters the satellite market at its peak
    • The beginnings of a bumpy journey in TV
    • Vertical integration strategy: The culture clash
    • AT&T’s telco mindset drives its video strategy
    • HBO MAX performance
  • The financial impact of AT&T’s investments
    • Reversing six years of strategic change in three months
  • Lessons from AT&T’s foray into media

Related Reports

Enter your details below to request an extract of the report


A3 in customer experience: Possibilities for personalisation

The value of A3 in customer experience

This report considers the financial value to a telco of using A3 technologies (analytics, automation and AI) to improve customer experience. It examines the key area which underpins much of this financial value – customer support channels – considering the trends in this area and how the area might change in future, shaping the requirement for A3.

Calculating the value of improving customer experience is complex: it can be difficult to identify the specific action that improved a customer’s perception of their experience, and then to assess the impact of this improvement on their subsequent behaviour.

While it is difficult to draw causal links between telcos’ A3 activities and customer perceptions and behaviours, there are still some clearly measurable financial benefits from these investments. We estimate this value by leveraging our broader analysis of the financial value of A3 in telecoms, and then zooming in on the specific pockets of value which relate to improved customer experience (e.g. churn reduction).

Enter your details below to request an extract of the report

The diagram below illustrates that there are two parts of the customer journey where A3 will add most value to customer experience:

  1. The performance of the network, services, devices and applications is increasingly dependent on automation and intelligence, with the introduction of 5G and cloud-native operations. Without A3 capabilities it will be difficult to meet quality of service standards, understand customer-affecting issues and turn up new services at speed.
  2. The contact centre remains one of the largest influencers of customer experience and one of the biggest users of automation, with the digital channels increasing in importance during the pandemic. Understanding the customer and the agent’s needs and providing information about issues the customer is experiencing to both parties are areas where more A3 should be used in future.

Where is the financial benefit of adding A3 within a typical telco customer journey?

A3 customer experience

Source: STL Partners, Charlotte Patrick Consult

As per this diagram, many of the most valuable uses for A3 are in the contact centre and digital channels. Improvements in customer experience will be tied with trends in both. These priority trends and potential A3 solutions are outlined the following two tables:
• The first shows contact centre priorities,
• The second shows priorities for the digital channels.

Priorities in the contact centre

A3 Contact centre

Priorities in the digital channel

A3 Digital channel

Table of Contents

  • Executive Summary
  • The value of A3 in customer experience
  • Use of A3 to improve customer experience
  • The most important uses of A3 for improving the customer experience
    • Complex data
    • Personalisation
    • Planning
    • Human-machine interaction
    • AI point solution
  • Conclusion
  • Appendix: Methodology for calculating financial value
  • Index

Related Research:

Enter your details below to request an extract of the report

Telco NFV & SDN Deployment Strategies: Six Emerging Segments

Introduction

STL Partners’ previous NFV and SDN research

This report continues the analysis of three previous reports in exploring the NFV (Network Functions Virtualization) and SDN (Software Defined Networking) journeys of several major telcos worldwide, and adds insights from subsequent research and industry discussions.

The first two reports that STL Partners produced contained detailed discussion of the operators that have publicly engaged most comprehensively with NFV: Telefónica and AT&T.

Telefónica embarked on an ambitious virtualization program, dubbed ‘UNICA’, toward the start of 2014; but its progress during 2014 and 2015 was impeded by internal divisions, lack of leadership from top management, and disagreement over the fundamental technology roadmap. As a result, Telefónica has failed to put any VNFs (Virtualized Network Functions) into production; although it continues to be a major contributor to industry efforts to develop open NFV standards.

By contrast, AT&T’s virtualization program, the User-Defined Network Cloud (UDNC) – launched at the same time as Telefónica’s, in February 2014 – has already contributed to a substantial volume of live NFV deployments, including on-demand networking products for enterprise customers and virtual EPC (Enhanced Packet Core) supporting mobile data and connected car services. AT&T’s activities have been driven from board level, with a very focused vision of the overall transformation that is being attempted – organizational as much as technological – and the strategic objectives that underlie it: those of achieving the agility, scalability and cost efficiency required to compete with web-scale players in both enterprise and consumer markets.

The third report in the series – ‘7 NFV Hurdles: How DTAG, NTT, Verizon, Vodafone, Swisscom and Comcast have tackled them’  – extended the analysis to the SDN and NFV deployment efforts of several other major operators. The report arrived at a provisional model for the stages of the SDN / NFV transformation process, outlined in Figure 1 below.

Figure 1: The SDN-NFV Transformation Process

The transformation process outlined in the chart suggests that elaborating the overall SDN architecture should ideally precede the NFV process: logically if not always chronologically. This is because it is essential to have a vision of the ‘final’ destination, even if – or especially as – operators are navigating their way through a shifting myriad of technology choices, internal change programs, engagements with vendor and open-source ecosystems, priorities and opportunities for virtualization, legacy system migration models, and processes for service and business remodeling.

The focus of this report

This report re-examines some of the analysis undertaken on the players above, along with some additional players, to derive a more fine-grained understanding of the virtualization journeys of different types of telco.

We examine these journeys in relation to five dimensions and the analysis focuses on the choices operators have made in these areas, and how things have turned out so far. This, in turn, allows us to pinpoint six telco segments for SDN and NFV deployment.

There is no ‘one size fits all’ approach to SDN and NFV. However, because the operators we examine have a similar rationale for engaging in SDN- and NFV-led transformation and display sufficient commonality in their approach to deployment, STL Partners has been able to make three core best-practice implementation recommendations.


  • Executive summary
  • Contents
  • Introduction
  • STL Partners’ previous NFV and SDN research
  • The focus of this report
  • Virtualization journeys: 6 telco segments
  • The Story So Far: AT&T and Telefónica
  • ‘NFV Business Model Transformation Pioneers’: BT, China Mobile, NTT and Verizon
  • ‘Smart Piper Incumbent’: AT&T and Deutsche Telekom
  • ‘Fly Blind Incumbent’: Telefónica and Swisscom
  • ‘Agile Adopter’: Tele2
  • ‘Utilitarian adopters’: Vodafone and SingTel
  • ‘Cableco 2.0’: Comcast and Liberty Global
  • Conclusion and Best Practice Recommendations

7 NFV Hurdles: How DTAG, NTT, Verizon, Vodafone, Swisscom and Comcast Have Tackled Them

Introduction

This report is one of a series analyzing the progress made by leading operators in the application of NFV and SDN, and the lessons learned so far. The two most recent reports, AT&T: Fast Pivot to the NFV Future and Telefónica’s NFV: An Empire Divided? provided insights into those companies’ successes and challenges in this regard. These reports also build on the insights from our Telco 2.0 Transformation and Enterprise Cloud and ICT Research Streams.

No other Tier One operator has committed itself publicly to ambitious virtualization targets along the lines of Telefónica or AT&T. However, this does not mean that operators are not planning, or indeed have not already embarked on, similar transformation programs, with virtualization thus far proceeding mainly on an element-by-element and service-by-service basis. The migration to increasingly software-defined networks (SDNs) and the implementation of network functions virtualization (NFV) are now an unavoidable direction of the road ahead; and no operator that seriously intends to survive in the long term is not already drawing up a roadmap.

This report examines some of the potential road blocks in the way of NFV, which account in part for the caution displayed by other big operators about embarking on major virtualization programs and broadcasting what they are doing. These questions are discussed in relation to Deutsche Telekom, NTT, Verizon, Vodafone, Swisscom, and Comcast, and how those operators have addressed some of the challenges.

Our next report will bring together high level recommendations for operators based on these and other analyses, to outline a roadmap for best practice in this particular aspect of the transformation of the telecoms industry to new business models.

What’s holding back NFV?

1. Operators have been laying the SDN foundations

One of the reasons why no other Tier One operator is emulating either Telefónica’s or AT&T’s approach is that many operators have been taking their time to elaborate and implement their overall SDN, NFV and cloud strategies. Many potential and actual approaches to the dual challenge of SDN and NFV exist, depending on the overall strategic objectives. The approach favored by some of the operators reviewed here has been to elaborate the SDN framework as a precursor to virtualizing particular network functions – although there are different paths that can be followed in working through the technological challenges; and in practice, the roadmap is never fully plotted out until the twists and turns of the journey have been charted.

The logical reason why SDN has been seen by many as a preliminary to NFV is that, put briefly, SDN offers more flexible and efficient ways to design, test, build and operate IP networks. It does this by separating out the intelligence about how the network operates, and how traffic flows, from the networking device, and placing it in a single controller with a perspective of the entire network. Taking the ‘intelligence’ out of many individual components also means that it is possible to build and buy those components for less, thus reducing some costs in the network.

Like SDN, NFV splits the control functions from the data forwarding functions. However, while SDN typically does this for the switches making up a local-area network, for example in a data center, NFV focuses specifically on wide-area network functions like routing, firewalls, load balancing, CPE, etc. Both SDN and NFV aim to leverage developments in Common Off The Shelf (COTS) hardware, such as generic server platforms utilizing multi-core CPUs, or merchant switch systems-on-chips, which are used to host and deliver those functions as Virtual Network Functions (VNFs).

Figure 1: Moving to SDN sets the scene for NFV

Source: STL Partners

SDN can consequently be viewed a prerequisite for NFV: enabling virtualized network functions (VNFs) to be deployed in the most effective and resource-efficient way as part of an overall network management framework in which infrastructure and computing resources are allocated dynamically to support fluctuating service usage and network demand.

A perhaps more fundamental – even ‘existential’ – reason why SDN can be seen as ‘coming before’ NFV is that the SDN framework defines what the communications network actually is in the new software-centric and IP-centric universe. Once network functionality is stripped out of the dedicated hardware that has traditionally run it and is pushed out into the cloud in the form of virtualized functions, then the telecoms network itself has in effect become merely a virtual network that anyone can in theory replicate with relative ease. SDN is the glue that binds all of the distributed, cloud-based functionality together and makes it operate as (if it were) a traditional telecoms network: delivering equivalent and ultimately superior levels of performance to networks running on dedicated hardware.

SDN is, then, in both senses – operational and existential – what enables operators to remain in control of the new virtualized networks. Operators have therefore been understandably cautious about embarking on NFV before their SDN frameworks are in place. And this process is being protracted still further because the industry in general has still not reached agreement on open SDN and NFV standards.


  • Executive Summary
  • Introduction
  • What’s holding back NFV?
  • 1. Operators have been laying the SDN foundations
  • 2. Operators have started from the enterprise and the cloud
  • 3. Operators are having to negotiate fundamental architectural issues as they go along
  • 4. OSS / BSS evolution and integration: Swisscom and Comcast
  • 5. Security
  • 6. Limited-scope NFV
  • 7. Skill sets and culture change
  • 2015: the year the foundations of NFV were laid?


  • Figure 1: Moving to SDN sets the scene for NFV
  • Figure 2: The new network is built out of the cloud-based SDN
  • Figure 3: Multi-vendor VNF integration process for Vodafone Italy’s VoLTE deployment
  • Figure 4: Collapsing classic BSS / OSS hierarchies through SDN and NFV
  • Figure 5: Re-engineering the cable network
  • Figure 6: The Emerging SDN-NFV Transformation Process

Will AT&T shed copper, fibre-up, or buy more content – and what are the lessons?

Looking Back to 2012

In version 1.0 of the Telco 2.0 Transformation Index, we identified a number of key strategic issues at AT&T that would mark it in the years to come. Specifically, we noted that the US wireless segment, AT&T Mobility, had been very strong, powered by iPhone data plans, that by contrast the consumer wireline segment, Home Solutions, had been rather weak, and that the enterprise segment, Business Solutions, faced a massive “crossing the chasm” challenge as its highly valuable customers began a technology transition that exposed them to new competitors, such as cloud computing providers, cable operators, and dark-fibre owners.

Figure 1: AT&T revenues by reporting segment, 2012 and 2014

AT&T revenues by reporting segment, 2012 and 2014

Source: Telco 2.0 Transformation Index

We noted that the wireless segment, though strong, was behind its great rival Verizon Wireless for 4G coverage and capacity, and that the future of the consumer wireline segment was dependent on a big strategic bet on IPTV content, delivered over VDSL (aka “fibre to the cabinet”).

In Business Solutions, newer products like cloud, M2M services, Voice 2.0, and various value-added networking services, grouped in “Strategic Business Services”, had to scale up and take over from traditional ones like wholesale circuit voice and Centrex, IP transit, classic managed hosting, and T-carriers, before too many customers went missing. The following chart shows the growth rates in each of the reporting segments over the last two years.

Figure 2: Revenue growth by reporting segment, 2-year CAGR

Revenue growth by reporting segment, 2-year CAGR

Source: Telco 2.0 Transformation Index

Out of the three major segments, wireless, consumer wireline, and business solutions, we can see that wireless is performing acceptably (although growth has slowed down), business solutions is in the grip of its transition, and wireline is just about growing. Because wireless is such a big segment (see Figure 1), it contributes a disproportionate amount to the company’s top line growth. Figure 2 shows revenue in the wireline segment as an index with Q2 2011 set to 100.

Figure 3: Wireline overall is barely growing…

AT&T Wireline Revenue

 Source: Telco 2.0 Transformation Index

Back in 2012, we summed up the consumer wireline strategy as being all about VDSL and TV. The combination, plus voice, makes up the product line known as U-Verse, which we covered in the Telco 2.0 Transformation Index. We were distinctly sceptical, essentially because we believe that broadband is now the key product in the triple-play and the one that sells the other elements. With cable operators routinely offering 100Mbps, and upgrades all the way to gigabit speeds in the pipeline, we found it hard to believe that a DSL network with “up to” 45Mbps maximum would keep up.


  • Executive Summary
  • Contents
  • Looking Back to 2012
  • The View in 2014
  • The DirecTV Filing
  • Getting out of consumer wireline
  • The business customers: jewel in the crown of wireline
  • Conclusion


  • Figure 1: AT&T revenues by reporting segment, 2012 and 2014
  • Figure 2: Revenue growth by reporting segment, 2-year CAGR
  • Figure 3: Wireline overall is barely growing…
  • Figure 4: It’s been a struggle for all fixed operators to retain customers – except high-speed cablecos Comcast and Charter
  • Figure 5: AT&T is 5th for ARPU, by a distance
  • Figure 6: AT&T’s consumer wireline ARPU is growing, but it is only just enough to avoid falling further behind
  • Figure 7: U-Verse content sales may have peaked
  • Figure 8: For the most important speed band, the cable option is a better deal
  • Figure 9: Revenue – only cablecos left alive…
  • Figure 10: Broadband “drives” bundles…
  • Figure 11: …or do bundles drive broadband?

Triple-Play in the USA: Infrastructure Pays Off

Introduction

In this note, we compare the recent performance of three US fixed operators who have adopted contrasting strategies and technology choices, AT&T, Verizon, and Comcast. We specifically focus on their NGA (Next-Generation Access) triple-play products, for the excellent reason that they themselves focus on these to the extent of increasingly abandoning the subscriber base outside their footprints. We characterise these strategies, attempt to estimate typical subscriber bundles, discuss their future options, and review the situation in the light of a “Deep Value” framework.

A Case Study in Deep Value: The Lessons from Apple and Samsung

Deep value strategies concentrate on developing assets that will be difficult for any plausible competitor to replicate, in as many layers of the value chain as possible. A current example is the way Apple and Samsung – rather than Nokia, HTC, or even Google – came to dominate the smartphone market.

It is now well known that Apple, despite its image as a design-focused company whose products are put together by outsourcers, has invested heavily in manufacturing throughout the iOS era. Although the first generation iPhone was largely assembled from proprietary parts, in many ways it should be considered as a large-scale pilot project. Starting with the iPhone 3GS, the proportion of Apple’s own content in the devices rose sharply, thanks to the acquisition of PA Semiconductor, but also to heavy investment in the supply chain.

Not only did Apple design and pilot-produce many of the components it wanted, it bought them from suppliers in advance to lock up the supply. It also bought machine tools the suppliers would need, often long in advance to lock up the supply. But this wasn’t just about a tactical effort to deny componentry to its competitors. It was also a strategic effort to create manufacturing capacity.

In pre-paying for large quantities of components, Apple provides its suppliers with the capital they need to build new facilities. In pre-paying for the machine tools that will go in them, they finance the machine tool manufacturers and enjoy a say in their development plans, thus ensuring the availability of the right machinery. They even invent tools themselves and then get them manufactured for the future use of their suppliers.

Samsung is of course both Apple’s biggest competitor and its biggest supplier. It combines these roles precisely because it is a huge manufacturer of electronic components. Concentrating on its manufacturing supply chain both enables it to produce excellent hardware, and also to hedge the success or failure of the devices by selling componentry to the competition. As with Apple, doing this is very expensive and demands skills that are both in short supply, and sometimes also hard to define. Much of the deep value embedded in Apple and Samsung’s supply chains will be the tacit knowledge gained from learning by doing that is now concentrated in their people.

The key insight for both companies is that industrial and user-experience design is highly replicable, and patent protection is relatively weak. The same is true of software. Apple had a deeply traumatic experience with the famous Look and Feel lawsuit against Microsoft, and some people have suggested that the supply-chain strategy was deliberately intended to prevent something similar happening again.

Certainly, the shift to this strategy coincides with the launch of Android, which Steve Jobs at least perceived as a “stolen product”. Arguably, Jobs repeated Apple’s response to Microsoft Windows, suing everyone in sight, with about as much success, whereas Tim Cook in his role as the hardware engineering and then supply-chain chief adopted a new strategy, developing an industrial capability that would be very hard to replicate, by design.

Three Operators, Three Strategies

AT&T

The biggest issue any fixed operator has faced since the great challenges of privatisation, divestment, and deregulation in the 1980s is that of managing the transition from a business that basically provides voice on a copper access network to one that basically provides Internet service on a co-ax, fibre, or possibly wireless access network. This, at least, has been clear for many years.

AT&T is the original telco – at least, AT&T likes to be seen that way, as shown by their decision to reclaim the iconic NYSE ticker symbol “T”. That obscures, however, how much has changed since the divestment and the extremely expensive process of mergers and acquisitions that patched the current version of the company together. The bit examined here is the AT&T Home Solutions division, which owns the fixed-line ex-incumbent business, also known as the merged BellSouth and SBC businesses.

AT&T, like all the world’s incumbents, deployed ADSL at the turn of the 2000s, thus getting into the ISP business. Unlike most world incumbents, in 2005 it got a huge regulatory boost in the form of the Martin FCC’s Comcast decision, which declared that broadband Internet service was not a telecommunications service for regulatory purposes. This permitted US fixed operators to take back the Internet business they had been losing to independent ISPs. As such, they were able to cope with the transition while concentrating on the big-glamour areas of M&A and wireless.

As the 2000s advanced, it became obvious that AT&T needed to look at the next move beyond DSL service. The option taken was what became U-Verse, a triple-play product which consists of:

  • Either ADSL, ADSL2+, or VDSL, depending on copper run length and line quality
  • Plus IPTV
  • And traditional telephony carried over IP.

This represents a minimal approach to the transition – the network upgrade requires new equipment in the local exchanges, or Central Offices in US terms, and in street cabinets, but it does not require the replacement of the access link, nor any trenching.

This minimisation of capital investment is especially important, as it was also decided that U-Verse would not deploy into areas where the copper might need investment to carry it. These networks would eventually, it was hoped, be either sold or closed and replaced by wireless service. U-Verse was therefore, for AT&T, in part a means of disposing of regulatory requirements.

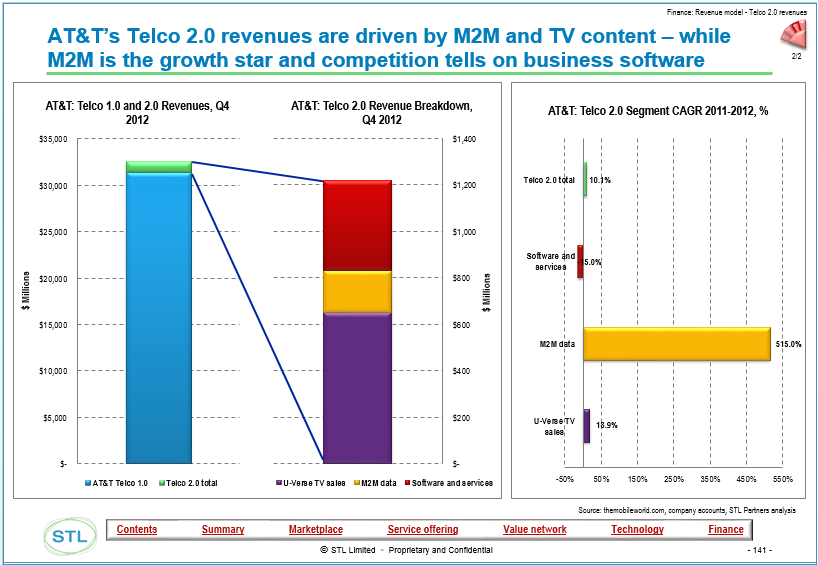
It was also important that the system closely coupled the regulated domain of voice with the unregulated, or at least only potentially regulated, domain of Internet service and the either unregulated or differently regulated domain of content. In many ways, U-Verse can be seen as a content first strategy. It’s TV that is expected to be the primary replacement for the dwindling fixed voice revenues. Figure 1 shows the importance of content to AT&T vividly.

Figure 1: U-Verse TV sales account for the largest chunk of Telco 2.0 revenue at AT&T, although M2M is growing fast

Telco 2 UVerse TV sales account for the largest chunk of Telco 2 revenue at ATandT although M2M is growing fast.png

Source: Telco 2.0 Transformation Index

This sounds like one of the telecoms-as-media strategies of the late 1990s. However, it should be clearly distinguished from, say, BT’s drive to acquire exclusive sports content and to build up a brand identity as a “channel”. U-Verse does not market itself as a “TV channel” and does not buy exclusive content – rather, it is a channel in the literal sense, a distributor through which TV is sold. We will see why in the next section.

The US TV Market

It is well worth remembering that TV is a deeply national industry. Steve Jobs famously described it as “balkanised” and as a result didn’t want to take part. Most metrics vary dramatically across national borders, as do qualitative observations of structure. (Some countries have a big public sector broadcaster, like the BBC or indeed Al-Jazeera, to give a basic example.) Countries with low pay-TV penetration can be seen as ones that offer greater opportunities, it being usually easier to expand the customer base than to win share from the competition (a “blue ocean” versus a “red sea” strategy).

However, it is also true that pay-TV in general is an easier sell in a market where most TV viewers already pay for TV. It is very hard to convince people to pay for a product they can obtain free.

In the US, there is a long-standing culture of pay-TV, originally with cable operators and more recently with satellite (DISH and DirecTV), IPTV or telco-delivered TV (AT&T U-Verse and Verizon FiOS), and subscription OTT (Netflix and Hulu). It is also a market characterised by heavy TV usage (an average household has 2.8 TVs). Out of the 114.2 million homes (96.7% of all homes) receiving TV, according to Nielsen, there are some 97 million receiving pay-TV via cable, satellite, or IPTV, a penetration rate of 85%. This is the largest and richest pay-TV market in the world.

In this sense, it ought to be a good prospect for TV in general, with the caveat that a “Sky Sports” or “BT Sport” strategy based on content exclusive to a distributor is unlikely to work. This is because typically, US TV content is sold relatively openly in the wholesale market, and in many cases, there are regulatory requirements that it must be provided to any distributor (TV affiliate, cable operator, or telco) that asks for it, and even that distributors must carry certain channels.

Rightsholders have backed a strategy based on distribution over one based on exclusivity, on the principle that the customer should be given as many opportunities as possible to buy the content. This also serves the interests of advertisers, who by definition want access to as many consumers as possible. Hollywood has always aimed to open new releases on as many cinema screens as possible, and it is the movie industry’s skills, traditions, and prejudices that shaped this market.

As a result, it is relatively easy for distributors to acquire content, but difficult for them to generate differentiation by monopolising exclusive content. In this model, differentiation tends to accrue to rightsholders, not distributors. For example, although HBO maintains the status of being a premium provider of content, consumers can buy it from any of AT&T, Verizon, Comcast, any other cable operator, satellite, or direct from HBO via an OTT option.

However, pay-TV penetration is high enough that any new entrant (such as the two telcos) is committed to winning share from other providers, the hard way. It is worth pointing out that the US satellite operators DISH and DirecTV concentrated on rural customers who aren’t served by the cable MSOs. At the time, their TV needs weren’t served by the telcos either. As such, they were essentially greenfield deployments, the first pay-TV propositions in their markets.

The biggest change in US TV in recent times has been the emergence of major new distributors, the two RBOCs and a range of Web-based over-the-top independents. Figure 2 summarises the situation going into 2013.

Figure 2: OTT video providers beat telcos, cablecos, and satellite for subscriber growth, at scale

OTT video providers beat telcos cablecos and satellite for subscriber growth at scale

Source: Telco 2.0 Transformation Index

The two biggest classes of distributors saw either a marginal loss of subscribers (the cablecos) or a marginal gain (satellite). The two groups of (relatively) new entrants, as you’d expect, saw much more growth. However, the OTT players are both bigger and much faster growing than the two telco players. It is worth pointing out that this mostly represents additional TV consumption, typically, people who already buy pay-TV adding a Netflix subscription. “Cord cutting” – replacing a primary TV subscription entirely – remains rare. In some ways, U-Verse can be seen as an effort to do something similar, upselling content to existing subscribers.

Competing for the Whole Bundle – Comcast and the Cable Industry

So how is this option doing? The following chart, Figure 3, shows that in terms of overall service ARPU, AT&T’s fixed strategy is delivering inferior results than its main competitors.

Figure 3: Cable operators lead the way on ARPU. Verizon, with FiOS, is keeping up

Cable operators lead the way on ARPU. Verizon, with FiOS, is keeping up

Source: Telco 2.0 Transformation Index

The interesting point here is that Time Warner Cable is doing less well than some of its cable industry peers. Comcast, the biggest, claims a $159 monthly ARPU for triple-play customers, and it probably has a higher density of triple-players than the telcos. More representatively, they also quote a figure of $134 monthly average revenue per customer relationship, including single- and double-play customers. We have used this figure throughout this note. TWC, in general, is more content-focused and less broadband-focused than Comcast, having taken much longer to roll out DOCSIS 3.0. But is that important? After all, aren’t cable operators all about TV? Figure 4 shows clearly that broadband and voice are now just as important to cable operators as they are to telcos. The distinction is increasingly just a historical quirk.

Figure 4: Non-video revenues – i.e. Internet service and voice – are the driver of growth for US cable operators

Non video revenues ie Internet service and voice are the driver of growth for US cable operatorsSource: NCTA data, STL Partners

As we have seen, TV in the USA is not a differentiator because everyone’s got it. Further, it’s a product that doesn’t bring differentiation but does bring costs, as the rightsholders exact their share of the selling price. Broadband and voice are different – they are, in a sense, products the operator makes in-house. Most have to buy the tools (except Free.fr which has developed its own), but in any case the operator has to do that to carry the TV.

The differential growth rates in Figure 4 represent a substantial change in the ISP industry. Traditionally, the Internet engineering community tended to look down on cable operators as glorified TV distribution systems. This is no longer the case.

In the late 2000s, cable operators concentrated on improving their speeds and increasing their capacity. They also pressed their vendors and standardisation forums to practice continuous improvement, creating a regular upgrade cycle for DOCSIS firmware and silicon that lets them stay one (or more) jumps ahead of the DSL industry. Some of them also invested in their core IP networking and in providing a deeper and richer variety of connectivity products for SMB, enterprise, and wholesale customers.

Comcast is the classic example of this. It is a major supplier of mobile backhaul, high-speed Internet service (and also VoIP) for small businesses, and a major actor in the Internet peering ecosystem. An important metric of this change is that since 2009, it has transitioned from being a downlink-heavy eyeball network to being a balanced peer that serves about as much traffic outbound as it receives inbound.

The key insight here is that, especially in an environment like the US where xDSL unbundling isn’t available, if you win a customer for broadband, you generally also get the whole bundle. TV is a valuable bonus, but it’s not differentiating enough to win the whole of the subscriber’s fixed telecoms spend – or to retain it, in the presence of competitors with their own infrastructure. It’s also of relatively little interest to business customers, who tend to be high-value customers.


  • Executive Summary
  • Introduction
  • A Case Study in Deep Value: The Lessons from Apple and Samsung
  • Three Operators, Three Strategies
  • AT&T
  • The US TV Market
  • Competing for the Whole Bundle – Comcast and the Cable Industry
  • Competing for the Whole Bundle II: Verizon
  • Scoring the three strategies – who’s winning the whole bundles?
  • SMBs and the role of voice
  • Looking ahead
  • Planning for a Future: What’s Up Cable’s Sleeve?
  • Conclusions


  • Figure 1: U-Verse TV sales account for the largest chunk of Telco 2.0 revenue at AT&T, although M2M is growing fast
  • Figure 2: OTT video providers beat telcos, cablecos, and satellite for subscriber growth, at scale
  • Figure 3: Cable operators lead the way on ARPU. Verizon, with FiOS, is keeping up
  • Figure 4: Non-video revenues – i.e. Internet service and voice – are the driver of growth for US cable operators
  • Figure 5: Comcast has the best pricing per megabit at typical service levels
  • Figure 6: Verizon is ahead, but only marginally, on uplink pricing per megabit
  • Figure 7: FCC data shows that it’s the cablecos, and FiOS, who under-promise and over-deliver when it comes to broadband
  • Figure 7: Speed sells at Verizon
  • Figure 8: Comcast and Verizon at parity on price per megabit
  • Figure 9: Typical bundles for three operators. Verizon FiOS leads the way
  • Figure 12: The impact of learning by doing on FTTH deployment costs during the peak roll-out phase