Beating the crash: What’s coming?

Signs of tougher times

Tough times are ahead…

As we look ahead, the world faces a number of significant challenges:

  • Global / OECD consumer confidence is diving to startling new depths as people increasingly feel the impact of inflation, supply constraints and a cost of living crisis.
  • This follows the war in Ukraine, the Covid pandemic and long Covid, stresses resulting from diverging political ideologies, growing social unrest, and the ever increasing realisation of the impact of climate change.
  • These seismic tensions are all driven by nearly 8 billion (and growing) people vying for resources and a vision of the future that they can continue to thrive in.

…but it’s not our first rodeo…

We have previously written about, for example:

And before that, there was the Credit Crunch series (2008), the Eurozone Crisis (2012), and technology and market disruptions too numerous to name.

There is always a temptation to think that the latest crisis is the worst. Each one tends to temporarily obliterate one’s view of the future as our imaginations are so absorbed in dealing with the nearby threat that all other considerations become secondary.

…and we believe we can bring some hope

Our solution to these challenges is two-fold. First, there is a lot that can be learned by looking at the lessons from previous traumas. Secondly, it is extremely helpful to be able to position all the individual events within an overall context, as it enables us to more rapidly reorientate after the latest shock.

Our context is The Coordination Age – the vision that the world is entering into a new era where:

  • The primary need is to make better use of available resources (e.g. money, carbon, time, assets, etc)
  • And that connecting technologies (e.g. telecommunications, data, automation and AI) are key elements of the solution.

Enter your details below to request an extract of the report

Making the Coordination Age work

making-the-coordination-age-work

Source: STL Partners

This report uses these learnings to look ahead to what we see as a challenging time. While some of the forces we outline in this report may seem alarming, this is not a pessimistic picture. We believe that the vision we describe brings opportunities for telecoms – but only if leaders in telecoms and elsewhere act on the vision. We are striving to make this happen, and we hope we can help you do that too.

A scale of discovery

To help contextualise the many forces of change, we have developed a six-stage schematic to generalise how people deal with new forces and changes in their lives. It progresses from the first recognition of a new theme or issue through to normalisation, the point where something is no longer new or different. The graphic below highlights the six stages, and general heuristic descriptions of what you might hear said, risks and threats, mitigations, and the general psychological and emotional mindset of those processing the change or issue in question.

Six stages of dealing with new ideas

six-stages-dealing-with-new-ideas-stl-partners

Source: STL Partners

The body of the report covers the drivers, their impact and consequences for telecoms:

  • Economic drivers, such as consumer confidence, inflation, and rising living costs
  • Environmental drivers, including climate change and carbon reduction
  • Political drivers, including the War in Ukraine, China / US tensions, trade wars and tensions
  • Social drivers, including Covid and Long Covid, inequalities and social polarisation.

Economic drivers: A crisis of confidence

In this section we examine drivers in consumer confidence, inflation / cost-of-living concerns and the consequences for telecoms.

Consumer confidence: An all-time low

The OECD consumer confidence index is a barometer of consumer sentiment. It reflects people’s confidence in their economic prospects. The chart below shows that it is currently reaching record new lows.

The OECD Consumer confidence index is at its lowest ever level

OECD-consumer-inflation-index-june-2022

Source: OECD

This means that consumers feel extremely pessimistic about their economic prospects. The average score is now below where it was at the peak of anxiety about Covid in early 2020, and below where it was in the financial crash in 2008-09. Indeed, the OECD average is now at its lowest ever level since global measures were introduced in the early 1970s, with only Mexico and Indonesia bucking the downward trend.

People are now preparing for a tough period in their economies. Some are worried about making ends meet – having enough to live to the standard they normally expect. This usually means that they will look to cut back on spending, especially for non-essential things.

Inflation is worrying everyone in Summer 2023

The pressures behind this trend are a generalised concern about inflation (rising prices on essential items like food) leading to a cost-of-living crisis.

Inflation overtook other global concerns in April 2022

Inflation-overtook-global-concerns-april-2022-stl-partners

Source: Ipsos

The Google trends chart below shows search interest in ‘inflation’ globally, which is an even more immediate signal of concern. It clearly spikes in July 2022.

Google Trends – searches for “inflation” spiked in Summer 2022

google-trends-searches-for-inflation-summer-2022-stl-partners

Source: Google

The problem is not confined to one or two economies: it is widespread, as the image from the interactive chart below shows.

inflation-global-challenge-2022-stl-partners

Source: FT

The rest of the analysis in this report reviews the macro-economic trends – i.e. the economic, environmental, political and social drivers of change. In a second report, we will cover telecoms industry trends, including technologies, policy, propositions and industry structure.


Table of Contents

  • Executive Summary
    • Not one crash, but many
    • 1. Actively realigning with stakeholders
    • 2. Accelerating operational innovation
    • 3. Enhancing resilience and customer security offerings
    • Next steps
  • Introduction: Signs of tougher times
    • A scale of discovery
  • Economic drivers: A crisis of confidence
    • Consumer confidence: An all-time low
    • Inflation is worrying everyone in summer 2022
    • Interest rates: A blunt tool?
    • Stock markets: Not quite sure…yet
    • Moving out of denial on economic problems
    • Consequences in telecoms demand
    • Recommendations
  • Environmental factors: Heating up fast
    • Climate change: Denial is hard these days
    • Decarbonisation: Digitising the industrial landscape, fast
    • Environmental concerns are now mainstream
    • Consequences for telecoms
    • Recommendations
  • Political: Drawing new lines
    • Ideo-conflict: Who’s side are you on?
    • The war in Ukraine: The first Coordination Age war?
    • China and Taiwan: Watching, waiting, wondering
    • Trade wars and barriers in general
    • Global instability: More trouble ahead
    • Consequences for telecoms
    • Recommendations
  • Social: A new order
    • Covid and Long Covid: Living with the virus
    • Rising resentment of inequalities
    • The United Nations Sustainable Development Goals
    • Consequences and recommendations for telecoms
  • Analysis
    • Getting the news in context
  • Appendix 1: Waste, pollution and air quality
    • Waste and pollution: Cleaning up
    • Refugees and migrations: Seeking solace in troubling times
  • Appendix 2: The 17 Sustainable Development Goals


Enter your details below to request an extract of the report


Why the consumer IoT is stuck in the slow lane

A slow start for NB-IoT and LTE-M

For telcos around the world, the Internet of Things (IoT) has long represented one of the most promising growth opportunities. Yet for most telcos, the IoT still only accounts for a low single digit percentage of their overall revenue. One of the stumbling blocks has been relatively low demand for IoT solutions in the consumer market. This report considers why that is and whether low cost connectivity technologies specifically-designed for the IoT (such as NB-IoT and LTE-M) will ultimately change this dynamic.

NB-IoT and LTE-M are often referred to as Massive IoT technologies because they are designed to support large numbers of connections, which periodically transmit small amounts of data. They can be distinguished from broadband IoT connections, which carry more demanding applications, such as video content, and critical IoT connections that need to be always available and ultra-reliable.

The initial standards for both technologies were completed by 3GPP in 2016, but adoption has been relatively modest. This report considers the key B2C and B2B2C use cases for Massive IoT technologies and the prospects for widespread adoption. It also outlines how NB-IoT and LTE-M are evolving and the implications for telcos’ strategies.

This builds on previous STL Partners’ research, including LPWA: Which way to go for IoT? and Can telcos create a compelling smart home?. The LPWA report explained why IoT networks need to be considered across multiple generations, including coverage, reliability, power consumption, range and bandwidth. Cellular technologies tend to be best suited to wide area applications for which very reliable connectivity is required (see Figure below).

IoT networks should be considered across multiple dimensions

IoT-networks-disruptive-analysis-stl-2021
Source: Disruptive Analysis


Enter your details below to request an extract of the report

The smart home report outlined how consumers could use both cellular and short-range connectivity to bolster security, improve energy efficiency, charge electric cars and increasingly automate appliances. One of the biggest underlying drivers in the smart home sector is peace of mind – householders want to protect their properties and their assets, as rising population growth and inequality fuels fear of crime.

That report contended that householders might be prepared to pay for a simple and integrated way to monitor and remotely control all their assets, from door locks and televisions to solar panels and vehicles.  Ideally, a dashboard would show the status and location of everything an individual cares about. Such a dashboard could show the energy usage and running cost of each appliance in real-time, giving householders fingertip control over their possessions. They could use the resulting information to help them source appropriate insurance and utility supply.

Indeed, STL Partners believes telcos have a broad opportunity to help coordinate better use of the world’s resources and assets, as outlined in the report: The Coordination Age: A third age of telecoms. Reliable and ubiquitous connectivity is a key enabler of the emerging sharing economy in which people use digital technologies to easily rent the use of assets, such as properties and vehicles, to others. The data collected by connected appliances and sensors could be used to help safeguard a property against misuse and source appropriate insurance covering third party rentals.

Do consumers need Massive IoT?

Whereas some IoT applications, such as connected security cameras and drones, require high-speed and very responsive connectivity, most do not. Connected devices that are designed to collect and relay small amounts of data, such as location, temperature, power consumption or movement, don’t need a high-speed connection.

To support these devices, the cellular industry has developed two key technologies – LTE-M (LTE for Machines, sometimes referred to as Cat M) and NB-IoT (Narrowband IoT). In theory, they can be deployed through a straightforward upgrade to existing LTE base stations. Although these technologies don’t offer the capacity, throughput or responsiveness of conventional LTE, they do support the low power wide area connectivity required for what is known as Massive IoT – the deployment of large numbers of low cost sensors and actuators.

For mobile operators, the deployment of NB-IoT and LTE-M can be quite straightforward. If they have relatively modern LTE base stations, then NB-IoT can be enabled via a software upgrade. If their existing LTE network is reasonably dense, there is no need to deploy additional sites – NB-IoT, and to a lesser extent LTE-M, are designed to penetrate deep inside buildings. Still, individual base stations may need to be optimised on a site-by-site basis to ensure that they get the full benefit of NB-IoT’s low power levels, according to a report by The Mobile Network, which notes that operators also need to invest in systems that can provide third parties with visibility and control of IoT devices, usage and costs.

There are a number of potential use cases for Massive IoT in the consumer market:

  • Asset tracking: pets, bikes, scooters, vehicles, keys, wallets, passport, phones, laptops, tablets etc.
  • Vulnerable persontracking: children and the elderly
  • Health wearables: wristbands, smart watches
  • Metering and monitoring: power, water, garden,
  • Alarms and security: smoke alarms, carbon monoxide, intrusion
  • Digital homes: automation of temperature and lighting in line with occupancy

In the rest of this report we consider the key drivers and barriers to take-up of NB-IoT and LTE-M for these consumer use cases.

Table of Contents

  • Executive Summary
  • Introduction
  • Do consumers need Massive IoT?
    • The role of eSIMs
    • Takeaways
  • Market trends
    • IoT revenues: Small, but growing
  • Consumer use cases for cellular IoT
    • Amazon’s consumer IoT play
    • Asset tracking: Demand is growing
    • Connecting e-bikes and scooters
    • Slow progress in healthcare
    • Smart metering gains momentum
    • Supporting micro-generation and storage
    • Digital buildings: A regulatory play?
    • Managing household appliances
  • Technological advances
    • Network coverage
  • Conclusions: Strategic implications for telcos


Enter your details below to request an extract of the report

4G success factors: What’s driving results in APAC?

Introduction: 4G strategies need the right market conditions to take off

Implementing 4G can help operators increase ARPU by reducing churn, offering a platform for new services, and encouraging increased data use. 4G networks also give operators greater control over data traffic management, and can ease pressure on overloaded 3G networks.

However, rates of adoption are not the same in every market. Therefore, for operators to successfully implement 4G and drive high adoption, they need to understand which key factors influence 4G adoption the most, and how they should adapt their strategies accordingly.

The Asia-Pacific (APAC) region encompasses over 30 individual countries and is home to more than half the world’s population. The range of economic, geographic, societal, and technological factors within the region is incredibly diverse: for example, at one end of the scale countries like Japan, Australia and South Korea enjoy high standards of development and technology adoption, and at the other there are countries like Nepal and Bangladesh, which are still developing. The region is also home to China and India, two countries that have undergone incredibly fast economic development over the past few decades, and emerged as important global markets – several other countries in the region are expected to follow suit in the future. Other influential factors such as government technology policies and market dynamics such as competition also vary widely.

For telcos outside this region looking in, some APAC countries will be trailblazers for new technologies like 5G, and other APAC countries will be attractive investment opportunities because of their potential for rapid development. To understand where opportunities lie – both for investment opportunities and for case studies to learn from – telcos need to study the region at an individual market level.

This report is the first of two that focus on the 4G market in APAC. This report uses quantitative and qualitative analysis to identify:

  • Which economic conditions influence 4G adoption the most
  • Where 30 individual countries are in their 4G adoption journey (and, implicitly, their path to 5G)
  • What prospects these countries have for further 4G growth
  • And what strategies operators should use to encourage 4G adoption

Contents:

  • Executive Summary
  • 1. Introduction: 4G strategies need the right market conditions to take off
  • Methodology
  • 2. APAC – a region of challenge and opportunity
  • Why should operators invest in 4G?
  • A potentially huge 4G market
  • 3. Diversity across the region means a “one size fits all” approach won’t work
  • Urbanisation and GNI per capita have the strongest correlation with 4G adoption…
  • Which countries have the most potential?
  • Qualitative factors also influence 4G adoption
  • 4. Quadrant analysis and country profiles
  • Quadrant I – 5G front-runners and 4G champions
  • Quadrant IV – High growth potential, but can it be realised?
  • Quadrant III – Challenging environment, but some exciting opportunities
  • 5. Recommendations and conclusions

Figures:

  • Figure 1: Comparing 4G penetration to adoption environment
  • Figure 2: APAC has the largest population in the world
  • Figure 3: And has more 4G subscribers by volume
  • Figure 4: But APAC has not yet fulfilled its 4G potential
  • Figure 5: APAC could be a 3 billion subscriber market
  • Figure 6: Analysis of 30 individual countries
  • Figure 7: Comparing 4G penetration to adoption environment
  • Figure 8: Quadrant I 4G adoption
  • Figure 9: Quadrant I heatmap scores
  • Figure 10: Quadrant IV 4G adoption
  • Figure 11: Quadrant IV heatmap scores
  • Figure 12: In eight countries 4G adoption is currently low but could take off
  • Figure 13: Quadrant III, Group 1 heatmap scores
  • Figure 14: Nine countries will continue to have slow 4G adoption
  • Figure 15: Quadrant III, Group 2 heatmap scores

Huawei’s choice: 5G visionary, price warrior or customer champion?

Introduction: Huawei H1s

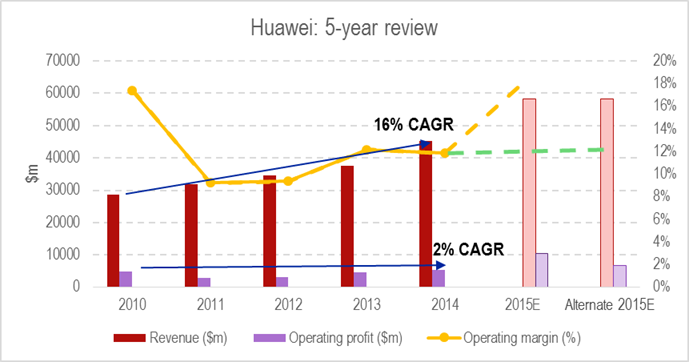
Huawei’s H1 2015 results caused something of a stir, as they seemed to promise a new cycle of rapid growth at the No.2 infrastructure vendor. The headline figure was that revenue for H1 was up 30% year-on-year, somewhat surprising as LTE infrastructure spending was thought to have passed the peak in much of the world. In context, Huawei’s revenue has grown at a 16% CAGR since 2010, while its operating profits have grown at 2%, implying very significant erosion of margins as the infrastructure business commoditises. Operating margins were in the region of 17-18% in 2010, before falling to 10-12% in 2012-2014.

Figure 1 – If Huawei’s H2 delivers as promised, it may have broken out of the commoditisation trap… for now

Source: STL Partners, Huawei press releases 

Our estimate, in Figure 1, uses the averages for the last 4 years to show two estimates for the full-year numbers. If the first, ‘2015E’, is delivered, this would take Huawei’s profitability back to the levels of 2010 and nearly double its operating profit. The second estimate ‘Alternate 2015E’, assumes a similar performance to last year’s, in which the second half of the year disappoints in terms of profitability. In this case, full-year margin would be closer to 12% rather than 18% and all the growth would be coming from volume. The H1 announcement promises margins for 2015 of 18%, which would therefore mean a very successful year indeed if they were delivered in H2. For the last few years, Huawei’s H2 revenue has been rather higher than H1, on average by about 10% for 2011-2014. You might expect this in a growing business, but profitability is much more erratic.

For reference, Figure 2 shows that the relationship between H1 and H2 profitability has varied significantly from year to year. While in 2012 and 2013 Huawei’s operating profits in H2 were higher than in H1, in 2011 and 2014, its H2 operating profits were much less than in H1. 2015E shows the scenario needed to deliver the 18% annual margin target; Alternate 2015E shows a scenario where H2 is relatively weak, in line with last year.

Figure 2 – Huawei’s H1 and H2 Profits have varied significantly year on year

Source: STL Partners, Huawei press releases 

Huawei’s annual report hints at some reasons for the weak H2 2014, notably poor sales in North America, stockbuilding ahead of major Chinese investment (inventory rose sharply through 2014), and the launch of the Honor low-cost device brand. However, although North American wireless investment was in fact low at the time, it’s never been a core market for Huawei, and Chinese carriers were spending heavily. It is plausible that adding a lot of very cheap devices would weigh on the company’s profitability. As we will see, though, there are reasons to think Huawei might not have got full value from strong carrier spending in this timeframe.

In any event, to hit Huawei’s ambitious 2015 target, it will need a great H2 2015 to follow from its strong H1. It hasn’t performed this particular ‘double’ for the last four years, so it will certainly be an achievement to do it in 2015. And if it does, how is the market looking for 2016 and beyond?

Where are we in the infrastructure cycle?

As Huawei is still primarily an infrastructure vendor, its business is closely coupled to operators’ CAPEX plans. In theory, these plans are meant to be cyclical, driven by the ever present urge to upgrade technology and build out networks. The theory goes that on one hand, technology drivers (new standards, higher-quality displays and camera sensors) and user behaviour (the secular growth in data traffic) drive operators to invest. On the other, financial imperatives (to derive as much margin from depreciating assets as possible) encourage operators to resist spending and sweat the assets.

Sometimes, the technology drivers get the upper hand; sometimes, the financial constraints. Therefore, the operator tends to “flip” between a high-investment and a low-investment state. Because operators compete, this behaviour may become synchronised within markets, causing large geographies to exhibit an infrastructure spending cycle.

In practice, there are other drivers that mitigate against the cyclical forces. There are ‘bottlenecks’ in integration and in scaling resources up and down, and generally, businesses prefer to keep expenditures as flat as possible to reduce variations and resulting ‘surprises’ for their shareholders. In general though, there is some ongoing variation in levels of capex investment in every market, as we examine in the following sections.

North America: operators take a breather before 5G

In North America, the tipping-point from sweating the assets to investment seems to have been reached roughly in 2011-2012, when the major carriers began a cycle of heavy investment in LTE infrastructure. This investment peaked in 2014. Recently, AT&T informed its shareholders to expect significantly lower CAPEX over the next few years, and in fact the actual numbers so far this year are substantially lower than the guidance of around 14-15% of revenue. Excluding the Mexican acquisitions, CAPEX/Revenue has been running around 13% since Q3 2014. From Q2 2013 to the end of Q2 2014, AT&T spent on average $5.7bn a quarter with the vendors. Since then, the average is $4.4bn, so AT&T has reduced its quarterly CAPEX by 21%.

Figure 3 – AT&T’s LTE investment cycle looks over.

Source: STL Partners, Huawei press releases

During 2013, AT&T, Sprint, and VZW were all in a higher spending phase, as Figure 3 shows. Since then, AT&T and Sprint have backed off considerably. However, despite its problems, Sprint does seem to be starting another round of investment, and VZW has started to invest again, while T-Mobile is rising gradually. We can therefore say that the investment pause in North America is overhyped, but does exist – compare the first half of 2013, when AT&T, Sprint, and T-Mobile were all near the top of the cycle while VZW was dead on the average.

Figure 4 – The investment cycle in North America.

Source: STL Partners

The pattern is somewhat clearer in terms of CAPEX as a percentage of revenue, shown in Figure 5. In late 2012 and most of 2013, AT&T, Sprint, and T-Mobile were all near the top of their historic ranges for CAPEX as a percentage of their revenue. Now, only Sprint is really pushing hard.

Figure 5 – Spot the outlier. Sprint is the only US MNO still investing heavily

Source: STL Partners, company filings

If there is cyclicality it is most visible here in Sprint’s numbers, and the cycle is actually pretty short – the peak-to-trough time seems to be about a year, so the whole cycle takes about two years to run. That suggests that if there is a more general cyclical uptick, it should be around H1 2016, and the one after that nicely on time for early 5G implementations in 2018.

  • Executive Summary
  • Introduction: Huawei H1s
  • Where are we in the infrastructure cycle?
  • North America: operators take a breather before 5G
  • Europe: are we seeing a return to growth?
  • China: full steam ahead under “special action mobilisation”
  • The infrastructure market is changing
  • Commoditisation on a historic scale
  • And Huawei is no longer the price leader
  • The China Mobile supercontract: a highly political event
  • Conclusion: don’t expect a surge in infrastructure profitability
  • Huawei’s 5G Strategy and the Standards Process
  • Huawei’s approach to 5G
  • What do operators want from 5G?
  • In search of consensus: 3GPP leans towards an simpler “early 5G” solution
  • Conclusions
  • STL Partners and Telco 2.0: Change the Game


  • Figure 1: In Q2, the Euro-5 out-invested Chinese operators for the first time
  • Figure 2: If Huawei’s H2 delivers as promised, it may have broken out of the commoditisation trap for now
  • Figure 3: Huawei’s H1 and H2 Profits have varied significantly year on year
  • Figure 4: AT&T’s LTE investment cycle looks over.
  • Figure 5: The investment cycle in North America.
  • Figure 6: Spot the outlier. Sprint is the only US MNO still investing heavily
  • Figure 7: 3 of the Euro-5 carriers are beginning to invest again
  • Figure 8: European investment levels are not as far behind as you might think
  • Figure 9: Chinese CAPEX/Revenue levels have been 10 percent higher than US or European ones – but this may be changing
  • Figure 10: Chinese infrastructure spending was taking a breather too, until Xi’s intervention
  • Figure 11: Chinese MNOs are investing heavily
  • Figure 12: LTE deployments have grown 100x while prices have fallen even more
  • Figure 13: As usual, Huawei is very much committed to a single radio solution
  • Figure 14: Huawei wants most 5G features in R15 by H2 2018
  • Figure 15: Huawei only supports priority for MBB very weakly and emphasises R16 and beyond
  • Figure 16: Chinese operators, Alcatel-Lucent, ZTE, and academic researchers disagree with Huawei
  • Figure 17: Orange’s view of 5G: distinctly practical
  • Figure 18: Telefonica is really quite sceptical about much of the 5G technology base
  • Figure 19: Qualcomm sees R15 as a bolt-on new radio in an LTE het-net
  • Figure 20: 3GPP RAN chairman Dino Flores says “yes” to prioritisation
  • Figure 21: Working as a group, the operators were slightly more ambitious
  • Figure 22: The vendors are very broadband-focused
  • Figure 23: Vodafone and Huawei

Baidu, Xiaomi & DJI: China’s Fast Growing Digital Disruptors

Introduction

The latest report in STL’s new Dealing with Disruption in Communications, Content and Commerce stream, this executive briefing analyses China’s leading digital disruptors and their likely impact outside their home country. The report explores whether the global leaders in digital commerce – Amazon, Apple, Facebook and Google – might soon face a serious challenge from a company built in China.

In our previous report, Alibaba & Tencent: China’s Digital Disruptors, we analysed China’s two largest digital ecosystems – Alibaba, which shares many similarities with Amazon, and Tencent, which is somewhat similar to Facebook. It explored the intensifying arms race between these two groups in China, their international ambitions and the support they might need from telcos and other digital players.

This executive briefing covers Baidu, China’s answer to Google and the anchor for a third digital ecosystem, and the fast-growing smartphone maker, Xiaomi, which has the potential to build a fourth major ecosystem. It also takes a close look at DJI, the world-leading drone manufacturer, which is well worth watching for its mid-to-long term potential to create another major ecosystem around consumer robotics.

Context: sizing up China’s disruptors

As U.S. companies have demonstrated time and time again, a large and dynamic domestic market can be a springboard to global dominance. Can China’s leading digital disruptors, which also benefit from a large and dynamic domestic market, also become major players on the global stage?

Alibaba, Tencent and Baidu, which run China’s leading digital ecosystems, have all developed in a digital economy that has been partially protected by cultural and linguistic characteristics, together with government policies and regulations. As a result, Google, Facebook and Amazon haven’t been able to replicate their global dominance in China. Of the big four global disruptors, only Apple can be said to be have a major presence in China.

Thanks to their strong position in China, Alibaba, Tencent and Baidu are among the leading Internet companies globally, as measured by market capitalisation (see Figure 2). As China’s economy slows (although it will still grow about 7% this year, according to government figures), many of China’s digital players are putting more focus on international growth. Alibaba & Tencent: China’s Digital Disruptors of this report outlined how Alibaba is gaining traction in other major middle income countries, notably Russia, whereas Tencent is trying, with limited success, to expand outside of China

Figure 2:  China is home to four of the world’s most valuable publicly-listed Internet companies

Source: Source: Morgan Stanley, Capital IQ, Bloomberg via KPCB

Of the five companies covered in the two parts of this report, search specialist Baidu is the least international – its revenues are almost all generated in China and its services aren’t much used outside its home country. Innovative and fast growing handset maker Xiaomi is still heavily dependent on China, but is seeing strong sales in other developing markets. The most international of the three is DJI, the world’s leading drone maker, which is making major inroads into the U.S. and Western Europe – the heartland of Apple, Google, Amazon and Facebook.

As discussed in Alibaba & Tencent: China’s Digital Disruptors, international telcos, media companies and banks all have a strategic interest in encouraging more digital competition globally. Today, the big four U.S.-based disruptors dominate the digital economy in North America, Western Europe, Latin America and much of the developing world, limiting the mindshare and market share available to other players.

Many telcos are particularly concerned about Apple’s and Facebook’s ever-strengthening position in digital communications – a core telecoms service. They also fret about Google’s and Amazon’s power in digital commerce and content. On the basis that my enemy’s enemy is my friend, telcos might want to support Xiaomi’s challenge to Apple, while backing Tencent’s efforts to make messaging app WeChat an international service and Alibaba’s growing rivalry with Amazon (both aspects are covered in the previous report).

  • Introduction
  • Executive Summary
  • Context: sizing up China’s disruptors
  • Baidu – China’s low cost Google
  • Why Baidu is important
  • Baidu’s business models
  • How big an impact will Baidu have outside China?
  • Threats to Baidu
  • Xiaomi – Apple without the margins?
  • Why Xiaomi is important
  • Business model
  • Xiaomi’s likely International impact
  • Threats to Xiaomi
  • DJI – more than a flight of fancy
  • Why DJI is important
  • DJI’s business model
  • Threats to DJI
  • Conclusions and implications for telcos
  • Baidu, Xiaomi and DJI could all build major ecosystems
  • Implications for telcos and other digital players


  • Figure 1: Baidu is significantly smaller than Tencent, Alibaba and Facebook
  • Figure 2: China is home to four of the world’s most valuable publically-listed Internet companies
  • Figure 3: Baidu is in the world’s top 15 media owners
  • Figure 4: Baidu is one of the world’s leading app developers
  • Figure 5: Baidu’s clean and uncluttered home page resembles that of Google
  • Figure 6: Baidu is beginning to monetise its millions of mobile users
  • Figure 7: IQiyi has broken into the top ten iOS apps worldwide
  • Figure 8: 2014 was a banner year for Baidu’s top line
  • Figure 9: Mobile now generates almost 50% of Baidu’s revenues
  • Figure 10: Baidu says its mobile browser is popular in Indonesia
  • Figure 11: Xiaomi is a rising star in the smartphone market
  • Figure 12: The slimline Mi Note has won plaudits for its design
  • Figure 13: The $15 Mi Band: A lot of technology for not a lot of money
  • Figure 14: One of Ninebot’s products – an electric unicycle
  • Figure 15: Xiaomi is turning its MIUI into a digital commerce platform
  • Figure 16: Xiaomi even has fan sites in markets where its handsets aren’t readily available
  • Figure 17: Drones’ primary job today is aerial photography
  • Figure 18: DJI majors on ease-of-use
  • Figure 18: DJI claims its Inspire One can transmit video pictures over 2km
  • Figure 20: DJI’s Go app delivers a real-time video feed to a smartphone or tablet
  • Figure 21: Baidu’s frugal innovation

Mobile Broadband 2.0: The Top Disruptive Innovations

Summary: Key trends, tactics, and technologies for mobile broadband networks and services that will influence mid-term revenue opportunities, cost structures and competitive threats. Includes consideration of LTE, network sharing, WiFi, next-gen IP (EPC), small cells, CDNs, policy control, business model enablers and more.(March 2012, Executive Briefing Service, Future of the Networks Stream).

Trends in European data usage

  Read in Full (Members only)  Buy a single user license online  To Subscribe click here

Below is an extract from this 44 page Telco 2.0 Report that can be downloaded in full in PDF format by members of the Telco 2.0 Executive Briefing service and Future Networks Stream here. Non-members can subscribe here, buy a Single User license for this report online here for £795 (+VAT for UK buyers), or for multi-user licenses or other enquiries, please email contact@telco2.net / call +44 (0) 207 247 5003. We’ll also be discussing our findings and more on Facebook at the Silicon Valley (27-28 March) and London (12-13 June) New Digital Economics Brainstorms.

To share this article easily, please click:


Introduction

Telco 2.0 has previously published a wide variety of documents and blog posts on mobile broadband topics – content delivery networks (CDNs), mobile CDNs, WiFi offloading, Public WiFi, network outsourcing (“‘Under-The-Floor’ (UTF) Players: threat or opportunity? ”) and so forth. Our conferences have featured speakers and panellists discussing operator data-plan pricing strategies, tablets, network policy and numerous other angles. We’ve also featured guest material such as Arete Research’s report LTE: Late, Tempting, and Elusive.

In our recent ‘Under the Floor (UTF) Players‘ Briefing we looked at strategies to deal with some of of the challenges facing operators’ resulting from market structure and outsourcing

Under The Floor (UTF) Players Telco 2.0

This Executive Briefing is intended to complement and extend those efforts, looking specifically at those technical and business trends which are truly “disruptive”, either immediately or in the medium-term future. In essence, the document can be thought of as a checklist for strategists – pointing out key technologies or trends around mobile broadband networks and services that will influence mid-term revenue opportunities and threats. Some of those checklist items are relatively well-known, others more obscure but nonetheless important. What this document doesn’t cover is more straightforward concepts around pricing, customer service, segmentation and so forth – all important to get right, but rarely disruptive in nature.

During 2012, Telco 2.0 will be rolling out a new MBB workshop concept, which will audit operators’ existing technology strategy and planning around mobile data services and infrastructure. This briefing document is a roundup of some of the critical issues we will be advising on, as well as our top-level thinking on the importance of each trend.

It starts by discussing some of the issues which determine the extent of any disruption:

  • Growth in mobile data usage – and whether the much-vaunted “tsunami” of traffic may be slowing down
  • The role of standardisation , and whether it is a facilitator or inhibitor of disruption
  • Whether the most important MBB disruptions are likely to be telco-driven, or will stem from other actors such as device suppliers, IT companies or Internet firms.

The report then drills into a few particular domains where technology is evolving, looking at some of the most interesting and far-reaching trends and innovations. These are split broadly between:

  • Network infrastructure evolution (radio and core)
  • Control and policy functions, and business-model enablers

It is not feasible for us to cover all these areas in huge depth in a briefing paper such as this. Some areas such as CDNs and LTE have already been subject to other Telco 2.0 analysis, and this will be linked to where appropriate. Instead, we have drilled down into certain aspects we feel are especially interesting, particularly where these are outside the mainstream of industry awareness and thinking – and tried to map technical evolution paths onto potential business model opportunities and threats.

This report cannot be truly exhaustive – it doesn’t look at the nitty-gritty of silicon components, or antenna design, for example. It also treads a fine line between technological accuracy and ease-of-understanding for the knowledgeable but business-focused reader. For more detail or clarification on any area, please get in touch with us – email mailto:contact@stlpartners.com or call +44 (0) 207 247 5003.

Telco-driven disruption vs. external trends

There are various potential sources of disruption for the mobile broadband marketplace:

  • New technologies and business models implemented by telcos, which increase revenues, decrease costs, improve performance or alter the competitive dynamics between service providers.
  • 3rd party developments that can either bolster or undermine the operators’ broadband strategies. This includes both direct MBB innovations (new uses of WiFi, for example), or bleed-over from adjacent related marketplaces such as device creation or content/application provision.
  • External, non-technology effects such as changing regulation, economic backdrop or consumer behaviour.

The majority of this report covers “official” telco-centric innovations – LTE networks, new forms of policy control and so on,

External disruptions to monitor

But the most dangerous form of innovation is that from third parties, which can undermine assumptions about the ways mobile broadband can be used, introducing new mechanisms for arbitrage, or somehow subvert operators’ pricing plans or network controls. 

In the voice communications world, there are often regulations in place to protect service providers – such as banning the use of “SIM boxes” to terminate calls and reduce interconnection payments. But in the data environment, it is far less obvious that many work-arounds can either be seen as illegal, or even outside the scope of fair-usage conditions. That said, we have already seen some attempts by telcos to manage these effects – such as charging extra for “tethering” on smartphones.

It is not really possible to predict all possible disruptions of this type – such is the nature of innovation. But by describing a few examples, market participants can gauge their level of awareness, as well as gain motivation for ongoing “scanning” of new developments.

Some of the areas being followed by Telco 2.0 include:

  • Connection-sharing. This is where users might link devices together locally, perhaps through WiFi or Bluetooth, and share multiple cellular data connections. This is essentially “multi-tethering” – for example, 3 smartphones discovering each other nearby, perhaps each with a different 3G/4G provider, and pooling their connections together for shared use. From the user’s point of view it could improve effective coverage and maximum/average throughput speed. But from the operators’ view it would break the link between user identity and subscription, and essentially offload traffic from poor-quality networks on to better ones.
  • SoftSIM or SIM-free wireless. Over the last five years, various attempts have been made to decouple mobile data connections from SIM-based authentication. In some ways this is not new – WiFi doesn’t need a SIM, while it’s optional for WiMAX, and CDMA devices have typically been “hard-coded” to just register on a specific operator network. But the GSM/UMTS/LTE world has always relied on subscriber identification through a physical card. At one level, it s very good – SIMs are distributed easily and have enabled a successful prepay ecosystem to evolve. They provide operator control points and the ability to host secure applications on the card itself. However, the need to obtain a physical card restricts business models, especially for transient/temporary use such as a “one day pass”. But the most dangerous potential change is a move to a “soft” SIM, embedded in the device software stack. Companies such as Apple have long dreamed of acting as a virtual network provider, brokering between user and multiple networks. There is even a patent for encouraging bidding per-call (or perhaps per data-connection) with telcos competing head to head on price/quality grounds. Telco 2.0 views this type of least-cost routing as a major potential risk for operators, especially for mobile data – although it also possible enables some new business models that have been difficult to achieve in the past.
  • Encryption. Various of the new business models and technology deployment intentions of operators, vendors and standards bodies are predicated on analysing data flows. Deep packet inspection (DPI) is expected to be used to identify applications or traffic types, enabling differential treatment in the network, or different charging models to be employed. Yet this is rendered largely useless (or at least severely limited) when various types of encryption are used. Various content and application types already secure data in this way – content DRM, BlackBerry traffic, corporate VPN connections and so on. But increasingly, we will see major Internet companies such as Apple, Google, Facebook and Microsoft using such techniques both for their own users’ security, but also because it hides precise indicators of usage from the network operators. If a future Android phone sends all its mobile data back via a VPN tunnel and breaks it out in Mountain View, California, operators will be unable to discern YouTube video from search of VoIP traffic. This is one of the reasons why application-based charging models – one- or two-sided – are difficult to implement.
  • Application evolution speed. One of the largest challenges for operators is the pace of change of mobile applications. The growing penetration of smartphones, appstores and ease of “viral” adoption of new services causes a fundamental problem – applications emerge and evolve on a month-by-month or even week-by-week basis. This is faster than any realistic internal telco processes for developing new pricing plans, or changing network policies. Worse, the nature of “applications” is itself changing, with the advent of HTML5 web-apps, and the ability to “mash up” multiple functions in one app “wrapper”. Is a YouTube video shared and embedded in a Facebook page a “video service”, or “social networking”?

It is also really important to recognise that certain procedures and technologies used in policy and traffic management will likely have some unanticipated side-effects. Users, devices and applications are likely to respond to controls that limit their actions, while other developments may result in “emergent behaviours” spontaneously. For instance, there is a risk that too-strict data caps might change usage models for smartphones and make users just connect to the network when absolutely necessary. This is likely to be at the same times and places when other users also feel it necessary, with the unfortunate implication that peaks of usage get “spikier” rather than being ironed-out.

There is no easy answer to addressing these type of external threats. Operator strategists and planners simply need to keep watch on emerging trends, and perhaps stress-test their assumptions and forecasts with market observers who keep tabs on such developments.

The mobile data explosion… or maybe not?

It is an undisputed fact that mobile data is growing exponentially around the world. Or is it?

A J-curve or an S-curve?

Telco 2.0 certainly thinks that growth in data usage is occurring, but is starting to see signs that the smooth curves that drive so many other decisions might not be so smooth – or so steep – after all. If this proves to be the case, it could be far more disruptive to operators and vendors than any of the individual technologies discussed later in the report. If operator strategists are not at least scenario-planning for lower data growth rates, they may find themselves in a very uncomfortable position in a year’s time.

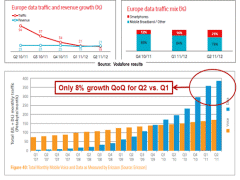
In its most recent study of mobile operators’ traffic patterns, Ericsson concluded that Q2 2011 data growth was just 8% globally, quarter-on-quarter, a far cry from the 20%+ growths seen previously, and leaving a chart that looks distinctly like the beginning of an S-curve rather than a continued “hockey stick”. Given that the 8% includes a sizeable contribution from undoubted high-growth developing markets like China, it suggests that other markets are maturing quickly. (We are rather sceptical of Ericsson’s suggestion of seasonality in the data). Other data points come from O2 in the UK , which appears to have had essentially zero traffic growth for the past few quarters, or Vodafone which now cites European data traffic to be growing more slowly (19% year-on-year) than its data revenues (21%). Our view is that current global growth is c.60-70%, c.40% in mature markets and 100%+ in developing markets.

Figure 1 – Trends in European data usage

 Trends in European Data Usage
 

Now it is possible that various one-off factors are at play here – the shift from unlimited to tiered pricing plans, the stronger enforcement of “fair-use” plans and the removal of particularly egregious heavy users. Certainly, other operators are still reporting strong growth in traffic levels. We may see resumption in growth, for example if cellular-connected tablets start to be used widely for streaming video. 

But we should also consider the potential market disruption, if the picture is less straightforward than the famous exponential charts. Even if the chart looks like a 2-stage S, or a “kinked” exponential, the gap may have implications, like a short recession in the economy. Many of the technical and business model innovations in recent years have been responses to the expected continual upward spiral of demand – either controlling users’ access to network resources, pricing it more highly and with greater granularity, or building out extra capacity at a lower price. Even leaving aside the fact that raw, aggregated “traffic” levels are a poor indicator of cost or congestion, any interruption or slow-down of the growth will invalidate a lot of assumptions and plans.

Our view is that the scary forecasts of “explosions” and “tsunamis” have led virtually all parts of the industry to create solutions to the problem. We can probably list more than 20 approaches, most of them standalone “silos”.

Figure 2 – A plethora of mobile data traffic management solutions

A Plethora of Mobile Data Traffic Management Solutions

What seems to have happened is that at least 10 of those approaches have worked – caps/tiers, video optimisation, WiFi offload, network densification and optimisation, collaboration with application firms to create “network-friendly” software and so forth. Taken collectively, there is actually a risk that they have worked “too well”, to the extent that some previous forecasts have turned into “self-denying prophesies”.

There is also another common forecasting problem occurring – the assumption that later adopters of a technology will have similar behaviour to earlier users. In many markets we are now reaching 30-50% smartphone penetration. That means that all the most enthusiastic users are already connected, and we’re left with those that are (largely) ambivalent and probably quite light users of data. That will bring the averages down, even if each individual user is still increasing their consumption over time. But even that assumption may be flawed, as caps have made people concentrate much more on their usage, offloading to WiFi and restricting their data flows. There is also some evidence that the growing numbers of free WiFi points is also reducing laptop use of mobile data, which accounts for 70-80% of the total in some markets, while the much-hyped shift to tablets isn’t driving much extra mobile data as most are WiFi-only.

So has the industry over-reacted to the threat of a “capacity crunch”? What might be the implications?

The problem is that focusing on a single, narrow metric “GB of data across the network” ignores some important nuances and finer detail. From an economics standpoint, network costs tend to be driven by two main criteria:

  • Network coverage in terms of area or population
  • Network capacity at the busiest places/times

Coverage is (generally) therefore driven by factors other than data traffic volumes. Many cells have to be built and run anyway, irrespective of whether there’s actually much load – the operators all want to claim good footprints and may be subject to regulatory rollout requirements. Peak capacity in the most popular locations, however, is a different matter. That is where issues such as spectrum availability, cell site locations and the latest high-speed networks become much more important – and hence costs do indeed rise. However, it is far from obvious that the problems at those “busy hours” are always caused by “data hogs” rather than sheer numbers of people each using a small amount of data. (There is also another issue around signalling traffic, discussed later). 

Yes, there is a generally positive correlation between network-wide volume growth and costs, but it is far from perfect, and certainly not a direct causal relationship.

So let’s hypothesise briefly about what might occur if data traffic growth does tail off, at least in mature markets.

  • Delays to LTE rollout – if 3G networks are filling up less quickly than expected, the urgency of 4G deployment is reduced.
  • The focus of policy and pricing for mobile data may switch back to encouraging use rather than discouraging/controlling it. Capacity utilisation may become an important metric, given the high fixed costs and low marginal ones. Expect more loyalty-type schemes, plus various methods to drive more usage in quiet cells or off-peak times.
  • Regulators may start to take different views of traffic management or predicted spectrum requirements.
  • Prices for mobile data might start to fall again, after a period where we have seen them rise. Some operators might be tempted back to unlimited plans, for example if they offer “unlimited off-peak” or similar options.
  • Many of the more complex and commercially-risky approaches to tariffing mobile data might be deprioritised. For example, application-specific pricing involving packet-inspection and filtering might get pushed back down the agenda.
  • In some cases, we may even end up with overcapacity on cellular data networks – not to the degree we saw in fibre in 2001-2004, but there might still be an “overhang” in some places, especially if there are multiple 4G networks.
  • Steady growth of (say) 20-30% peak data per annum should be manageable with the current trends in price/performance improvement. It should be possible to deploy and run networks to meet that demand with reducing unit “production cost”, for example through use of small cells. That may reduce the pressure to fill the “revenue gap” on the infamous scissors-diagram chart.

Overall, it is still a little too early to declare shifting growth patterns for mobile data as a “disruption”. There is a lack of clarity on what is happening, especially in terms of responses to the new controls, pricing and management technologies put recently in place. But operators need to watch extremely closely what is going on – and plan for multiple scenarios.

Specific recommendations will depend on an individual operator’s circumstances – user base, market maturity, spectrum assets, competition and so on. But broadly, we see three scenarios and implications for operators:

  • “All hands on deck!”: Continued strong growth (perhaps with a small “blip”) which maintains the pressure on networks, threatens congestion, and drives the need for additional capacity, spectrum and capex.
    • Operators should continue with current multiple strategies for dealing with data traffic – acquiring new spectrum, upgrading backhaul, exploring massive capacity enhancement with small cells and examining a variety of offload and optimisation techniques. Where possible, they should explore two-sided models for charging and use advanced pricing, policy or segmentation techniques to rein in abusers and reward those customers and applications that are parsimonious with their data use. Vigorous lobbying activities will be needed, for gaining more spectrum, relaxing Net Neutrality rules and perhaps “taxing” content/Internet companies for traffic injected onto networks.
  • “Panic over”: Moderating and patchy growth, which settles to a manageable rate – comparable with the patterns seen in the fixed broadband marketplace
    • This will mean that operators can “relax” a little, with the respite in explosive growth meaning that the continued capex cycles should be more modest and predictable. Extension of today’s pricing and segmentation strategies should improve margins, with continued innovation in business models able to proceed without rush, and without risking confrontation with Internet/content companies over traffic management techniques. Focus can shift towards monetising customer insight, ensuring that LTE rollouts are strategic rather than tactical, and exploring new content and communications services that exploit the improving capabilities of the network.
  • “Hangover”: Growth flattens off rapidly, leaving operators with unused capacity and threatening brutal price competition between telcos.
    • This scenario could prove painful, reminiscent of early-2000s experience in the fixed-broadband marketplace. Wholesale business models could help generate incremental traffic and revenue, while the emphasis will be on fixed-cost minimisation. Some operators will scale back 4G rollouts until cost and maturity go past the tipping-point for outright replacement of 3G. Restrictive policies on bandwidth use will be lifted, as operators compete to give customers the fastest / most-open access to the Internet on mobile devices. Consolidation – and perhaps bankruptcies – may ensure as declining data prices may coincide with substitution of core voice and messaging business

To read the note in full, including the following analysis…

  • Introduction
  • Telco-driven disruption vs. external trends
  • External disruptions to monitor
  • The mobile data explosion… or maybe not?
  • A J-curve or an S-curve?
  • Evolving the mobile network
  • Overview
  • LTE
  • Network sharing, wholesale and outsourcing
  • WiFi
  • Next-gen IP core networks (EPC)
  • Femtocells / small cells / “cloud RANs”
  • HetNets
  • Advanced offload: LIPA, SIPTO & others
  • Peer-to-peer connectivity
  • Self optimising networks (SON)
  • M2M-specific broadband innovations
  • Policy, control & business model enablers
  • The internal politics of mobile broadband & policy
  • Two sided business-model enablement
  • Congestion exposure
  • Mobile video networking and CDNs
  • Controlling signalling traffic
  • Device intelligence
  • Analytics & QoE awareness
  • Conclusions & recommendations
  • Index

…and the following figures…

  • Figure 1 – Trends in European data usage
  • Figure 2 – A plethora of mobile data traffic management solutions
  • Figure 3 – Not all operator WiFi is “offload” – other use cases include “onload”
  • Figure 4 – Internal ‘power tensions’ over managing mobile broadband
  • Figure 5 – How a congestion API could work
  • Figure 6 – Relative Maturity of MBB Management Solutions
  • Figure 7 – Laptops generate traffic volume, smartphones create signalling load
  • Figure 8 – Measuring Quality of Experience
  • Figure 9 – Summary of disruptive network innovations

Members of the Telco 2.0 Executive Briefing Subscription Service and Future Networks Stream can download the full 44 page report in PDF format hereNon-Members, please subscribe here, buy a Single User license for this report online here for £795 (+VAT for UK buyers), or for multi-user licenses or other enquiries, please email contact@telco2.net / call +44 (0) 207 247 5003.

Organisations, geographies, people and products referenced: 3GPP, Aero2, Alcatel Lucent, AllJoyn, ALU, Amazon, Amdocs, Android, Apple, AT&T, ATIS, BBC, BlackBerry, Bridgewater, CarrierIQ, China, China Mobile, China Unicom, Clearwire, Conex, DoCoMo, Ericsson, Europe, EverythingEverywhere, Facebook, Femto Forum, FlashLinq, Free, Germany, Google, GSMA, H3G, Huawei, IETF, IMEI, IMSI, InterDigital, iPhones,Kenya, Kindle, Light Radio, LightSquared, Los Angeles, MBNL, Microsoft, Mobily, Netflix, NGMN, Norway, NSN, O2, WiFi, Openet, Qualcomm, Radisys, Russia, Saudi Arabia, SoftBank, Sony, Stoke, Telefonica, Telenor, Time Warner Cable, T-Mobile, UK, US, Verizon, Vita, Vodafone, WhatsApp, Yota, YouTube, ZTE.

Technologies and industry terms referenced: 2G, 3G, 4.5G, 4G, Adaptive bitrate streaming, ANDSF (Access Network Discovery and Selection Function), API, backhaul, Bluetooth, BSS, capacity crunch, capex, caps/tiers, CDMA, CDN, CDNs, Cloud RAN, content delivery networks (CDNs), Continuous Computing, Deep packet inspection (DPI), DPI, DRM, Encryption, Enhanced video, EPC, ePDG (Evolved Packet Data Gateway), Evolved Packet System, Femtocells, GGSN, GPS, GSM, Heterogeneous Network (HetNet), Heterogeneous Networks (HetNets), HLRs, hotspots, HSPA, HSS (Home Subscriber Server), HTML5, HTTP Live Streaming, IFOM (IP Flow Mobility and Seamless Offload), IMS, IPR, IPv4, IPv6, LIPA (Local IP Access), LTE, M2M, M2M network enhancements, metro-cells, MiFi, MIMO (multiple in, MME (Mobility Management Entity), mobile CDNs, mobile data, MOSAP, MSISDN, MVNAs (mobile virtual network aggregators)., MVNO, Net Neutrality, network outsourcing, Network sharing, Next-generation core networks, NFC, NodeBs, offload, OSS, outsourcing, P2P, Peer-to-peer connectivity, PGW (PDN Gateway), picocells, policy, Policy and Charging Rules Function (PCRF), Pre-cached video, pricing, Proximity networks, Public WiFi, QoE, QoS, RAN optimisation, RCS, remote radio heads, RFID, self-optimising network technology (SON), Self-optimising networks (SON), SGW (Serving Gateway), SIM-free wireless, single RANs, SIPTO (Selective IP Traffic Offload), SMS, SoftSIM, spectrum, super-femtos, Telco 2.0 Happy Pipe, Transparent optimisation, UMTS, ‘Under-The-Floor’ (UTF) Players, video optimisation, VoIP, VoLTE, VPN, White space, WiFi, WiFi Direct, WiFi offloading, WiMAX, WLAN.

The value of “Smart Pipes” to mobile network operators

Preface

Rationale and hypothesis for this report

It is over fourteen years since David Isenberg wrote his seminal paper The Rise of the Stupid Network in which he outlined the view that telephony networks would increasingly become dumb pipes as intelligent endpoints came to control how and where data was transported. Many of his predictions have come to fruition. Cheaper computing technology has resulted in powerful ‘smartphones’ in the hands of millions of people and new powerful internet players are using data centres to distribute applications and services ‘over the top’ to users over fixed and mobile networks.

The hypothesis behind this piece of research is that endpoints cannot completely control the network. STL Partners believes that the network itself needs to retain intelligence so it can interpret the information it is transporting between the endpoints. Mobile network operators, quite rightly, will not be able to control how the network is used but must retain the ability within the network to facilitate a better experience for the endpoints. The hypothesis being tested in this research is that ‘smart pipes’ are needed to:

  1. Ensure that data is transported efficiently so that capital and operating costs are minimised and the internet and other networks remain cheap methods of distribution.
  2. Improve user experience by matching the performance of the network to the nature of the application or service being used. ‘Best effort’ is fine for asynchronous communication, such as email or text, but unacceptable for voice. A video call or streamed movie requires guaranteed bandwidth, and real-time gaming demands ultra-low latency;
  3. Charge appropriately for use of the network. It is becoming increasingly clear that the Telco 1.0 business model – that of charging the end-user per minute or per Megabyte – is under pressure as new business models for the distribution of content and transportation of data are being developed. Operators will need to be capable of charging different players – end-users, service providers, third-parties (such as advertisers) – on a real-time basis for provision of broadband and guaranteed quality of service (QoS);
  4. Facilitate interactions within the digital economy. Operators can compete and partner with other players, such as the internet companies, in helping businesses and consumers transact over the internet. Networks are no longer confined to communications but are used to identify and market to prospects, complete transactions, make and receive payments and remittances, and care for customers. The knowledge that operators have about their customers coupled with their skills and assets in identity and authentication, payments, device management, customer care etc. mean that ‘the networks’ can be ‘enablers’ in digital transactions between third-parties – helping them to happen more efficiently and effectively.

Overall, smarter networks will benefit network users – upstream service providers and end users – as well as the mobile network operators and their vendors and partners. Operators will also be competing to be smarter than their peers as, by differentiating here, they gain cost, revenue and performance advantages that will ultimately transform in to higher shareholder returns.

Sponsorship and editorial independence

This report has kindly been sponsored by Tellabs and is freely available. Tellabs developed the initial concepts, and provided STL Partners with the primary input and scope for the report. Research, analysis and the writing of the report itself was carried out independently by STL Partners. The views and conclusions contained herein are those of STL Partners.

About Tellabs

Tellabs logo

Tellabs innovations advance the mobile Internet and help our customers succeed. That’s why 43 of the top 50 global communications service providers choose our mobile, optical, business and services solutions. We help them get ahead by adding revenue, reducing expenses and optimizing networks.

Tellabs (Nasdaq: TLAB) is part of the NASDAQ Global Select Market, Ocean Tomo 300® Patent Index, the S&P 500 and several corporate responsibility indexes including the Maplecroft Climate Innovation Index, FTSE4Good and eight FTSE KLD indexes. http://www.tellabs.com

Executive Summary

Mobile operators no longer growth stocks

Mobile network operators are now valued as utility companies in US and Europe (less so APAC). Investors are not expecting future growth to be higher than GDP and so are demanding money to be returned in the form of high dividends.

Two ‘smart pipes’ strategies available to operators

In his seminal book, Michael Porter identified three generic strategies for companies – ‘Cost leadership’, ‘Differentiation’ and ‘Focus’. Two of these are viable in the mobile telecommunications industry – Cost leadership, or Happy Pipe in STL Partners parlance, and Differentiation, or Full-service Telco 2.0. No network operators have found a Focus strategy to work as limiting the customer base to a segment of the market has not yielded sufficient returns on the high capital investment of building a network. Even MVNOs that have pursued this strategy, such as Helio which targeted Korean nationals in the US, have struggled.

Underpinning the two business strategies are related ‘smart pipe’ approaches – smart network and smart services:

Normal
0

false
false
false

EN-GB
X-NONE
X-NONE


Porter

Strategy

Telco 2.0 strategy

Nature of smartness

Characteristics

Cost leadership

Happy Pipe

Smart network

Cost efficiency – minimal network, IT and commercial costs.  Simple utility offering.

Differentiation

Full-service Telco 2.0

Smart services

Technical and commercial flexibility: improve customer experience by integrating network capabilities with own and third-party services and charging either end user or service provider (or both).

Normal
0

false
false
false

EN-GB
X-NONE
X-NONE

Source: STL Partners

It is important to note that, currently at least, having a smart network is a precursor of smart services.  It would be impossible for an operator to implement a Full-service Telco 2.0 strategy without having significant network intelligence.  Full-service Telco 2.0 is, therefore, an addition to a Happy Pipe strategy.

Smart network strategy good, smart services strategy better

In a survey conducted for this report, it was clear that operators are pursuing ‘smart’ strategies, whether at the network level or extending beyond this into smart services, for three reasons:

  • Revenue growth: protecting existing revenue sources and finding new ones.  This is seen as the single most important driver of building more intelligence.
  • Cost savings: reducing capital and operating costs.
  • Performance improvement: providing customers with an improved customer experience.

Assuming that most mobile operators currently have limited smartness in either network or services, our analysis suggests significant upside in financial performance from successfully implementing either a Happy Pipe or Full-service Telco 2.0 strategy.  Most mobile operators generate Cash Returns on Invested Capital of between 5 and 7%.  For the purposes of our analysis, we have a assumed a baseline of 5.8%.  The lower capital and operator costs of a Happy Pipe strategy could increase this to 7.4% and the successful implementation of a Full-service Telco 2.0 strategy would increase this to a handsome 13.3%:

Normal
0

false
false
false

EN-GB
X-NONE
X-NONE

Telco 2.0 strategy

Nature of smartness

Cash Returns on Invested Capital

As-is – Telco 1.0

Low – relatively dumb

5.8%

Happy Pipe

Smart network

7.4%

Full-service Telco 2.0

Smart services

13.3%

Source: STL Partners

STL Partners has identified six opportunity areas for mobile operators to exploit with a Full-service Telco 2.0 strategy.  Summarised here, these are outlined in detail in the report:

Opportunity Type

Approach

Typical Services

Core Services

Improving revenues and customer loyalty by better design, analytics, and smart use of data in existing services.

Access, Voice and Messaging, Broadband, Standard Wholesale, Generic Enterprise ICT Services (inc. SaaS)

Vertical industry solutions (SI)

Delivery of ICT projects and support to vertical enterprise sectors.

Systems Integration (SI), Vertical CEBP solutions, Vertical ICT, Vertical M2M solutions, and Private Cloud.

Infrastructure services

Optimising cost and revenue structures by buying and selling core telco ICT asset capacity.

Bitstream ADSL, Unbundled Local Loop, MVNOs, Wholesale Wireless, Network Sharing, Cloud – IaaS.

Embedded communications

Enabling wider use of voice, messaging, and data by facilitating access to them and embedding them in new products.

Comes with data, Sender pays delivery, Horizontal M2M Platforms, Voice, Messaging and Data APIs for 3rd Parties.

Third-pary business enablers

Enabling new telco assets (e.g. Customer data) to be leveraged in support of 3rd party business processes.

Telco enabled Identity and Authorisation, Advertising and Marketing, Payments. APIs to non-core services and assets.

Own-brand OTT services

Building value through Telco-owned online properties and ‘Over-the-Top’ services.

Online Media, Enterprise Web Services, Own Brand VOIP services.


Source: STL Partners

Normal
0

false
false
false

EN-GB
X-NONE
X-NONE

Regional approaches to smartness vary

As operators globally experience a slow-down in revenue growth, they are pursuing ways of maintaining margins by reducing costs.  Unsurprisingly therefore, most operators in North America, Europe and Asia-Pacific appear to be pursuing a Happy Pipe/smart network strategy.  Squeezing capital and operating costs and improving network performance is being sought through such approaches as:

  • Physical network sharing – usually involving passive elements such as towers, air-conditioning equipment, generators, technical premises and pylons.
  • Peering data traffic rather than charging (and being charged) for transit.
  • Wi-Fi offload – moving data traffic from the mobile network on to cheaper fixed networks.
  • Distributing content more efficiently through the use of multicast and CDNs.
  • Efficient network configuration and provisioning.
  • Traffic shaping/management via deep-packet inspection (DPI) and policy controls.
  • Network protection – implementing security procedures for abuse/fraud/spam so that network performance is maximised.
  • Device management to ameliorate device impact on network and improve customer experience

Vodafone Asia-Pacific is a good example of an operator pursuing these activities aggressively and as an end in itself rather than as a basis for a Telco 2.0 strategy.  Yota in Russia and Lightsquared in the US are similarly content with being Happy Pipers.

In general, Asia-Pacific has the most disparate set of markets and operators.  Markets vary radically in terms of maturity, structure and regulation and operators seem to polarise into extreme Happy Pipers (Vodafone APAC, China Mobile, Bharti) and Full-Service Telco 2.0 players (NTT Docomo, SK Telecom, SingTel, Globe).

In Telefonica, Europe is the home of the operator with the most complete Telco 2.0 vision globally.  Telefonica has built and acquired a number of ‘smart services’ which appear to be gaining traction including O2 Priority Moments, Jajah, Tuenti and Terra.  Recent structural changes at the company, in which Telefonica Digital was created to focus on opportunities in the digital economy, further indicate the company’s focus on Telco 2.0 and smart services.  Europe too appears to be the most collaborative market.  Vodafone, Telefonica, Orange, Telecom Italia and T-Mobile are all working together on a number of Telco 2.0 projects and, in so doing, seek to generate enough scale to attract upstream developers and downstream end-users.

The sheer scale of the two leading mobile operators in the US, AT&T and Verizon, which have over 100 million subscribers each, means that they are taking a different approach to Telco 2.0.  They are collaborating on one or two opportunities, notably with ISIS, a near-field communications payments solution for mobile, which is a joint offer from AT&T, Verizon and T-Mobile.  However, in the main, there is a high degree of what one interviewee described as ‘Big Bell dogma’ – the view that their company is big enough and powerful enough to take on the OTT players and ‘control’ the experiences of end users in the digital economy.  The US market is more consolidated than Europe (giving the big players more power) but, even so, it seems unlikely that either AT&T or Verizon can keep customers using only their services – the lamented wall garden approach.

Implementing a Telco 2.0 strategy is important but challenging

STL Partners explored both how important and how difficult it is to implement the changes required to deliver a Happy Pipe strategy (outlined in the bullets above) and those needed for Full-service Telco 2.0 strategy, via industry interviews with operators and a quantitative survey.  The key findings of this analysis were:

  • Overall, respondents felt that many activities were important as part of a smart strategy.  In our survey, all except two activity areas – Femto/pico underlay and Enhanced switches (vs. routers) – were rated by more than 50% of respondents as either ‘Quite important’ or ‘Very important’ (see chart below).
  • Activities associated with a Full-service Telco 2.0 strategy were rated as particularly important:
  • Making operator assets available via APIs, Differentiated pricing and charging and Personalised and differentiated services were ranked 1, 2 and 3 out of the thirteen activities.
  • Few considered that any of the actions were dangerous and could destroy value, although Physical network sharing and Traffic shaping/DPI were most often cited here.
Smart Networks - important implementation factors to MNOs
Source: STL Partners/Telco 2.0 & Tellabs ‘Smart pipes’ survey, July 2011, n=107

NOTE: Overall ranking was based on a weighted scoring policy of Very important +4, Quite important +3, Not that important +2, Unimportant +1, Dangerous -4.

Overall, most respondents to the survey and people we spoke with felt that operators had more chance in delivering a Happy Pipe strategy and that only a few Tier 1 operators would be successful with a Full-Service Telco 2.0 strategy.  For both strategies, they were surprisingly sceptical about operators’ ability to implement the necessary changes.  Five reasons were cited as major barriers to success and were particularly big when considering a Full-Service Telco 2.0 strategy:

  1. Competition from internet players.  Google, Apple, Facebook et al preventing operators from expanding their role in the digital economy.
  2. Difficulty in building a viable ecosystem. Bringing together the required players for such things as near-field communications (NFC) mobile payments and sharing value among them.
  3. Lack of mobile operators skills.  The failure of operators to develop or exploit key skills required for facilitating transactions such as customer data management and privacy.
  4. Culture.  Being too wedded to existing products, services and business models to alter the direction of the super-tanker.
  5. Organisation structure. Putting in place the people and processes to manage the change.

Looking at the specific activities required to build smartness, it was clear that those required for a Full-service Telco 2.0/smart services strategy are considered the hardest to implement (see chart below):

  • Personalised and differentiated services via use of customer data – content, advertising, etc.
  • Making operator assets available to end users and other service providers – location, presence, ID, payments
  • Differentiated pricing and charging based on customer segment, service, QoS
Smart Networks - how challenging are the changes?
Source: STL Partners/Telco 2.0 & Tellabs ‘Smart pipes’ survey, July 2011, n=100

NOTE: Overall ranking was based on a weighted scoring policy of Very easy +5, Relatively straightforward +4, Manageable +3, Quite difficult +2, Very difficult -2.

Conclusions and recommendations

By comparing the relative importance of specific activities against how easy they are to implement, we were able to classify them into four categories:

Category

Importance for delivering smart strategy

Relative ease of implementation

Must get right

High

Easy

Strive for new role

High

Difficult

Housekeeping

Low

Easy

Forget

Low

Difficult

Rating of factors needed for Telco 2.0 'Smart Pipes' and 'Full Services' Strategies
Source: STL Partners/Telco 2.0 & Tellabs ‘Smart pipes’ survey, July 2011, n=100

Unfortunately, as the chart above shows, no activities fall clearly into the ‘Forget’ categories but there are some clear priorities:

  • A Full-service Telco 2.0 strategy is about striving for a new role in the digital economy and is probably most appropriate for Tier 1 MNOs, since it is going to require substantial scale and investment in new skills such as software and application development and customer data.  It will also require the development of new partnerships and ecosystems and complex commercial arrangements with players from other industries (e.g. banking). 
  • There is a cluster of smart network activities that are individually relatively straightforward to implement and will yield a big bang for the buck if investments are made – the ‘Must get right’ group:
  • More efficient network configuration and provisioning;
  • Strengthen network security to cope with abuse and fraud;
  • Improve device management (and cooperation with handset manufacturers and content players) to reduce the impact of smartphone burden on the network;

Although deemed more marginal in our survey, we would include as equally important:

  • Traffic shaping and DPI which, in many cases, underpins various smart services opportunities such as differentiated pricing based on QoS and Multicast and CDNs which are proven in the fixed world and likely to be equally beneficial in a video-dominated mobile one.

There is second cluster of smart network activities which appear to be equally easy (or difficult) to implement but are deemed by respondents to be lower value and therefore fall into a lower ‘Housekeeping’ category:

  • Wi-Fi offload – we were surprised by this given the emphasis placed on this by NTT Docomo, China Mobile, AT&T, O2 and others;
  • Peering (vs. transit) and Enhanced switches  – this is surely business-as-usual for all MNOs;
  • Femto/Pico underlay – generally felt to be of limited importance by respondents although a few cited its importance in pushing network intelligence to the edge which would enable MNOs to more easily deliver differentiated QoS and more innovative retail and wholesale revenue models;
  • Physical network sharing – again, a surprising result given the keenness of the capital markets on this strategy. 


Overall, it appears that mobile network operators need to continue to invest resources in developing smart networks but that a clear prioritisation of efforts is needed given the multitude of ‘moving parts’ required to develop a smart network that will deliver a successful Happy Pipe strategy.

A successful Full-Service Telco 2.0 strategy is likely to be extremely profitable for a mobile network operator and would result in a substantial increase in share price.  But delivering this remains a major challenge and investors are sceptical.  Collaboration, experimentation and investment are important facets of a Telco 2.0 implementation strategy as they drive scale, learning and innovation respectively.  Given the demands of investors for dividend yields, investment is only likely to be available if an operator becomes more efficient, so implementing a Happy Pipe strategy which reduces capital and operating costs is critical.


Report Contents


  • Executive Summary
  • Mobile network operator challenges
  • The future could still be bright
  • Defining a ‘smart’ network
  • Understanding operator strategies
  • Video: Case study in delivering differentiation and cost leadership
  • The benefits of Smart on CROIC
  • Implementing a ‘smart’ strategy
  • Conclusions and recommendations

Report Figures


  • Figure 1: Pressure from all sides for operators
  • Figure 2: Vodafone historical dividend yield – from growth to income
  • Figure 3: Unimpressed capital markets and falling employment levels
  • Figure 4: Porter and Telco 2.0 competitive strategies
  • Figure 5: Defining Differentiation/Telco 2.0
  • Figure 6 – The Six Opportunity Areas – Approach, Typical Services and Examples
  • Figure 7: Defining Cost Leadership/Happy Pipe
  • Figure 8: Defining ‘smartness’
  • Figure 9: Telco 2.0 survey – Defining smartness
  • Figure 10: NTT’s smart content delivery system – a prelude to mobile CDNs?
  • Figure 11: Vodafone India’s ARPU levels are now below $4/month, illustrating the need for a ‘smart network’ approach
  • Figure 12: China Mobile’s WLAN strategy for coverage, capacity and cost control
  • Figure 13: GCash – Globe’s text-based payments service
  • Figure 14: PowerOn – SingTel’s on-demand business services
  • Figure 15: Telefonica’s Full-service Telco 2.0 strategy
  • Figure 16: Vodafone – main messages are about being an efficient data pipe
  • Figure 17: Collaboration with other operators key to smart services strategy
  • Figure 18: Verizon Wireless and Skype offering
  • Figure 19: Content delivery with and without a CDN
  • Figure 20: CDN benefits to consumers are substantial
  • Figure 21: Cash Returns on Invest Capital of different Telco 2.0 opportunity areas
  • Figure 22: The benefits of smart to a MNO are tangible and significant
  • Figure 23: Telco 2.0 Survey – benefits of smart to MNOs
  • Figure 24: Telco 2.0 survey – MNO chances of success with smart strategies
  • Figure 25: Telco 2.0 survey – lots of moving parts required for ‘smartness’
  • Figure 26: Telco 2.0 survey – Differentiation via smart services is particularly challenging
  • Figure 27: Telco 2.0 survey – Implementing changes is challenging
  • Figure 28: Telco 2.0 survey – Prioritising smart implementation activities


Full Article: QQ: China’s Monster ‘Facebook’ – on a screen near you soon

Summary: An analysis of QQ.com – a profitable Chinese social networking and instant messaging service with 1 billion usernames, 75 million peak concurrent users, and plans to grow beyond China.

Introduction

The world is full of fast-growing, hyper-fashionable social networking and user-generated content plays. Almost to a man, they lack one thing – profits, or even revenues. An English-speaking technology media and analyst/investor community obsessed by the US West Coast has practically ignored QQ.com, one example of spectacular success, because it’s Chinese.

A Profitable and Valuable Social Network

At the 30th of June, Tencent (QQ’s owners) had thrown off RMB993 million (US$145 million) in free cash in six months, even after spending RMB1.9bn in CAPEX and a further RMB593 million in financing costs. For comparison, Facebook went marginally cashflow positive for the first time in August and isn’t yet profitable.

The bottom line is impressive too; at the last count, Tencent’s gross margin was at 67.3% and net margin was 41.75% – this smashes HP’s investment criterion of “fascinating margins”, i.e. 45% gross, and Iliad’s 70% ROI on new fibre deployment. We previously estimated the gross margin for October 2008 as 63.5%, so it appears that things have consistently been going well for QQ.

The shares (listed in Hong Kong) have gone from HK$60 to 120 since April, showing that this performance is also attracting plenty of demand from investors – albeit at a somewhat toppy price/earnings ratio of over 50.

Nearly a Billion ‘Users’

There were 990 million user identities on QQ as at the 30th of June, 2009. Given the current growth rate, the billionth user will almost certainly be announced in the next quarterly results – but a nontrivial percentage of these are inactive, are multiple aliases, or are spambots. [NB. This is true of all IM communities except, perhaps, for the 17 million users of IBM Lotus Notes Sametime inside their enterprise firewalls, as we pointed out in the Consumer Voice & Messaging 2.0 strategy report.]

As impressive as this is, instant messaging user bases are usually only weakly bound to the service, they are usually non-paying, and many people have multiple usernames. A more useful metric is peak concurrent users – the maximum number of users simultaneously logged in during the period in question. To be counted, a user name has to be active in that they are online, so it’s reasonable to deduce that they exist. It doesn’t prove that they are a human being (or for that matter a useful application rather than a pest); however, whether or not a logged-in user is human, they are consuming system resources.

So, measuring peak concurrent users provides us both with better data on uptake and a more useful indicator of capacity related costs. It’s a standard telecommunications engineering principle to “provision for the peak” – that is to say, it’s useless to build a network with only sufficient capacity for the average traffic, as 50% of the time it will be congested and probably non-functional through overload. To be available, the system must supply enough spare capacity to handle the peaks in demand. Peak load determines scale, and hence cost.

In 2008, at various times, QQ’s parent company Tencent claimed to have between 355 and 570 million users. At the end of June, 2009, the user count stood at 990 million – so the nominal user base had roughly doubled. In 2008, peak concurrent users were 45.3 million, growing to 65 million in June 2009. According to QQ.com’s live statistics readout (you can watch it grow in real time here), the record at time of writing was 79 million. According to Alexa, 3.26% of global Web users visited one of the various qq.com sites in September 2009.

qq-growth.png

For comparison, Skype’s all-time peak concurrent user count is 15 million, although it has the advantage of using user-provided infrastructure, whereas QQ has a client-server architecture and therefore a constant need for rack-space.

Not just users, but Paying Users

In 2007, out of 12 million peak concurrent users, 7.3 million had spent money with QQ, or to put it another way, 61% of verifiable QQ users were buying value-added services. (How many mobile operators can claim that?)

In March, 2009, we thought it unlikely that this high proportion would continue to pay as the service grew – and that it was quite possible that the 7.3 million earlier payers were dominated by early adopters and power users, so that future recruits would be less committed to the community, less geeky, and lower-income.

However, when Tencent’s Q1 results appeared at the end of March, 36.9 million users had purchased value-added services during the quarter, growing at a monthly rate of 8.4% to reach 40 million by the end of June. This latter figure was against a concurrent user base of 65 million, meaning that 62% of concurrent users were paying users.

We think this is an impressively high proportion at such volumes, and suggests that the revenue may scale reasonably well as it grows penetration further. As one might expect the cost model of such a volume business to scale efficiently, this implies further prospects of profitability. It is likely that such thoughts are one of the influences on the aforementioned growth in QQ’s share valuation.

So, how did they do it?


qq-cpf.png

In our Serving the Digital Generation Strategy Report, we identified a list of key factors that anyone who wants to attract the customer of the future would have to address, which together describe what we call the participation imperative. Specifically, four axes define the customer’s aims:

  1. To interact socially with a peer group
  2. To personalise and customise their environment
  3. To express creativity – e.g. user generated content
  4. To maintain privacy/anonymity or seek notoriety

These require and depend upon four key affordances:

  1. Portability – broad ability to work across multiple PCs, mobiles
  2. Payments – virtual currencies, transactions
  3. Feedback – ratings, comments, discussion, personalisation, hackable APIs
  4. A directory – to find other people

We assess that QQ hits 7 out of 8 criteria squarely. Really, the only one they don’t cover is privacy – although they do have rich presence-and-availability control, it’s in the nature of such a community that going offline could be a noticeable act, and there have been problems with the Public Security Bureau (Chinese secret police).

NB. The Customer of the Future can be a complex and powerful character. When the Shanghai PSB demanded that QQ filter references to the Diayou islands (a controversial nationalist cause in China), the ensuing user revolt caused even the PSB to back off.]

QQ caters to user creativity and the need for personalisation much more deeply than most social networks with the possible exception of Facebook. Although officially proprietary, the system API is documented and QQ, the company, positively encourages a hacker ecosystem of interesting new applications. This goes some way beyond the skins and avatars most socnets offer. Similarly, you can’t offer more effective feedback to more advanced users than the ability to tinker with the works. Portability is well catered for – there are multiple client applications, SMS integration, various mobile clients, and the Web site.

Print your own Digital Money

QQ’s in-world digital currency is no trivial add-on. QQ derives revenue from selling applications, other in-game goods, and extra services such as a blog, games, and a streaming music service, in return for its internal digital currency. This market creates a sink for the digital currency, and therefore gives it value, which creates a further demand for it as a gift and reputation good. It shares revenue from the store with the creators of in-game goods, thus feeding user creativity.

In Telco 2.0 terms, QQ’s business model is collecting money from the downstream side and subsidising the upstream partners, in order to encourage the creation of saleable goods and the purchase of digital currency. In return for their participation, users get the core functions of the directory and the messaging layer to service their peer group and burnish their on-line identity.

In-World Currency dwarfs Advertising

Although QQ also does contextual advertising, its core business is the in-world economy. We remarked back in March that the ad business was overshadowed by the VAS business, and this is even more true now. Online advertising grew just under 10% year-on-year, but now makes up just 9% of total revenues, falling from 11%. Internet VAS revenues were up 107% and mobile VAS was up 38%.

In part, this is the unavoidable downside of being hackable; advertising is a tax on your attention, so some people will want to be rid of it. Just as many Mozilla Firefox users install Adblock Plus to screen out Web advertising, multiple unofficial QQ clients exist that strip the ads. But if the users buy the clients from the QQ Store, who’s complaining?

QQ’s ‘Two-Sided’ Business Model Strategy

We’ve identified three types of generic ‘two-sided’ business model strategy, and concluded that the most successful companies were those who operated at the creative edge between each type.

  • Strategy One involves giving away services before and after a transaction, and collecting a percentage of the transaction. Think Amazon – or a casino.
  • Strategy Two involves giving something away to create a trading hub, then selling something to the crowd. Think of the original Lloyds’ Coffee House – it didn’t write marine insurance itself, it sold coffee to the insurance brokers, who came for the liquidity and rumours, and stayed for the coffee.
  • Strategy Three involves selling access for third parties to the trading hub – like BAA plc renting shops at Heathrow Airport, or Google giving away a whole range of services in order to create inventory it can sell adverts next to.

QQ would initially appear to straddle Strategies Two (selling to the crowd) and Three (charging for access) in the two-sided business model. But the domination of in-world trade over advertising in its P&L statement suggests something else – much of what it sells to the crowd originates in the crowd. Isn’t this an example of the Amazon-like Strategy One, facilitating transactions in return for a turn on the deal? If so, they’ve brought off the impressive feat of exploiting creative ambiguity between all three.

Next: your market?

Where does QQ go from here? The answer appears to be “right here” – in August 2009, Tencent launched an English-language portal (imqq.com). Interestingly, the site is marketed directly at business, which is an extension of a strategy shift they have already undertaken in China. For some time, Tencent has been marketing a version of the client at business users which borrows the look-and-feel of Microsoft Live Messenger (apparently being boring can be a valid strategy).

The business version of QQ is paid for – sensibly in our view, Tencent don’t expect small companies to be spending much time trying to achieve legendary status in the QQ user community. As (supposed) serious, responsible adults, they’re meant to have a secure identity and reputation already, so they’re not likely to contribute that much to the in-world economy by trying to burnish them. Therefore, a traditional, one-sided model is being used to derive revenue from this submarket.

Conclusion: Watch with Care

Our conclusion is at this stage that the Telcos who aren’t yet familiar with QQ should keep a close watch on them in both home and away markets. At a minimum there’s a lot to be learned from how this smart and complex operator employs the ‘two-sided’ business models. At other extremes are competitor threat and partner opportunity scenarios that we’ll be looking at in more depth in our future analysis.

Even though there are a lot of mobile industry execs with scars from trying to transplant successes from (usually) Japan into WENA (Western Europe & North American) markets, complacency would be extremely unwise faced with a potential competitor that has demonstrated such a deft grasp of two-sided business models, such a close understanding of user needs, and such a solid base of competence in high scalability Internet engineering.

And Finally…

Bill Gates recently gave a speech in which he claimed that two out of the five most profitable firms in China “don’t pay for their software”. He was telling the truth, in a sense; a quick “curl -i im.qq.com” demonstrates that Tencent isn’t paying a penny for its server software – the site is served with Apache running on BSD Unix machines. That may not be what Bill meant, but perhaps he should have.

Full Article: The Digital Generation: Introducing the Participation Imperative Framework

It’s a natural inclination to imagine that the difference between young people and their elders is simply that they’re young. But at times of rapid technological or social change, quite often, nothing could be more wrong. Instead, patterns of behaviour and culture that you might assume are the caprices of youth will last a lifetime and will become the conservative norm that the youth of the future will rebel against.


Serving the Digital Generation: Innovation for a new breed of customers is Telco 2.0’s attempt to characterise future customers and explore what operators should be doing to better serve them. Statistically speaking, the customer of the future is already with us, in the form of Chinese, South Korean and Japanese youngsters, and is a user of at least one of many social networks, games, and virtual world applications that have sprung up in the last few years. In the report, we analyse a whole range of such services in order to understand the business models and product features that have succeeded.


We identified a number of major factors and new opportunities that constrain and liberate the customer of the future. On one hand, parental paranoia, rapid urbanisation, and proliferating surveillance systems have led to a public space that is ever more restrictive for the young; on the other hand, the digital world has created huge opportunities to escape this and to pursue what we describe as the ’Participation Imperative’. We have developed a framework to help service providers clarify these user needs and how to serve them.


An Introduction to the Participation Imperative Framework?

graf-1.png


People have a psychological need either to build their identity or to participate vicariously in the identity of others (often through a group identity). In the report, we analysed the innovation processes of operators and other providers, as well as the outputs of this process – products and services – based on the degree to which they help the customer of the future:

  • To interact with a peer group

  • To personalise and exert control over their environment

  • To express creativity

  • To maintain privacy/anonymity or seek notoriety

These, in turn, require certain enabling factors:

  • A directory – find other people

  • Feedback – comments, discussion, personalisation, hackable APIs

  • Portability – working across multiple PCs, mobiles

  • Transaction and payments – virtual currencies

graf-2.png

From Participation Imperative Framework to the Two-sided Business Model


Going a step further, we introduce the concept of three basic strategies for two-sided business models:


Strategy One: Give services away up to the point at which a transaction occurs. Amazon Marketplace gives free access to its platform for merchants until they make a sale when they pay for billing and payments services, logistics and distribution etc.


Strategy Two: Subsidise users to build scale and selling other products to them in the as a complement to the free service. The original Lloyds’ Coffee House served this purpose – people were meeting to spread risk and paid for coffee while they did this.


Strategy Three: Charge others for access to the crowd of users you have created through giving away cheap or free services. Google is the classic example here – free search has resulted in billions of Googlers and advertisers are prepared to pay to reach them.


The Participation Imperative and two-sided business model in practice: Tencent QQ


Companies who design their products to meet these needs and integrate more than one of the three strategies have an excellent chance of success. Take QQ, for example, the Chinese IM community-cum-Web portal. IM network user base figures are notoriously vacuous – the services are provided free, many users have multiple accounts, an unknown but non-zero percentage of accounts have multiple users or are used by machines, and there is little stickiness. All these caveats apply to QQ’s claimed total user base, which ranges between 355 million and 570 million accounts. But a much more reliable number is the peak concurrent user base, and a genuinely interesting one is the number of users who actually spent real money.


graf-3.png

In 2007, the maximum concurrent user figure was 12.3 million; that year, 7.3 million users actually spent money at QQ, or 60 per cent of the lower bound on the user base. This is a much better performance than practically any other IM community or Web social network. In the quarter to October, 2008, the result was profits – profits! – of RMB775m on revenue of RMB2bn, a gross margin of 63.5%! Last year’s peak user figure was 45.3 million, and if the same proportion of sign-ups were converted to sales, this would imply 27 million paying users and an annual ARPU of roughly £10. This is far below even the most bleeding-edge emerging market GSM operators – about one sixth – but then, it’s very likely that a GSM network serving 27 million subscribers would be using more than six times the capital QQ absorbs.


How are they achieving this, when most social-network and IM products aren’t just pre-profits but pre-revenues and indeed pre-money in general?


QQ manages to hit essentially all the elements of the participation imperative framework – creativity, peer-group, personalisation, portability, payments, feedback, and directory. As well as the usual avatars, skins, etc, QQ is relatively open technically speaking and positively encourages its users to invent interesting uses for it (although there has been some conflict about this). Not just that, but it has a business model that lets user innovators profit from their work, by distributing it through the QQ store, which shares the revenue between QQ and the creator – just like the Google App Store. You cannot really do better on creativity and personalisation than that, and it’s telling that user feedback is effective enough that the management has even ignored demands from the Public Security Bureau when the users were sufficiently angry. It’s portable too – there is a version for Symbian and it anyway has SMS interworking.


Obviously, selling apps implies buying them. Like so many games, virtual worlds, and social networks, there is an internal virtual currency. These always face the difficulty of making sure that there is a steady demand for the currency, and specifically, that the demand for currency inside the game exceeds the amount users want to convert back into real currency – otherwise, the owners are faced with a steady cash drain. One of the purposes of selling premium services (blogs, games, and a streaming music service) and apps, avatars and the like is to create a demand for the currency – once it can be used to buy things, its value as a gift or reputation good greatly increases, and so does the demand for it.


This is classically two-sided – QQ gives away the directory and messaging elements of its peer-group play, so as to create a crowd to sell virtual goods to. In a further twist, it’s passing some of the sales revenue on to encourage user creativity. So far, it’s a neat hybrid of Strategies One and Two. Lloyds’ Coffee House wasn’t, after all, in the marine insurance business itself to begin with – it sold coffee. Here, QQ is selling to the crowd, but it is also facilitating transactions between user innovators and others in return for a transaction fee, like Amazon. And QQ shows signs of being very nimble in identifying the different sides – for example, it also offers a paid-for service for business users which is, amusingly, branded “Tencent Messenger” and skinned to look like Microsoft Live Messenger.


This is important because the target market probably isn’t interested in building an identity by impressing the QQ community, and probably won’t spend extended periods of time surfing the community at random – so their other strategies, in-world sales and contextual advertising, aren’t applicable. QQ has identified a segment of their user base that really belongs to the generation before – the e-mail generation, as it were – and realised that a more standard retail strategy is appropriate.


As far as Strategy Three goes, ads seem to be the default option for monetisation globally but, so far, only Google has been a real hit. QQ carries ads, but a non-trivial percentage of users are using unofficial clients created by the hacker ecosystem to filter them out – hence there’s a degree of tension with the innovators. However, QQ risks throwing the baby out with the bathwater because 66% of revenue originates from sales of applications, goods and premium services, compared to 11% from advertising. Further, sales revenue is growing at around 90%, better than the business as a whole, whereas ad revenue is growing at 70%, which means it’s actually shrinking in importance to the company.


Instead, QQ is beginning to look at virtual-real hybridisation as a source of future growth – there is already a streaming music service, and they recently started a dating site.