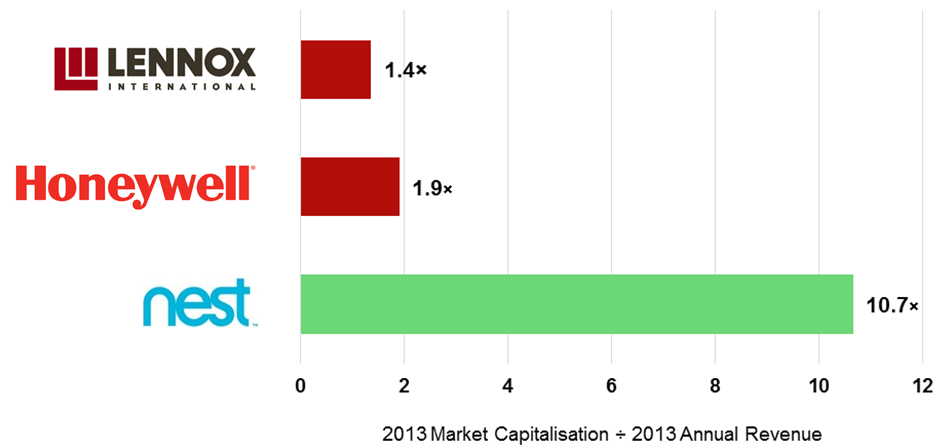
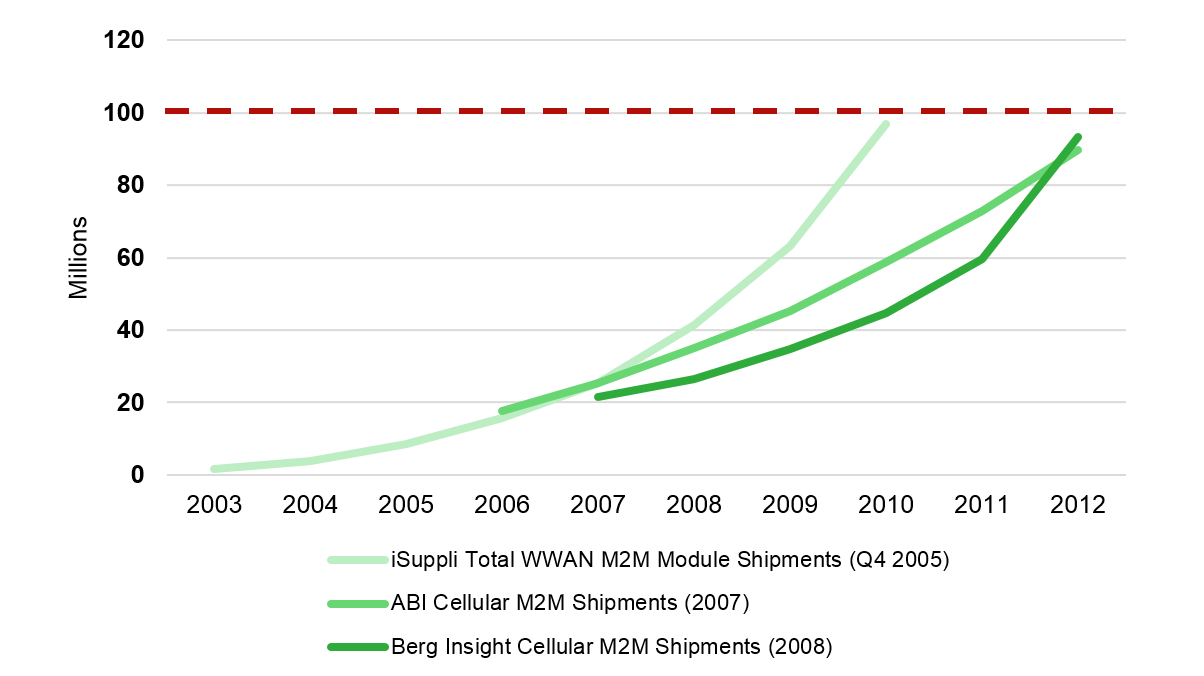
The Internet of Things: Impact on M2M, where it’s going, and what to do about it?

Introduction

From RFID in the supply chain to M2M today

The ‘Internet of Things’ first appeared as a marketing term in 1999 when it was applied to improved supply-chain strategies, leveraging the then hot-topics of RFID and the Internet.

Industrial engineers planned to use miniaturised, RFID tags to track many different types of asset, especially relatively low cost ones. However, their dependency on accessible RFID readers constrained their zonal range. This also constrained many such applications to the enterprise sector and within a well-defined geographic footprint.

Modern versions of RFID labelling have expanded the addressable market through barcode and digital watermarking approaches, for example, while mobile has largely removed the zonal constraint. In fact, mobile’s economies of scale have ushered in a relatively low-cost technology building block in the form of radio modules with local processing capability. These modules allow machines and sensors to be monitored and remotely managed over mobile networks. This is essentially the M2M market today.

M2M remained a specialist, enterprise sector application for a long time. It relied on niche, systems integration and hardware development companies, often delivering one-off or small-scale deployments. For many years, growth in the M2M market did not meet expectations for faster adoption, and this is visible in analyst forecasts which repeatedly time-shifted the adoption forecast curve. Figure 1 below, for example, illustrates successive M2M forecasts for the 2005-08 period (before M2M began to take off) as analysts tried to forecast when M2M module shipment volumes would breach the 100m units/year hurdle:

Figure 1: Historical analyst forecasts of annual M2M module shipment volumes

Source: STL Partners, More With Mobile

Although the potential of remote connectivity was recognised, it did not become a high-volume market until the GSMA brought about an alignment of interests, across mobile operators, chip- and module-vendors, and enterprise users by targeting mobile applications in adjacent markets.

The GSMA’s original Embedded Mobile market development campaign made the case that connecting devices and sensors to (Internet) applications would drive significant new use cases and sources of value. However, in order to supply economically viable connected devices, the cost of embedding connectivity had to drop. This meant:

  • Educating the market about new opportunities in order to stimulate latent demand
  • Streamlining design practices to eliminate many layers of implementation costs
  • Promoting adoption in high-volume markets such as automotive, consumer health and smart utilities, for example, to drive economies of scale in the same manner that led to the mass-adoption of mobile phones

The late 2000’s proved to be a turning point for M2M, with the market now achieving scale (c. 189m connections globally as of January 2014) and growing at an impressive rate (c. 40% per annum). 

From M2M to the Internet of Things?

Over the past 5 years, companies such as Cisco, Ericsson and Huawei have begun promoting radically different market visions to those of ‘traditional M2M’. These include the ‘Internet of Everything’ (that’s Cisco), a ‘Networked Society’ with 50 billion cellular devices (that’s Ericsson), and a ‘Cellular IoT’ with 100 billion devices (that’s Huawei).

Figure 2: Ericsson’s Promise: 50 billion connected ‘things’ by 2020

Source: Ericsson

Ericsson’s calculation builds on the idea that there will be 3 billion “middle class consumers”, each with 10 M2M devices, plus personal smartphones, industrial, and enterprise devices. In promoting such visions, the different market evangelists have shifted market terminology away from M2M and towards the Internet of Things (‘IoT’).

The transition towards IoT has also had consequences beyond terminology. Whereas M2M applications were previously associated with internal-to-business, operational improvements, IoT offers far more external market prospects. In other words, connected devices allow a company to interact with its customers beyond its strict operational boundaries. In addition, standalone products can now deliver one or more connected services: for example, a connected bus can report on its mechanical status, for maintenance purposes, as well as its location to deliver a higher quality, transit service.

Another consequence of the rise of IoT relates to the way that projects are evaluated. In the past, M2M applications tended to be justified on RoI criteria. Nowadays, there is a broader, commercial recognition that IoT opens up new avenues of innovation, efficiency gains and alternative sources of revenue: it was this recognition, for example, that drove Google’s $3.2 billion valuation of Nest (see the Connected Home EB).

In contrast to RFID, the M2M market required companies in different parts of the value chain to share a common vision of a lower cost, higher volume future across many different industry verticals. The mobile industry’s success in scaling the M2M market now needs to adjust for an IoT world. Before examining what these changes imply, let us first review the M2M market today, how M2M service providers have adapted their business models and where this positions them for future IoT opportunities.

M2M Today: Geographies, Verticals and New Business Models

Headline: M2M is now an important growth area for MNOs

The M2M market has now evolved into a high volume and highly competitive business, with leading telecoms operators and other service providers (so-called ‘M2M MVNOs’ e.g. KORE, Wyless) providing millions of cellular (and fixed) M2M connections across numerous verticals and applications.

Specifically, 428 MNOs were offering M2M services across 187 countries by January 2014 – 40% of mobile network operators – and providing 189 million cellular connections. The GSMA estimates the number of global connections to be growing by about 40% per annum. Figure 3 below shows that as of Q4 2013 China Mobile was the largest player by connections (32 million), with AT&T second largest but only half the size.

Figure 3: Selected leading service providers by cellular M2M connections, Q4 2013


Source: Various, including GSMA and company accounts, STL Partners, More With Mobile

Unsurprisingly, these millions of connections have also translated into material revenues for service providers. Although MNOs typically do not report M2M revenues (and many do not even report connections), Verizon reported $586m in ‘M2M and telematics’ revenues for 2014, growing 47% year-on-year, during its most recent earnings call. Moreover, analysis from the Telco 2.0 Transformation Index also estimates that Vodafone Group generated $420m in revenues from M2M during its 2013/14 March-March financial year.

However, these numbers need to be put in context: whilst $500m growing 40% YoY is encouraging, this still represents only a small percentage of these telcos’ revenues – c. 0.5% in the case of Vodafone, for example.

Figure 4: Vodafone Group enterprise revenues, implied forecast, FY 2012-18


Source: Company accounts, STL Partners, More With Mobile

Figure 4 uses data provided by Vodafone during 2013 on the breakdown of its enterprise line of business and grows these at the rates which Vodafone forecasts the market (within its footprint) to grow over the next five years – 20% YoY revenue growth for M2M, for example. Whilst only indicative, Figure 4 demonstrates that telcos need to sustain high levels of growth over the medium- to long-term and offer complementary, value added services if M2M is to have a significant impact on their headline revenues.

To do this, telcos essentially have three ways to refine or change their business model:

  1. Improve their existing M2M operations: e.g. new organisational structures and processes
  2. Move into new areas of M2M: e.g. expansion along the value chain; new verticals/geographies
  3. Explore the Internet of Things: e.g. new service innovation across verticals and including consumer-intensive segments (e.g. the connected home)

To provide further context, the following section examines where M2M has focused to date (geographically and by vertical). This is followed by an analysis of specific telco activities in 1, 2 and 3.


  • Executive Summary
  • Introduction
  • From RFID in the supply chain to M2M today
  • From M2M to the Internet of Things?
  • M2M Today: Geographies, Verticals and New Business Models
  • Headline: M2M is now an important growth area for MNOs
  • In-depth: M2M is being driven by specific geographies and verticals
  • New Business Models: Value network innovation and new service offerings
  • The Emerging IoT: Outsiders are raising the opportunity stakes
  • The business models and profitability potentials of M2M and IoT are radically different
  • IoT shifts the focus from devices and connectivity to data and its use in applications
  • New service opportunities drive IoT value chain innovation
  • New entrants recognise the IoT-M2M distinction
  • IoT is not the end-game
  • ‘Digital’ and IoT convergence will drive further innovation and new business models
  • Implications for Operators
  • About STL Partners and Telco 2.0: Change the Game
  • About More With Mobile


  • Figure 1: Historical analyst forecasts of annual M2M module shipment volumes
  • Figure 2: Ericsson’s Promise: 50 billion connected ‘things’ by 2020
  • Figure 3: Selected leading service providers by cellular M2M connections, Q4 2013
  • Figure 4: Vodafone Group enterprise revenues, implied forecast, FY 2012-18
  • Figure 5: M2M market penetration vs. growth by geographic region
  • Figure 6: Vodafone Group organisational chart highlighting Telco 2.0 activity areas
  • Figure 7: Vodafone’s central M2M unit is structured across five areas
  • Figure 8: The M2M Value Chain
  • Figure 9: ‘New entrant’ investments outstripped those of M2M incumbents in 2014
  • Figure 10: Characterising the difference between M2M and IoT across six domains
  • Figure 11: New business models to enable cross-silo IoT services
  • Figure 12: ‘Digital’ and IoT convergence


Connected Home: Telcos vs Google (Nest, Apple, Samsung, +…)

Introduction 

On January 13th 2014, Google announced its acquisition of Nest Labs for $3.2bn in cash consideration. Nest Labs, or ‘Nest’ for short, is a home automation company founded in 2010 and based in California which manufactures ‘smart’ thermostats and smoke/carbon monoxide detectors. Prior to this announcement, Google already had an approximately 12% equity stake in Nest following its Series B funding round in 2011.

Google is known as a prolific investor and acquirer of companies: during 2012 and 2013 it spent $17bn on acquisitions alone, which was more than Apple, Microsoft, Facebook and Yahoo combined (at $13bn) . Google has even been known to average one acquisition per week for extended periods of time. Nest, however, was not just any acquisition. For one, whilst the details of the acquisition were being ironed out Nest was separately in the process of raising a new round of investment which implicitly valued it at c. $2bn. Google, therefore, appears to have paid a premium of over 50%.

This analysis can be extended by examining the transaction under three different, but complementary, lights.

Google + Nest: why it’s an interesting and important deal

  • Firstly, looking at Nest’s market capitalisation relative to its established competitors suggests that its long-run growth prospects are seen to be very strong

At the time of the acquisition, estimates placed Nest as selling 100k of its flagship product (the ‘Nest Thermostat’) per month . With each thermostat retailing at c. $250 each, this put its revenue at approximately $300m per annum. Now, looking at the ratio of Nest’s market capitalisation to revenue compared to two of its established competitors (Lennox and Honeywell) tells an interesting story:

Figure 1: Nest vs. competitors’ market capitalisation to revenue


Source: Company accounts, Morgan Stanley

Such a disparity suggests that Nest’s long-run growth prospects, in terms of both revenue and free cash flow, are believed to be substantially higher than the industry average. 
  • Secondly, looking at Google’s own market capitalisation suggests that the capital markets see considerable value in (and synergies from) its acquisition of Nest

Prior to the deal’s announcement, Google’s share price was oscillating around the $560 mark. Following the acquisition, Google’s share price began averaging closer to $580. On the day of the announcement itself, Google’s share price increased from $561 to $574 which, crucially, reflected a $9bn increase in market capitalisation . In other words, the value placed on Google by the capital markets increased by nearly 300% of the deal’s value. This is shown in Figure 2 below:

Figure 2: Google’s share price pre- and post-Nest acquisition


Source: Google Finance

This implies that the capital markets either see Google as being well positioned to add unique value to Nest, Nest as being able to strongly complement Google’s existing activities, or both.

  • Thirdly, viewing the Nest acquisition in the context of Google’s historic and recent M&A activity shows both its own specific financial significance and the changing face of Google’s acquisitions more generally

At $3.2bn, the acquisition of Nest represents Google’s second largest acquisition of all time. The largest was its purchase of Motorola Mobility in 2011 for $12.5bn, but Google has since reached a deal to sell the majority of its assets (excluding its patent portfolio) to Lenovo for $2.9bn. In other words, Nest is soon to become Google’s largest active, inorganic investment. Google’s ten largest acquisitions, as well as some smaller but important ones, are shown in Figure 3 below:

Figure 3: Selected acquisitions by Google, 2003-14

Source: Various

Beyond its size, the Nest acquisition also continues Google’s recent trend of acquiring companies seemingly less directly related to its core business. For example, it has been investing in artificial intelligence (DeepMind Technologies), robotics (Boston Dynamics, Industrial Perception, Redwood Robotics) and satellite imagery (Skybox Imaging).

Three questions raised by Google’s acquisition of Nest

George Geis, a professor at UCLA, claims that Google develops a series of metrics at an early stage which it later uses to judge whether or not the acquisition has been successful. He further claims that, according to these metrics, Google on average rates two-thirds of its acquisitions as successful. This positive track record, combined with the sheer size of the Nest deal, suggests that the obvious question here is also an important one:

  • What is Nest’s business model? Why did Google spend $3.2bn on Nest?

Nest’s products, the Nest Thermostat and the Nest Protect (smoke/carbon monoxide detector), sit within the relatively young space referred to as the ‘connected home’, which is defined and discussed in more detail here. One natural question following the Nest deal is whether Google’s high-profile involvement and backing of a (leading) company in the connected home space will accelerate its adoption. This suggests the following, more general, question:

  • What does the Nest acquisition mean for the broader connected home market?

Finally, there is a question to be asked around the implications of this deal for Telcos and their partners. Many Telcos are now active in this space, but they are not alone: internet players (e.g. Google and Apple), big technology companies (e.g. Samsung), utilities (e.g. British Gas) and security companies (e.g. ADT) are all increasing their involvement too. With different strategies being adopted by different players, the following question follows naturally:

  • What does the Nest acquisition mean for telcos?


  • Executive Summary
  • Introduction
  • Google + Nest: why it’s an interesting and important deal
  • Three questions raised by Google’s acquisition of Nest
  • Understanding Nest and Connected Homes
  • Nest: reinventing everyday objects to make them ‘smart’
  • Nest’s future: more products, more markets
  • A general framework for connected home services
  • Nest’s business model, and how Google plans to get a return on its $3.2bn investment 
  • Domain #1: Revenue from selling Nest devices is of only limited importance to Google
  • Domain #2: Energy demand response is a potentially lucrative opportunity in the connected home
  • Domain #3: Data for advertising is important, but primarily within Google’s broader IoT ambitions
  • Domain #4: Google also sees Nest as partial insurance against IoT-driven disruption
  • Domain #5: Google is pushing into the IoT to enhance its advertising business and explore new monetisation models
  • Implications for Telcos and the Connected Home
  • The connected home is happening now, but customer experience must not be overlooked
  • Telcos can employ a variety of monetisation strategies in the connected home
  • Conclusions


  • Figure 1: Nest vs. competitors’ market capitalisation relative to revenue
  • Figure 2: Google’s share price, pre- and post-Nest acquisition
  • Figure 3: Selected acquisitions by Google, 2003-14
  • Figure 4: The Nest Thermostat and Protect
  • Figure 5: Consumer Electronics vs. Electricity Spending by Market
  • Figure 6: A connected home services framework
  • Figure 7: Nest and Google Summary Motivation Matrix
  • Figure 8: Nest hardware revenue and free cash flow forecasts, 2014-23
  • Figure 9: PJM West Wholesale Electricity Prices, 2013
  • Figure 10: Cooling profile during a Rush Hour Rewards episode
  • Figure 11: Nest is attempting to position itself at the centre of the connected home
  • Figure 12: US smartphone market share by operating system (OS), 2005-13
  • Figure 13: Google revenue breakdown, 2013
  • Figure 14: Google – Generic IoT Strategy Map
  • Figure 15: Connected device forecasts, 2010-20
  • Figure 16: Connected home timeline, 1999-Present
  • Figure 17: OnFuture EMEA 2014: The recent surge in interest in the connected home is due to?
  • Figure 18: A spectrum of connected home strategies between B2C and B2B2C (examples)
  • Figure 19: Building, buying or partnering in the connected home (examples)
  • Figure 20: Telco 2.0™ ‘two-sided’ telecoms business model