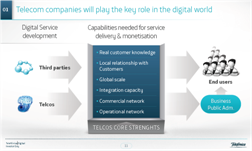
Samsung and Google versus Apple?
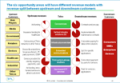
Samsung: slipping and sliding

In 2013, it looked like Samsung Electronics could challenge Apple’s hegemony at the high-end of the handset market. The Korean giant’s flagship Galaxy smartphones were selling well and were equipped with features, such as large high definition displays and NFC, which Apple’s iPhones lacked.

But in 2014, Samsung’s Galaxy range lost some of is lustre – the latest flagship model, the S5, amounts to a fairly modest evolution of its predecessor, the S4. The Galaxy S5 underwhelmed some reviewers who criticised its look and feel, hefty price tag and erratic fingerprint sensor. Meanwhile, Apple launched two new high-spec handsets – the iPhone 6 and iPhone 6 Plus. These phones markedly close the hardware gap and fill a significant hole in Apple’s portfolio by venturing into the so-called phablet market, which sits between smartphones and tablets. Now that Apple has grasped consumers’ desire for larger form factors and bigger displays, Samsung may struggle to hold on to high-end buyers.

After out-innovating Apple in some respects in recent years, Samsung is now on the back foot again. While Apple is broadly back to parity in terms of hardware, Samsung continues to trail the Californian company in terms of software and services. Most reviewers still regard the iPhone as the gold standard when it comes to user experience.

It is now well understood that the iPhone’s lead is largely down to Apple’s absolute control over hardware and software. Samsung and other vendors selling handsets running Google’s Android operating system have struggled to achieve the slick integration between hardware and software exemplified by Apple’s iPhones. Samsung has often exacerbated this issue by presenting customers with a confusing mix of overlapping Google and Samsung apps on its Galaxy handsets.

Samsung’s Annus Miserablis

In the second quarter of 2014, research firm IDC estimates that Samsung shipped more than 18 million Galaxy S5s, along with nine million S3 and S4 units. That implies Samsung shipped 27 million models in its flagship Galaxy S range, compared with 35 million iPhones distributed by Apple. For the third quarter, IDC didn’t break out Galaxy sales, but the research firm flagged “cooling demand for [Samsung’s] high-end devices,” adding: “Although Samsung has long relied on its high-end devices, its mid-range and low-end models drove volume for the quarter and subsequently drove down average selling prices.”

But Samsung can’t afford to cede more of the high end of the market to Apple. The Korean giant is facing increasingly intense competition from low cost Chinese manufacturers in the low end and the mid-range segments of the handset market. The net result has been a marked decline in Samsung’s market share and falling revenues. As the global smartphone market has expanded to serve people in lower income groups, both Samsung and Apple have lost market share to the likes of Xiaomi, Lenovo and Huawei. But Samsung is suffering far more than Apple, whose devices are squarely aimed at the affluent (see Figure 3).

Figure 3: Samsung’s share of the global smartphone market share is sliding

Figure 3 Samsung's share of the global smartphone market share is sliding

source: IDC research

Worse still for Samsung, the decline in average selling prices is hitting its top line, damaging profitability and its ability to realise economies of scale. In terms of revenues, Apple is now almost as large as Samsung Electronics’ three divisions combined  and is much bigger than Samsung’s information technology and mobile (IM) division, which competes directly with Apple (see Figure 4).

Figure 4: Apple is now generating almost as much revenue as Samsung Electronics

Figure 4 Apple is now generating almost as much revenue as Samsung Electronics
Source: Financial results, Apple guidance and analyst estimates captured by www.4-traders.com

The declining performance of Samsung’s IM division has had a major impact on Samsung Electronics’ profitability. The Korean group’s operating margin is slipping back towards 10%, whereas Apple’s operating margin has stabilised at about 28%, after sliding in 2013, when it faced particularly intense competition from Samsung and the broader Android ecosystem (see Figure 5).

Figure 5: Samsung’s margins are low and going lower

Figure 5 Samsung's margins are low and going lower

Source: Financial results, Apple guidance and analyst estimates captured by www.4-traders.com

Although Samsung Electronics still generates slightly more revenue than Apple, the U.S. company is likely to make more than double the operating profit of its Korean rival in 2014 (see Figure 6).

Figure 6: Apple’s operating profits are set to be more than double those of Samsung

Figure 6 Apple's operating profits are set to be more than double those of Samsung

Source: Financial results, Apple guidance and analyst estimates captured by www.4-traders.com

Naturally, declining operating profits mean lower net profits and a less attractive proposition for investors. Samsung clearly needs to avoid slipping into a downward spiral where low profitability prevents it from investing in the research and development and the manufacturing capacity it will need to compete effectively with Apple at the high end. Apple is now generating about $20 billion more in net income than Samsung each year, meaning it has far more financial firepower than its main rival, together with a virtual blank cheque from investors (see Figure 7).

Figure 7: The gap between Apple and Samsung’s financial firepower is widening

Figure 7: The gap between Apple and Samsungs financial firepower is widening

Source: Financial results, Apple guidance and analyst estimates captured by www.4-traders.com

Samsung should also be concerned about competition from Microsoft at the high-end of the market. Another company with a surplus of cash, Microsoft has a strong strategic interest in creating compelling smartphones and tablets to shore up its position in the business software market. Now that it is developing both software and hardware in house, Microsoft may yet be able to create smartphones that provide a better user experience than many Android handsets.

In summary, Samsung’s flagging performance in the smartphone market is having a major impact on the financial performance of the group. There could be worse to come. If Samsung concedes more of the premium end of the smartphone market to Apple and possibly Microsoft, it risks competing solely on price in the low and mid segments, where its expertise in display technology and semiconductors won’t enable it to add significant value. Samsung’s margins would erode further and it would be in danger of going into the terminal decline experienced by the likes of Nokia and Motorola, which have also both led the mobile phone market in the past.

An implosion by Samsung would have grave consequences for telcos and their primary suppliers. Aside from Microsoft, the Korean conglomerate is the only company in the smartphone and tablet markets that has the resources to provide credible global competition for Apple. Although the leading Chinese smartphone makers are strong in emerging markets, they lack the brand cachet and the marketing skills to mount a serious challenge to Apple in North America and Western Europe.


  • Internet-Driven Disruption
  • Introduction
  • Executive Summary
  • Samsung: slipping and sliding
  • How will Samsung respond? 
  • The opportunities for Samsung in the smartphone market
  • The threats to Samsung in the smartphone market
  • Samsung’s next steps
  • Apple isn’t impregnable
  • Conclusions and implications for telcos
  • About STL Partners


  • Figure 1 – Apple financial firepower far outstrips that of Samsung Electronics
  • Figure 2 – How Samsung could shore up its position in the smartphone market
  • Figure 3 – Samsung’s share of the global smartphone market share is sliding
  • Figure 4 – Apple is now generating almost as much revenue as Samsung Electronics
  • Figure 5 – Samsung’s margins are low and going lower
  • Figure 6 – Apple’s operating profits are set to be more than double those of Samsung
  • Figure 7 – The gap between Apple and Samsung’s financial firepower is widening
  • Figure 8 – SWOT analysis of Samsung at the high end of the smartphone market
  • Figure 9 – Samsung Electronics is the largest investor in tech R&D worldwide
  • Figure 10 – Apple’s expanding portfolio is making life tougher for Samsung
  • Figure 11 – Potential strategic actions for Samsung in the smartphone market
  • Figure 12 – SWOT analysis of Apple in the smartphone market
  • Figure 13 – Potential strategic actions for Apple in the smartphone market


Facebook + WhatsApp + Voice: So What?

Introduction

In 2010, we predicted in our analysis Facebook: Moving into Telco Space? that Facebook would inevitably decide to move further into the communications space in order to sustain and grow its valuation. In 2011 we published a major strategy report “Dealing with the ‘Disruptors’: Google, Apple, Facebook, Microsoft/Skype and Amazon”, which charted the complex and inter-related battles and relationships between the main internet giants of the western world. It showed how they’re disrupting numerous fields, including communications, commerce, marketing – and not least each other.

In 2014 we’re launching an extension of this research into an ongoing stream of analysis on the key players to help strategists and senior decision makers navigate these complex waters. As a precursor, Facebook’s acquisition of WhatsApp shows further aspects of, and lessons from this ongoing disruption.

Market Context: two ‘killer apps’

Facebook: constantly chasing the audience

Facebook has already had to re-engineer its business model since the traumatic (and predicted) flop of the IPO. Users flocked away to mobile, and Facebook had to redesign its primary user experience in order to cope. At the same time, the advertisers who are Facebook’s real customers lost interest in the brand-building display pages that were its key advertising product.

Facebook chased the audience, developing new advertising products to fit into the context of a mobile user experience. It worked: post-IPO Facebook has succeeded in getting revenue from its mobile advertising, so much so that it made $523m in net profits on revenue of $2.6bn in Q4. But it’s worth remembering that this represents Facebook concentrating on one very specific niche business: mobile apps discovery.

Normal
0

false
false
false

EN-GB
X-NONE
X-NONE

/* Style Definitions */
table.MsoNormalTable
{mso-style-name:”Table Normal”;
mso-tstyle-rowband-size:0;
mso-tstyle-colband-size:0;
mso-style-noshow:yes;
mso-style-priority:99;
mso-style-parent:””;
mso-padding-alt:0cm 5.4pt 0cm 5.4pt;
mso-para-margin:0cm;
mso-para-margin-bottom:.0001pt;
mso-pagination:widow-orphan;
font-size:10.0pt;
font-family:”Times New Roman”,”serif”;}

In the last quarter, 53 per cent[1] of Facebook’s revenue, over $1bn, came from mobile ads. Mobile app downloads are becoming a very important segment of this. As Mark Zuckerberg said in the Q4 earnings call:

We’re finding that people also really want to buy a lot of app install ads, and that’s grown incredibly quickly and is one of the best parts of the ad work that we did over the last year


Sheryl Sandberg reiterated it later:

We are very excited about the mobile app space in general. If you look at our mobile app installation ads, we’ve really done a great job working with developers to help users discover and download their apps.


This is because app developers can expect to pay as little as $2 in advertising costs[2] for each install.

This is a significant change in the model. In Figure 1, the chart below, note especially that the mobile ads line of business starts immediately after the IPO in June, 2012, when ads in the News Feed were introduced, and accelerates further in early 2013, when mobile app ads were introduced.

Figure 1: Facebook’s rapidly growing mobile revenues
Facebook’s rapidly growing mobile revenues March 2014

Normal
0

false
false
false

EN-GB
X-NONE
X-NONE

/* Style Definitions */
table.MsoNormalTable
{mso-style-name:”Table Normal”;
mso-tstyle-rowband-size:0;
mso-tstyle-colband-size:0;
mso-style-noshow:yes;
mso-style-priority:99;
mso-style-parent:””;
mso-padding-alt:0cm 5.4pt 0cm 5.4pt;
mso-para-margin:0cm;
mso-para-margin-bottom:.0001pt;
mso-pagination:widow-orphan;
font-size:10.0pt;
font-family:”Times New Roman”,”serif”;}

This implies that revenue equivalent to roughly a quarter of app sales[1] through Apple’s iTunes App Store is going to Facebook just for ads, and much of it is advertising for apps. How long will Apple, whose app store it is, or Google, fundamentally an advertising business, put up with that before they launch something that competes?

The problem is summed up quite simply here:

“This exposes the strategic fallacy behind Facebook, which was the idea that there was going to be a monopoly on the social graph, and that Facebook was going to own it,” said Keith Rabois, a partner at venture capital firm Khosla Ventures. “That’s not true, and I don’t believe Facebook will constantly be able to buy its way out of this structural challenge.”

This pattern has been visible for a while. Rather than big multi-functional platforms, suddenly it seemed that leaner, focused, task-specific apps were in demand, notably Instagram, Snapchat, ask.fm, and Vine. It should come as no surprise that Unix-based iOS and Linux-based Android both seem to encourage app developers to do “one thing well” in the classic tradition of the core Unix/Linux utilities, with the unifying platform being the OS itself. So Facebook chased its audience again, buying Instagram.

Meanwhile, users sought out a new generation of mobile instant-messaging apps, which saw astonishingly fast growth and shocked the carrier industry with the hit to their SMS revenues. And Facebook has chased the audience again, with the WhatsApp acquisition.

WhatsApp: disrupting by doing one thing really well

WhatsApp’s user-base acceleration has been outstanding, as shown in Figure 2.

Figure 2: WhatsApp User Growth
WhatsApp User Growth March 2014

Source: Facebook

Its usage stats are equally impressive (Figure 3), as are the comparisons between WhatsApp’s and Facebook’s user engagement (Figure 4)

Figure 3: Average monthly minutes of use by market

Average monthly minutes of use by market March 2014

Source Mobidia May 2013

Figure 4: Average user screen time Facebook vs. WhatsApp (per month)
Average user screen time Facebook vs. WhatsApp (per month) March 2014

Source: Mobidia Q4 2012

WhatsApp is nothing if not a lean, focused, task-specific app that does one thing well. Its USP could be summarised as “instant messaging done right”. Its business model is simplicity itself, asking users for a dollar a year, rather than seeking advertisers or volume-billing. The simplicity, as with most simplicity, is founded on engineering excellence – WhatsApp holds the record for the most concurrent TCP sockets, 2 million, on a FreeBSD Unix server. It’s because they spent the time and money developing their highly customised fork of the open-source ejabberd XMPP server that they kept costs down to the level where their business model made sense. (There is much more information on WhatsApp technology in this High Scalability post.)

Across Europe, WhatsApp and the proliferation of other IM apps has dragged SMS pricing down until it has become a bundled, unlimited service. Vodafone, for example, bundles unlimited messaging with 1GB of data at its €29 price point.

While its appeal is not all about price, WhatsApp and other Over The Top (OTT) messaging apps capitalise on high priced markets, with much higher adoption in the markets with higher priced that we analysed in our recent Future Value of Voice and Messaging report (see Figure 5 below).

Figure 5: SMS Price vs. penetration of Top OSP Messaging Apps

SMS Price vs. penetration of Top OSP Messaging Apps March 2014

Source: Onavo, Ofcom, CMT, BNETZA, TIA, KCC, Telco accounts, STL Partners

But, as we point out in the report, price is only part of the story. Price drove the acquisition of customers, but quality retained them. WhatsApp offers a searchable, conversation-based chat history and a one-tap voice messaging function; it remains shocking to this day that it took Apple to show SMS messages as threaded conversations like e-mail.


  • Executive Summary
  • Analysis: one plus one equals…?
  • $19bn: a lot of money …or is it really?
  • Two Fundamentally Different Social Models
  • What does Facebook want to do with WhatsApp?
  • Conclusions: disruptors of the world, unite…
  • Facebook, the hub for social apps that scale?
  • Telcos: victory is empty but there are lessons in defeat
  • So what for the rest of the digital ecosystem?
  • STL Partners and the Telco 2.0™ Initiative


  • Figure 1: Facebook’s rapidly growing mobile revenues
  • Figure 2: WhatsApp User Growth
  • Figure 3: Average monthly minutes of use by market
  • Figure 4: Average user screen time Facebook vs. WhatsApp  (per month)
  • Figure 5: SMS Price vs. penetration of Top OSP Messaging Apps
  • Figure 6: Facebook’s share price March 2013 – February 2014
  • Figure 7: AT&T, Vodafone and Telefonica share prices Vs. Facebook
  • Figure 8: Voice and Messaging revenue scenarios
Call
Send SMS
Add to Skype
You’ll need Skype CreditFree via Skype

Telco 2.0 Transformation Index: Technology Survey

Summary: 150 senior execs from Vodafone, Telefonica, Etisalat, Ooredoo (formerly Qtel), Axiata and Singtel supported our technology survey for the Telco 2.0 Transformation Index. This analysis of the results includes findings on prioritisation, alignment, accountability, speed of change, skills, partners, projects and approaches to transformation. It shows that there are common issues around urgency, accountability and skills, and interesting differences in priorities and overall approach to technology as an enabler of transformation. (November 2013, Executive Briefing Service, Transformation Stream.) Telco 2.0 Transformation Index Tech Survey Cover Small
  Read in Full (Members only)   To Subscribe click here

Below are a brief extract and detailed contents from a 29 page Telco 2.0 Briefing Report that can be downloaded in full in Powerpoint slideshow format by members of the Premium Telco 2.0 Executive Briefing service and the Telco 2.0 Transformation stream here.

This report is an extract from the overall analysis for the Telco 2.0 Transformation Index, a new service from Telco 2.0 Research. Non-members can find out more about subscribing to the Briefing Service here and the Transformation Index here. There will be a world first preview of the Telco 2.0 Transformation Index at our Digital Arabia Executive Brainstorm in Dubai on 11-13th November 2013. To find out more about any of these services please email contact@telco2.net or call +44 (0) 207 247 5003.

To share this article easily, please click:


Introduction


Details of the objectives and key benefits of the overall Telco 2.0 Transformation Index can be found here, and the methodology and approach here. There’s also an example of Telefonica’s market position here.

One component of our analysis has been a survey of 150 senior execs on the reality of developing and implementing technology strategy in their organisations, and the results are now available to download to members of the Telco 2.0 Executive Briefing Service.

Key Benefits

  • The report’s highly graphical and interactive Powerpoint show format makes it extremely easy to digest and reach valuable insights quickly
  • The structure of the analysis allows the reader to rapidly and concisely assimilate the complex similarities and differences between players
  • It is underpinned with detailed and sourced numerical and qualitative data


Example charts from the report

The report analyses similarities and differences in priorities across the six players.Telco 2.0 Transformation Index - Tech Prioritisation Differences - Singtel, Axiata, Vodafone, Telefonica, Etisalat, Ooredoo


It also assesses the skills profiles of the players against different strategic areas.

Telco 2.0 Transformation Index - Technology Skills analysis, Telefonica, Vodafone, Etisalat, Ooredoo, Axiata, Singtel
Contents

To access the contents of the report, including…

  • Introduction and Methodology
  • Background – the Telco 2.0 Transformation Index
  • Executive Summary
  • Survey respondents
  • Drivers of network and IT projects
  • Degree of challenge of ‘Transformation’ by operator
  • Priority areas for Transformation by operator
  • What are the preferred project approaches for transformation?
  • Alignment of techology and commercial priorities
  • Accountability for leveraging and generating value from technology projects
  • IT Skills – ‘Telco 1.0’ Vs ‘Telco 2.0’
  • Nature of strategic partnerships by operator
  • Technology project life-cycles by operator
  • Groupings by attitude to technology as a driver of success
  • Priority areas for technological improvement or transformation

Members of the Telco 2.0 Executive Briefing Subscription Service and the Telco 2.0 Transformation stream can download the full 29 page report in interactive Powerpoint slideshow format hereNon-Members, please subscribe here. For other enquiries, please email contact@telco2.net / call +44 (0) 207 247 5003.

Telco 2.0 Transformation Index: Understanding Telefonica’s Markets and Market Position

Summary: This extract from the Telco 2.0 Transformation Index shows our analysis of Telefonica’s markets and market position, including economic and digital market maturity, regulation, customers, competition and pricing. It is one part of our overall analysis of Telefonica’s progress towards transformation to the Telco 2.0 business model. The other parts of the Telefonica analysis are: Service Proposition, Finances, Technology, Value Network, and an overall summary. Telefonica is one of the companies analysed and compared in the first tranche of analysis that also addresses Vodafone, AT&T, Verizon, Axiata, SingTel, Etisalat and Ooredoo (formerly Qtel). (August 2013, Executive Briefing Service, Transformation Stream.) Telefonica Telco 2.0 Transformation Index Small

Introduction


Details of the objectives and key benefits of the overall Telco 2.0 Transformation Index can be found here, and the methodology and approach here.

Telefonica is one of the first companies featured in our Transformation Index, and one that is viewed with great interest by others. With operating companies facing very different conditions in Europe and South America, Telefonica faces some interesting strategic challenges, and has attempted to stimulate growth through innovation with the development of Telefonica Digital.

The ‘Markets and Position’ section of the analysis puts Telefonica’s current global position, risks and opportunities in context, and is now available to download to members of the Telco 2.0 Executive Briefing Service. The rest of the analysis (covering Service Proposition, Value Network, Technology and Finances), and the analyses of the other seven companies initially covered (Vodafone, AT&T, Verizon, Etisalat, Ooredoo [formerly Qtel], Singtel and Axiata) will be published from September 2013.

Key Benefits

  • The report’s highly graphical format makes it extremely easy to digest and reach valuable insights quickly into both Telefonica’s current position and future strategic needs
  • The structure of the analysis allows the reader to rapidly and concisely assimilate the complex picture of Telefonica’s international businesses, risks and opportunities
  • It is underpinned with detailed and sourced numerical and qualitative data


Example charts from the report

The report analyses Telefonica’s market share position across markets against their regulatory strength.
Telco 2.0 Transformation Index - Market Positioning Detail


It also assesses the economic and demographic make-up of Telefonica’s markets.

Telco 2.0 Transformation Index - Market Analysis Detail Example, Telefonica

The market analyses are consolidated into an overall summary of market positioning by Operating Company, which is further refined into an assessment of strategic approach and operational performance.

Telco 2.0 Transformation Index - Market Share and Profitability Detail


Contents

To access the contents of the report, including…

  • Introduction and Methodology
  • Market Position Summary: Economic, Regulatory, Competitive and Customers
  • Summary analysis of growth, GDP, prices and economics of key markets
  • Comparison and contrasts between European and Latin American markets
  • Regulation vs EBITDA margins
  • Mobile revenue growth by market
  • Subscribers and revenues by region
  • Mari-Meko of Subscribers and Shares in key markets
  • Market Share Vs. Regulation
  • Market Vs. Telefonica Growth by national market
  • Telefonica’s commercial strategy
  • Strength of OTT entrants in Telefonica’s markets
  • Pre-Pay, Post-Pay and Churn by Market
  • Telefonica’s relative brand strength


Digital Economy: who will prosper in ‘The Great Compression’?

Summary: Value is squeezed out of industries as they become increasingly digital – i.e. accessed by mobile and online, driven by data and defined by software. We call the collective economic impact of this pressure ‘The Great Compression’. But which companies will survive and prosper – and how? 90% of the Execs at our Silicon Valley brainstorm identified ‘management mindset’ as a key factor in Telecoms, Media, Finance and Retail. (May 2013, Executive Briefing Service, Transformation Stream).

Scale of Transformation Needed April 2013

  Read in Full (Members only)   To Subscribe click here

Below are the high-level analysis and detailed contents from a 62 page Telco 2.0 Briefing Report that can be downloaded in full in PDF format by members of the Premium Telco 2.0 Executive Briefing service and the Telco 2.0 Transformation Stream here. The Digital Economy, and the changes needed to ‘management mindset’, organisation, technology, and products, will also be explored further at the EMEA Executive Brainstorm in London, 5-6 June, 2013. Non-members can find out more about subscribing here, or find out more about this and/or the Brainstorm by emailing contact@telco2.net or calling +44 (0) 207 247 5003.

To share this article easily, please click:


Introduction

Part of the New Digital Economics Executive Brainstorm series, the Silicon Valley 2013 event took place at the InterContinental Hotel in San Francisco on the 19th and 20th of March, 2013. This report covers the Digital Economy track on the first day.

Summary Analysis: who will prosper in ‘The Great Compression’?

Telecoms, telco vendors, entertainment, device makers, financial services, retailers, entertainment services, and brands in developed economies are experiencing the ‘Digital Hunger Gap’ – a shortfall of revenues versus past levels as industries become increasingly digital i.e. accessed by mobile and online, driven by data and defined by software.

Other industries are also feeling pain from the process of becoming digitised which both changes the model and the dynamics of competition. Others, like consumer goods and car manufacturing, see opportunities to enhance services with digital connectivity to build loyalty and new value. Government services and healthcare face huge cost challenges. Digital services can be of huge value here, but the challenge for third parties is how to make money when money needs to be saved.

According to the participants in the Silicon Valley brainstorm, almost every industry faces massive changes in every area of its business model, with management mindsets most in need of a dramatic overhaul, and customer relationships marginally ahead in the total of partipants thinking a dramatic or significant change is needed.

Scale of Transformation Needed April 2013

New markets are emerging rapidly, particularly in Asia. However, many companies from North America and EMEA lack depth in local knowledge and face skills, cultural and political barriers to entry, and the mindset challenge of operating in a radically different economic environment.

As a result of the combined difficulties of growth in home markets and expansion abroad, there will be massive consolidation among traditional industry leaders in developed economies over the coming years. Those that are successful will continue to innovate as they consolidate, but it will be a huge struggle to survive for many.

We’re calling the collective economic impact of these pressures ‘The Great Compression’ as value is squeezed from existing industries. Those best positioned to profit through it have built defensible global or major regional strengths in horizontal areas with large-scale application and high barriers to entry, and/or that serve as ‘arms dealers’ to the rest of the digital economy. For example, chip makers and IP companies (e.g. ARM, Intel, Qualcomm), very large-scale / sophisticated IT manufacturers (e.g. Microsoft, Oracle, SAP), and ‘platforms’ (e.g. Apple, Google, Visa).

However, being well positioned is no guarantee of success, and all companies will face significant challenges requiring innovation and transformation. This in turn will require immediate and ongoing action by leadership teams in every company.

Digital innovation is increasingly itself becoming a little like the entertainment industry in that it is constantly seeking hits and highly vulnerable to hype. There are centres of innovation such as Silicon Valley and elsewhere, and there can only be a small number of highly successful ‘hits’ among the many thousands if not hundreds of thousands of attempts to make a hit. Finding, gaining a share in, nurturing, and ultimately profiting from these hits is a massive industry in itself. The recognised difficulty of doing this is a further barrier to success for many of the established players. Yet those that are to survive will need to overcome it.

Next steps for STL Partners

  • To define and detail the practical actions needed to drive cross-industry transformation and innovation (in terms of ‘management mindset’, organisation, technology, products, etc.) at our Executive Brainstorms in:
    • Europe, London, 5-6 June 2013; MENA, Dubai, 14-15 November 2013; APAC, Singapore, 5-6 December 2013; Silicon Valley, San Francisco, 19-10 March 2014.
  • To publish 150+ page ‘Strategy Reports’ on:
    • The detailed benchmarking of leading players’ Telco 2.0 strategies; Digital Commerce; The Future of voice and Messaging Services.
  • To publish c.15-30 page ‘Executive Briefings’ covering:
    • Software Defined Networks (SDN); The business case for personal data; ‘Show me the (mobile) money’ – an Executive Briefing on the business case for Digital Commerce.


To read the Digital Economy note in full, including the following sections detailing additional analysis…

  • Session 1: Digital Transformation
  • Strategic Growth Opportunities for a Hyper-Connected World
  • Stimulus presentations
  • Voting, feedback, discussions
  • Questionstorming: how to overcome the blockers?
  • Key takeaways
  • Session 2: Digital Consumer
  • The New Mobile Battleground
  • Stimulus presentations
  • Voting, feedback, discussions
  • STL Partners’ next steps
  • Session 3: Digital Infrastructure
  • The Impact of 4G, Software Defined Networks  & the Cloud
  • Stimulus presentations
  • Voting, feedback, discussions
  • Brainstorm Output: What new opportunities could new forms of digital infrastructure create? For whom? How?
  • STL Partners’ next steps
  • Session 4: The ‘Digital Me’
  • The role and value of ‘digital identity’
  • Stimulus presentations
  • Voting, feedback, discussions
  • STL Partners’ next steps

…and the following figures…

  • Figure 1 – Concurrent disruption in multiple lines of business
  • Figure 2 – Music since 1997, a case study
  • Figure 3 – Consolidation is a consequence of disruption
  • Figure 4 – Reviving the album format
  • Figure 5 – The future is brutal indeed
  • Figure 6 – The hunger gap, 2013-2017
  • Figure 7 – Measuring the impact of social…
  • Figure 8 – The bottom line impact of social at Bloomberg
  • Figure 9 – How realistic is the ‘Hunger Gap’?
  • Figure 10 – How accurate is the market sizing?
  • Figure 11 – How accurate is the forecast breakdown?
  • Figure 12 – What is the scale of the transformation needed?
  • Figure 13 – The ‘Telco 2.0’ opportunities for CSPs
  • Figure 14 – Learning about your customer from Amazon recommendations
  • Figure 15 – 80% are already engaged with BYOD
  • Figure 16 – Customer-centric commerce
  • Figure 17 – Mobile web user engagement takes off
  • Figure 18 – Are app stores that good for developers?
  • Figure 19 – Making mobile Web “more like apps”?
  • Figure 20 – What are the downsides of native apps?
  • Figure 21 – Would iOS users  benefit from alternative app stores?
  • Figure 22 – when should you give data back to customers?
  • Figure 23 – How long before the ‘data surveillance backlash’?
  • Figure 24 – Will voluntarily provided info be better than surveillance?
  • Figure 25 – The media industry is static, the Web/tech players gain at telcos’ expense
  • Figure 26 – The evolution of connectivity products
  • Figure 27 – Integration between industrial, enterprise, and public network domains
  • Figure 28 – Key issues for an “elastic operator”
  • Figure 29 – Verizon’s enterprise platform
  • Figure 30 – Defining SDN – with Star Trek!
  • Figure 31 – Strategic conclusions on SDN
  • Figure 32 – Impact of SDN?
  • Figure 33 – Digital feudalism, enlightenment, or something else?

Members of the Telco 2.0 Executive Briefing Subscription Service and the Telco 2.0 Transformation Stream can download the full 62 page report in PDF format here. Non-Members, please subscribe here. The Digital Economy will also be explored in depth at the EMEA Executive Brainstorm in London, 5-6 June, 2013. For this or any other enquiries, please email contact@telco2.net / call +44 (0) 207 247 5003.

Background & Further Information

Produced and facilitated by business innovation firm STL Partners, the Silicon Valley 2013 event overall brought together 150 specially-invited senior executives from across the communications, media, retail, banking and technology sectors, including:

  • AT&T, Bain & Co, Beecham Research, Bloomberg, Blumberg Capital, BMW, Buongiorno, Cablelabs, CenturyLink, Cisco, CITI Group, Cordys, Cox Communications, CSG International, EMC, Ericsson, Experian, GE, GI Partners, Group M, GSMA, IBM, Intel, Kore Telematics, MADE Holdings, Merchant Advisory Group, Microsoft, MIT Media Lab, Motorola, MTV, Nokia, Oracle, Orange, Panasonic, Placecast, Qualcomm, Rainmaker Capital, Reputation.com, SalesForce, Samsung, SAP, Sasktel, Sprint, Telus, The Weather Channel, T-Mobile USA, UnboundID, University of California Davis, US Cellular Corp, Verizon, Visa, Vodafone.

The Brainstorm used STL’s unique ‘Mindshare’ interactive format, including cutting-edge new research, case studies, use cases and a showcase of innovators, structured small group discussion on round-tables, panel debates and instant voting using on-site collaborative technology.

We’d like to thank the sponsors of the Brainstorm:
Silicon Valley 2013 Sponsors

The Great Compression: surviving the ‘Digital Hunger Gap’

Introduction

The Silicon Valley Brainstorm took place on 19-20 March 2013, at the Intercontinental Hotel, San Francisco.

Part of the New Digital Economics Executive Brainstorm & Innovation Series, it built on output from previous events in Singapore, Dubai, London and New York, and new market research and analysis, and focused on new business models and growth opportunities in digital commerce, content and the Internet of Things.

Summary Analysis: ‘The Great Compression’

In the next 10 years, many industries face the ‘Great Compression’ in which, in addition to the pressures of ongoing global economic uncertainty, there is also a major digital transformation that is destroying traditional value and moving it ‘disruptively’ to new areas and geographies, albeit at diminished levels.

In previous analyses (e.g. Dealing with the ‘Disruptors’: Google, Apple, Facebook, Microsoft/Skype and Amazon) we have shown how key technology players in particular compete with different objectives in different parts of the digital value chain. Figure 1 below shows via crossed dollar signs (‘New Non-Profit’) the areas in which companies are competing without the primary intention of driving profits, which means that traditional competitors in those areas can expect ‘disruptive’ competition from new business models.

Figure 1 – Digital disruption
Digital disruption occurring in many industries Mar 2013

Source: STL Partners ‘Dealing with the ‘Disruptors’: Google, Apple, Facebook, Microsoft/Skype and Amazon’


The Digital Hunger Gap

For the incumbent industry players we call the near-term results of this disruption ‘The Digital Hunger Gap’ – the widening deficit between past and projected revenues. Chris Barraclough, Chief Strategist STL Partners presented the classic Music Industry case study of the ‘Hunger Gap’ effects of digital disruption.

Figure 2 – The Music Industry’s ‘Hunger Gap’
The Music Industry's ‘Hunger Gap’ Mar 2013

Source: STL Partners


In a vote, 95% of participants agreed that something similar would happen in other industries.

Chris then presented our initial analysis of the ‘Hunger Gap’ for telcos (to be published in full shortly), and asked the participants where they thought the telco industry would be relative to its 2012 position in 2020.

Figure 3 – Participants’ views on forecasts for the telecoms industry
Participants' views on forecasts for the telecoms industry Mar 2013

Source: Silicon Valley 2013 Participants / STL Partners


As can be seen, participants’ views were widely spread, with a slight bias towards a more pessimistic outlook than that presented of a recovery to 2012 levels.

Chris argued that as the ‘hunger gap’ widens, and before new revenues are developed, there will be massive consolidation and cost-reduction among incumbent players, and opportunities for innovation in services, but the chances of success in the latter are very low and require a portfolio approach and either deep pockets, exceptional insight, or considerable good fortune.

Richard Kramer, Managing Partner of Arete Research, also presented a deflationary outlook for all but the leading consumer technology players in the handset and tablet arena.

Participants then voted on which areas needed the most significant changes in their business – and existing managements’ ‘mindset’ was voted as the top priority.

Figure 4 – ‘Mindset’ is the biggest barrier to transformation
'Mindset' is the biggest barrier to transformation Mar 2013

Source: Silicon Valley 2013 Participants / STL Partners


It is also notable that all categories averaged 3.0 or over – or needing ‘Significant Change’. This points to a significant transformation across all industries.

Content:

  • Opportunities
  • Telco 2.0 Strategies
  • Big Data and Personal Data
  • Digital Commerce
  • Digital Entertainment
  • Mobile Advertising & Marketing
  • The Internet of Things
  • Outlook by Industry
  • Next Steps


  • Figure 1 – Digital disruption
  • Figure 2 – The Music Industry’s ‘Hunger Gap’
  • Figure 3 – Participants’ views on forecasts for the telecoms industry
  • Figure 4 – ‘Mindset’ is the biggest barrier to transformation
  • Figure 5 – The ‘Telco 2.0’ opportunities for CSPs
  • Figure 6 – The impact of ‘Software Defined Networks’ (SDN)
  • Figure 7 – Will ‘Personal Data’ be more useful than ‘Big Data’?
  • Figure 8 – STL Partners’ ‘Wheel of Digital Commerce’
  • Figure 9 – Who will in ‘SoMoLo’?
  • Figure 10 – Significant changes in viewing habits
  • Figure 11 – Transformation needed in the advertising industry
  • Figure 12 – Growth projections for M2M ‘mobile’ (e.g. 3G/4G) connected devices

Finance: Optimising the Telco 2.0 revenue and cost model

Summary: Structuring finances is key for the success of innovations in general and Telco 2.0 projects in particular. In this detailed extract from our new strategy report ‘A Practical Guide to Implementing Telco 2.0’, we describe the best ways to approach the management of revenues and costs of new business models, and how to get the CFO and finance department onside with the new approaches required (February 2013, Executive Briefing Service, Transformation Stream). Small table on finances
  Read in Full (Members only)  To Subscribe click here

Below is an extract from this 15 page Telco 2.0 Report that can be downloaded in full in PDF format by members of the Telco 2.0 Executive Briefing service and the Telco 2.0 Transformation Stream here. Non-members can subscribe here or other enquiries, please email contact@telco2.net / call +44 (0) 207 247 5003.

We’ll also be discussing our findings at the New Digital Economics Brainstorms in Silicon Valley, 19-20 March, 2013 and in EMEA 2013 in London, June 5-6.

Telco 2.0 has a different financial model to Telco 1.0

Cash Returns On Invested Capital (CROIC) is a good measure of company performance because it demonstrates how much cash investors get back on the money they deploy in a business. It removes measures that can be open to interpretation or manipulation such as earnings, depreciation or amortisation. In simple terms CROIC is calculated as:

Figure 1: Cash Returns On Invested Capital (CROIC)
CROIC Definition

While it is simplistic, STL Partners broadly sees the benefits of a Telco 2.0 Happy Pipe strategy accruing to a CSP in the form of higher EBITDA (Earnings Before Interest, Tax, Depreciation and Amortisation) margins (owing to lower costs) and lower capital expenditures. A Telco 2.0 Service Provider strategy will seek to also achieve this as well as generate sales growth. It is, therefore, easy to see why many operators are interested in pursuing a Telco 2.0 Service Provider strategy: if they can execute successfully then they will receive a double-whammy benefit on CROIC because lower opex and higher sales will result in more free cash flow being generated from lower levels of invested capital.

CROIC also demonstrates how the current financial metrics used by operators – particularly EBITDA margins – preclude operators from considering different operational and business models which may have lower EBITDA margins but higher overall cash returns on invested capital. Thus, as shown in Figure 2 (showing relative rather than actual financials), CSPs tend to focus on the existing capital-intensive business which currently generates CROIC of around 6% for most operators rather than investing in new business model areas which yield higher returns. The new business model areas require relatively low levels of incremental capital investment so, although they generate lower EBITDA margins than existing Telco 1.0 services, they can generate substantial CROIC margins and can ‘move the needle’ for operators.

Specifically, Figure 2 illustrates the way that different skills and operational models translate into different financial models by showing:

  • Telco 1.0 (Core Services + Vertical Industries Solutions (SI) + Infrastructure Services) requires high capital investment and generates relative low levels of revenue for each $1 of invested capital ($0.5-0.7) but at high EBITDA margin (30-50%). This results in healthy cash generation (EBITDA) but a large proportion of this cash needs to be reinvested as capital expenditure each year resulting in relatively modest levels of free cash flow and CROIC of 5.2-6.4% for a typical CSP.
  • Even if we exclude any capex and opex savings generated from becoming a Telco 2.0 Happy Pipe, the addition of additional revenues from Embedded Communications (see Strategy 2.0: The Six Key Telco 2.0 Opportunities) mean that a Happy Piper generates new revenues that require relatively low levels of capital investment. Although these ‘embedded communications’ revenues are at a lower margin than the core services (28% compared with 45%), they require little incremental capital expenditure. This means that free cash flow is healthy and CROIC for Embedded Communications is 10.7% lifting the Happy Piper overall CROIC percentage.
  • For the Telco 2.0 Service Provider, again setting aside any efficiency benefits from adopting Telco 2.0 principles, the two pure-play Telco 2.0 service areas – Third-party Business Enablers and Own-brand OTT – have very different financial characteristics. They generate much lower EBITDA margins (15-20%) but generate significantly higher sales relative to capital investment ($1.4-2.0) and so are able to generate substantially higher CROIC than the Telco 1.0 services.

In essence, the new ‘product innovation’ businesses associated with being a Telco 2.0 Service Provider are much closer to an internet player such as Amazon or the early Google business (prior to heavy capital investment in fibre and data centres) in the way they make money. Not convinced? Look at Figure 3 which demonstrates the return on total assets generated by CSPs and three key internet players – Microsoft, Google and Amazon. Microsoft, a software business, generates high margins on a relatively low capital base (and hence generates very strong returns) owing to its dominant position on the desktop. Microsoft’s issue is growth not profitability, hence the big investments it is making in its internet business and in mobile. The young

Google and Amazon are classic product innovation businesses – low margin and high sales generation relative to invested capital. The CSP group all generate sales of $0.3-0.7 per $1 of capital but generate higher margins than Amazon and Google before 2005.

So we can see that the new Telco 2.0 business model makes money in a different way to the traditional business and needs to be managed and measured in a new way. Let’s explore the implications of this in more detail.

Figure 2: Cash Returns on Invest Capital of different Telco 2.0 opportunity areas

This table demonstrates the relative, rather than absolute, financial metrics for different CSP opportunity areas. The starting point is a nominal $1,000 of invested capital in the CSP network that results in $500 of annualised ‘Core Services’ revenues. Levels of invested capital, sales, EBITDA, annual capex, tax and free cash flow are then shown for each of the opportunity areas.

Different returns of different business models

Figure 3: Different financial models illustrated – CSPs vs Internet Players

This chart shows how different businesses generate returns by plotting asset intensity (x-axis) against profitability (y-axis). Note that the profitability measure here (NOPAT margin) is not directly comparable to the EBITDA margin in Figure 2 as this is post-taxation.

Different returns at different stages of business development

Revenue model implications and guiding principles

The different types of revenue to be considered when developing a new Telco 2.0 service are outlined in detail in the A Practical Guide to Implementing Telco 2.0 in the section on the Telco 2.0 Service Development Process. These include different revenue types (such as single stream, multi-stream, interdependent), different revenue models (subscriptions, unit charges, advertising, licensing and commissions) and different sources (consumer, SME, enterprise as both end users and as third-party service providers – advertisers, merchants, etc.). It is clear that:

  • Telco 1.0 services are largely single stream, confined to a few models (subscription and per unit charging) and sourced from end users (consumers, SMEs and enterprises).
  • Telco 2.0 services typically have more revenue types, including interdependent (two-sided revenues), introduce more revenue models, including advertising and commission, and source revenues from third-parties as well as end-users.

But what about how these new revenue types, models and sources impact the overall CSP business? How should (finance) managers now evaluate services given the different financial models between Telco 1.0 and Telco 2.0? What constitutes ‘attractive’ now? What metrics are the right ones to use? What trade-offs between the Telco 1.0 and Telco 2.0 revenue models need to be considered?

Five guiding principles for revenue models

We lay out 5 revenue model guiding principles to help you address these knotty questions below:

1. Ensure your revenue model supports your overall strategy and need to build appropriate ecosystem control points.

In the Telco 1.0 world, the revenue model is simple and, although pricing is complex, decision- making is simplified by clear goals – to maximise the number of paying users and manage the price-volume trade-off (higher prices = lower volume of users or transactions) to maximise overall returns from communications services. The Telco 2.0 world is far more complex. As well as having ‘more revenue levers to pull’, management needs to consider the company’s overall digital strategy beyond communications.

CSPs need to consider where and how they will create one or more control points within the digital ecosystem. Revenue and pricing strategy is a core component of this. In some arenas – payments for example – CSPs may choose to price their services very low or make them free to build up a large number of mobile wallet users and a strong merchant network that can be monetised in another arena – mobile advertising perhaps. In other words, management cannot take a siloed approach to the CSP revenue model – there is a need to think horizontally across the CSP digital platform.

To read the note in full, including the following additional analysis…

  • The rest of the five guiding principles for revenue models
  • Five guiding principles for cost models
  • Final thoughts on Telco 2.0 finances – how to work with the Finance team


…and the following figures

  • Figure 1: Cash Returns On Invested Capital (CROIC)
  • Figure 2: Cash Returns on Invest Capital of different Telco 2.0 opportunity areas
  • Figure 3: Different financial models illustrated – CSPs vs Internet Players
  • Figure 4: Revenue metrics – Telco 1.0 and Telco 2.0 examples
  • Figure 5: Product Innovation vs Infrastructure cost models – Unilever & Vodafone


Members of the Telco 2.0 Executive Briefing Subscription Service and the Telco 2.0 Transformation Stream can download the full 15 page report in PDF format hereNon-Members, please subscribe here or email contact@telco2.net / call +44 (0) 207 247 5003.

Europe’s brutal future: Vodafone and Telefonica hit hard

Introduction


Even in the UK and Germany, the markets with the brightest future, STL Partners forecasts a respective 19% and 20% decline in mobile core services (voice, messaging and data) revenues by 2020. The UK has less far to fall simply because the market has already contracted over the last 2-3 years whereas the German market has continued to grow.

We forecast a decline of 34% in France over the same period.

In Italy and, in particular, Spain we forecast a brutal decline of 47% and 61% respectively. Overall, STL Partners anticipates a reduction of 36% or €30 billion in core mobile service revenues by 2020. This equates to around €50 billion for Europe as a whole.


Like the medical profession, we don’t always like being correct when our diagnoses are pessimistic. So it is with some regret that we note that our forecasts are being borne out by the latest reports from southern Europe. Vodafone has been forced into a loss for H1 2012, after it wrote down the value of its Spanish and Italian OpCos by £5.9bn. Here’s why:

eurobloodbath.png

The writedown is of course non-cash, and those of us who remember Chris Gent’s Vodafone will be familiar with the sensation. But the reasons for it could not be more real. Service revenue has fallen sickeningly, down 7.9% across Europe, 1.4% across the group.

Vodafone has enjoyed a decent performance from the company’s assets in Africa, Asia, Turkey, and the Pacific, and a hefty dividend from Verizon Wireless. It is the performance in Europe which is dreadful and the situation in southern Europe especially bad.

For while service revenue in Gernany was up 1.8%, it was down a staggering 12.8% in both Spain and Italy. And margins were sacrificed for volume; EBITDA was down 16.6% in Italy, and 13.8% in “Other Southern Europe”, that is to say mostly Greece and Portugal. Even the UK saw service revenues fall -2.1%, while the Netherlands was down -1.9%. Vodafone’s investments across Europe seem to have landed in an arc of austerity running from the Norwegian Sea to the Aegean, the long way around.

Vodafone’s enterprise line of business has helped the Italian division defy gravity for a while. Until recently, OneNet was racking up the same 6% growth rates in Italy that it saw in Germany and contributing substantially to service revenue, even though the wider business was shrinking. In Q2, service revenue in Italy was down 4.1% but enterprise was up 5.8%.

But strategy inevitably beats tactics. Tellingly, the half-year statement from Vodafone management went a little coy about enterprise’s performance. Numbers are only given for Germany and Turkey, and for group-wide One Net seats. They are good, but you wonder about the numbers that aren’t given. We are told that One Net is “performing well” in Italy, but that’s not a number.

Meanwhile, Telefonica saw its European revenues fall 6.4% year-on-year. The problem is in Spain, where the plummet was 12.9%. Mobile was worse still, with revenues thumped downwards by 16.2%.

The damage, for both carriers, is concentrated in mobility, in southern Europe, and in voice and messaging. Telefonica blames termination rate cuts (as does Vodafone – both carriers are big enough that they tend to terminate more calls from other carriers than they pay out on), but this isn’t really going to wash. As Vodafone’s own statement makes clear, MTRs are coming down everywhere. And Telefonica’s wireline revenues were horrible, too, down 9.6%.

But the biggest hit to revenue for Vodafone was in messaging, and then in voice. Data revenue is growing. In the half to 30th September 2011, Vodafone.es subscribers generated £156 million in messaging revenues. In the corresponding half this year, it was £99 million. Part of this is accounted for by movement in the euro-sterling exchange rate, so Vodafone reports it as a 30% hit to messaging and a 20% hit to voice. Italy saw an 11.4% hit to messaging and a 16% hit to voice. The upshot to Vodafone is a 29.7% cut to the division’s operating profits. Brutal indeed.

Obviously, a lot of this is being driven by the European economic crisis. It is more than telling that Vodafone’s German and Turkish operations are powering ahead, while it’s not just the Mediterranean economies under the European Union’s “troika” management (EC, ECB and IMF) that are suffering. The UK, under its own voluntary austerity plan, was down 2.1% for Telefonica, and the Netherlands, having gone from being the keenest pupil in the class to another austerity case in the space of one unexpectedly bad budget, is off 1.9%. Even if you file Turkey under “emerging market”, the comparison between the Mediterranean disaster area, the OK-ish position in North-Western Europe, and the impressive (£2.4bn) dividend from Verizon Wireless in the States is compelling.

But disruption is a fact. We should not expect that things will snap back as soon as the macro-economy takes a turn for the better. One of the reasons for our grim prediction was that as well as weak economies, the Southern European markets exhibited surprisingly high prices for mobile service.

The impact of the crisis is likely to permanently reset customer behaviour, technology adoption, and price expectations. The Southern price premium is likely to be permanently eroded, whether by price war or by regulatory action. Customers are observably changing their behaviour in order to counter-optimise the carriers’ tariff plans.

Vodafone observes plummeting messaging revenues, poor voice revenues, and heavy customer retention spending, specifically on handset subsidies for smartphones. In fact, Vodafone admits that it has tried to phase out subsidy in Spain and been forced to turn back. This suggests that customers are becoming very much more aware of the high margin on SMS, are rationing it, and are deliberately pressing for any kind of smartphone in order to make use of alternatives to SMS. Once they are hooked on WhatsApp, they are unlikely to go back to carrier messaging if the economy looks up.

Another customer optimisation Vodafone encounters is that the customers love their integrated fixed/mobile plan. Unfortunately, this may mean they are shifting data traffic off the cellular network in the home-zone and onto WLAN. Further, as Vodafone is a DSL unbundler, the margin consequences of moving revenue this way may not be so great. In Italy, although the integrated tariffs sold well, a “fall in the non-ULL customer base” is blamed for a 5.6% drop in fixed service revenue. Are the customers fleeing the reseller lines because Vodafone can’t match TI or Fastweb’s pricing, or is it that the regulatory position means margins on unbundled lines are worse?

Vodafone’s response to all this is its RED tariff plan. This essentially represents a Telco 2.0 Happy Pipe strategy, providing unlimited voice and messaging in order to slow down the adoption of alternative communications, and setting data bundles at levels intended to be above the expected monthly usage, so the subscribers feel able to use them, but not far enough above it that the bandwidth-hog psychology takes hold.

vf-red.png

With regard to devices, RED offers three options with tiered pricing: SIM only, basic smartphone, and iPhone. The idea is to make the subsidy costs more evident to the customer, to slow up the replacement cycle on flagship smartphones via SIM-only, and to channel the smartphone hunters into the cheaper devices. Overall, the point is to drive data and smartphone adoption down the diffusion curve, so as to help the transition from a metered voice-centric to a data-centric business model.

The CEO, Vittorio Colao, says as much:

The reason why the whole industry is on a difficult trend…is because we historically voice priced really high and data priced really low.

Vodafone’s competitors face a serious challenge. They are typically still very dependent on prepaid voice minutes, a market which is suffering. Even in Northern Europe, it’s off 10%. Telcos loved PAYG because everything in it is incremental. Now, the challenge is how to create a RED-like tariff for the PAYG market.

Euro Voice Brutal Image 2 Chart Euro 5 Oct 2012.png

Those in North and South America, MENA and Asia-Pacific may be looking at Europe and breathing a sigh of relief. But don’t fool yourself. SMS revenues in the US are down for the first time driven by volume and price declines. One rather worrying outcome of last week’s Digital Arabia event was that operators in the region seem to be under the impression that the decline for them is still several years out and destined to be a relatively gentle softening of the market. There’s more here on our initial take on what they need to do to avoid complacency and start to build new business models more quickly.

Innovation Strategies: Telefonica 2.0 Vs. Vodafone 2.0

Summary: Telefonica and Vodafone are both European-based tier 1 CSPs with substantial revenues, cash flows and subscribers. They have both expanded beyond Europe – Vodafone into Africa and Asia and Telefonica into Latin America. However, their Telco 2.0 strategies are rather different. In this extract from our forthcoming report, A Practical Guide to Implementing Telco 2.0, we outline their Telco 2.0 strategies and their benefits and risks. (September 2012, Executive Briefing Service, Transformation Stream.)

Telefonica Strategy 2.0 Chart

  Read in Full (Members only)   To Subscribe click here

Below is an extract from this 14 page Telco 2.0 report that can be downloaded in full in PDF format by members of the Telco 2.0 Executive Briefing service and the Telco 2.0 Transformation Stream here. Non-members can subscribe here

This report is itself an edited section taken from our forthcoming strategy report, A Practical Guide to Implementing Telco 2.0We will be sharing some of the findings, and exploring them in the market context at Digital Arabia, the Telco 2.0 invitation only Executive Brainstorm taking place in Dubai, 6-7 November, in and Digital Asia in Singapore, 3-5 December, 2012. 

To find out more about any of these services, apply for an invitation to the Brainstorms, and for any other enquiries, please email contact@telco2.net / call +44 (0) 207 247 5003.

To share this article easily, please click:

Two Different Telco 2.0 Strategies

‘Full Service Telco 2.0’ Vs. Telco 2.0 ‘Happy Piper’

In our reports the ‘Roadmap to New Telco 2.0 Business Models’ and ‘A Practical Guide to Implementing Telco 2.0’, we identify two archetypal Telco 2.0 strategies: ‘Full Service Telco 2.0’; and ‘Telco 2.0 Happy Piper’.

Figure 1 – Porter and Telco 2.0 competitive strategies

Telefonica Vodafone Telco 2.0 Porter diagram Sept 2012

Source: Michael Porter / STL Partners / Telco 2.0

  • Full-Service Telco 2.0’. In this ‘two-sided’ business model, CSPs have two clear customer groups: end-users and other 3rd Party Organisations who interact with end-users (what we call ‘Upstream’ companies – banks, retailers, advertisers, government, utilities, software developers other telcos). CSPs seek to compete with each other and with others, such as the ‘internet players’, by differentiating both in the end-user services (communications, content, etc.) and with the enabling services they provide to other service providers (identity and authentication, customer targeting/marketing services, payments, customer care, and so forth).
  • The ‘Telco 2.0 Happy Piper’. CSPs that pursue this strategy will focus on retail or wholesale connectivity to upstream and/or downstream customers rather than on higher-level (value-added) services. It is worth noting that although simplicity and cost control are key themes of the ‘Telco 2.0 Happy Piper’, there remains scope for revenue growth through providing ‘enhanced connectivity’ options.

Overview: Telefonica 2.0 and Vodafone 2.0

At a top-level, Telefonica is pursuing a ‘Telco 2.0 Service Provider’ strategy whereas Vodafone, although dabbling in Telco 2.0 services, is largely committed to a defensive approach to digital services (protecting voice and messaging) and is aggressively pursuing a ‘Happy Piper’ strategy. We illustrate a qualitative assessment of where the two CSPs sit on the Happy Piper-Service Provider continuum, together with a selection of other CSPs in Figure 2.

Figure 2: Positioning CSPs on the Happy Piper – Service Provider continuum

Telefonica Vodafone Continuum diagram Sept 2012

Source: STL Partners / Telco 2.0

Telefonica: Telco 2.0 Service Provider

Background: Digital Innovator

STL Partners believes that Telefonica is arguably the most advanced operator globally in moving from traditional telecoms (Telco 1.0) to a Telco 2.0 Service Provider strategy. This belief was reinforced by the reorganisation in Autumn 2011 in which Matthew Key, the European CEO, was appointed head of a new unit, Telefonica Digital, which has the objective to build the company’s presence and value in the digital world. A press release in September 2011 summarised the objectives of the division as being:

  • To take full advantage of the opportunities afforded by the digital world with respect to new products, services and value chains, both in markets where the company operates directly and those in which it has industrial alliances or the potential to operate directly in OTT (over the top) businesses.
  • This unit will be responsible for developing and globally exploiting businesses like, among others, video and entertainment, e-advertising, e-health, financial services, cloud and M2M. It will aim its activity both at the corporate and residential segments. 
  • To actively help the two major geographic regions, Europe and Latin America, take advantage of their distinguishing traits (relationship with and proximity to more than 300 million customers, capillarity, invoicing and distribution capabilities).
  • To attain this goal, the unit will develop top-flight global competencies in the areas of business intelligence, pricing strategies and management of alliances in the digital environment with respect to both hardware (i.e. devices) and software.
  • Generate new growth opportunities by investing in new digital businesses, while grouping together or reinforcing initiatives such as Amerigo, Wayra and Vc’s.

Figure 3: Telefonica’s Telco 2.0 Service Provider strategy

Telefonica 2.0 Strategy chart Sept 2012

Source: Telefonica

Telefonica Digital is a significant development in the company’s commitment to Telco 2.0 services for three reasons:

  1. For the first time a CSP has been transparent about how much revenue it is generating from non-traditional ‘digital’ services. In 2011, Telefonica Digital generated revenue of €2.4 billion and intends to grow this by around 20% a year to reach around €5 billion in 2015.
  2. Telefonica Digital is a relatively autonomous entity with separate headquarters (in London rather than Slough) and separate product and service development capabilities. It can both leverage Telefonica’s commercial distribution capabilities (via the operating companies) and, crucially, distribute services over-the-top via app stores and the internet. Essentially, it has been given the authority to compete with the core business as an in-house ‘OTT player’.
  3. It is specifically focused on the services layer – both end-user services and enabling services for third-party service providers (including advertising and security). It will leverage Telefonica’s network where it makes sense to do so (e.g. for M2M) but will not be tied to the network if it makes sense to build OTT services (e.g. Tu Me, one of its OTT voice services, is available for non-Telefonica customers). It also seeks to buy (e.g. Terra, Tuenti), build (e.g. Priority Moments) and partner (via various models including Wayra, in which Telefonica makes seed capital available to early stage businesses).

Figure 4: Telefonica’s Telco 2.0 service portfolio

Telefonica digital innovation calendar diagram sept 2012

Source: Telefonica

To read the note in full, including the following additional sections detailing support for the analysis…

  • Telefonica’s Telco 2.0 products and services
  • Vodafone’s approach
  • Background: safety first
  • Vodafone’s Telco 2.0 services
  • Vodafone One Net: Unified Communications in the Cloud for SMBs
  • Vodafone Freebees: Retaining the Pre-pay base
  • Summary: Strategic Evaluation

…and the following figures…

  • Figure 1 – Porter and Telco 2.0 competitive strategies
  • Figure 2: Positioning CSPs on the Happy Piper – Service Provider continuum
  • Figure 3: Telefonica’s Telco 2.0 Service Provider strategy
  • Figure 4: Telefonica’s Telco 2.0 service portfolio
  • Figure 5: Vodafone – main messages are about being an efficient data pipe
  • Figure 6: Vodafone One Net – a defensive play in the SMB market
  • Figure 7: Telefonica and Vodafone Telco 2.0 strategies – evaluation

Members of the Telco 2.0 Executive Briefing Subscription Service and the Telco 2.0 Transformation Stream can download the full 14 page report in PDF format hereNon-Members, please subscribe here. For this or other enquiries, please email contact@telco2.net / call +44 (0) 207 247 5003.

Companies and Technologies Featured: Vodafone, Telefonica, O2, Priority Moments, Top-Up Surprises, Freebees, Tu Me, Tuenti, Terra, OneNet, Wayra, M2M, OTT, Jajah, Happy Piper, Full Service, Telco 2.0.

Telco 2.0: Killing Ten Misleading Myths

Summary: ‘Telco 2.0’ has evolved considerably since we put forward the original concept for telcos’ future success in 2006. Here we dispel ten myths and misunderstandings that have also evolved that can misdirect strategy. (August 2012, Executive Briefing Service, Transformation Stream.)

impact of 2sbm aug 2012

  Read in Full (Members only)   To Subscribe click here

Below is an extract from this 24 page Telco 2.0 report that can be downloaded in full in PDF format by members of the Telco 2.0 Executive Briefing service and the Telco 2.0 Transformation stream here. Non-members can subscribe here and for this and other enquiries, please email contact@telco2.net / call +44 (0) 207 247 5003.

We are about to publish a new strategy report ‘A Practical Guide to Implementing Telco 2.0‘ and will be previewing findings at the invitation only Executive Brainstorms in Dubai (November 5-7, 2012), Singapore (3-5 December, 2012), Silicon Valley (19-20 March 2013), and London (23-24 April, 2013). Email contact@stlpartners.com or call +44 (0) 207 243 5003 to order the report or find out more.

To share this article easily, please click:


Executive Summary – Killing Ten Myths

As an organisation devoted to driving innovation, Telco 2.0’s thinking has continually evolved. Today, most of our work is focused on how to implement new business models, and helping industry players develop strategies and activities to address new threats and opportunities presented by adjacent players.

We have also learned that as the thinking has evolved it has spawned some myths and misconceptions. (NB. This is not an attempt to stifle insightful criticism or debate, as intelligent challenges and critiques are essential to the development of sound strategy and well informed decision making, and we welcome such challenges.)

What matters about these myths is that they can inject a misleading or distracting idea capable of derailing balanced strategic consideration. The propagandists’ favourite weapons of ‘fear, uncertainty and doubt’ can easily and accidentally be triggered in this way. To counter this, here in summary are our ‘Telco 2.0 realities’ to what we’ve found to be the most prevalent and injurious misconceptions of Telco 2.0.

Figure 1 – Telco 2.0: Misleading Myths Vs. Realities

Misleading Myths and Realities of Telco 2.0

Source: STL Partners / Telco 2.0

Background: Telco 2.0 – then and now

When we first started the Telco 2.0 Initiative in 2006, the decline of the traditional telecoms industry business model based on voice and messaging seemed a long way off to most. ‘Broadband’ and ‘mobile data’ were still relatively immature propositions with great prospects for growing the industry further. ‘Smartphone’ was barely even a word, let alone a global phenomenon, and ‘tablets’ were what you took for a headache.

Most of our initial concepts have stood the tests of time and hindsight well. We drove for radical change in how the telecoms industry looked at:

  • Voice and messaging communications services;
  • The separation of services and network;
  • How networks would be increasingly powerful and intelligent ‘at the edge’;
  • The ongoing empowerment and participation of consumers;
  • Platforms’ that enabled new business to consumer services by re-purposing telco assets.

Subsequently, we looked at:

Next Steps

Our next action on the overall Telco 2.0 strategy agenda will to be to publish a new report: ‘A Practical Guide to Implementing Telco 2.0’. We will also presenting key findings at the Digital Arabia (Dubai, 5-7 November 2012) and Digital Asia (Singapore, 3-5 December 2012) Executive Brainstorms.

We are also launching two new services:

  • The Telco 2.0 Benchmarking Index, starting with a major report on the strategies of the top and most innovative telcos, and showing how the world’s telcos measure up to the leading standards of innovation;
  • The Telco 2.0 Innovation Scouting Service, designed to identify and evaluate, in a structured but flexible process, the best innovations for client members.  The service focuses on a full suite of revenue-generating products and services but can encompass other initiatives such as process improvements in customer care, operations etc.

To find out more about these or apply for an invitation to the Brainstorms, please email contact@stlpartners.com or call +44 (0) 207 247 5003. Additionally, we’ll be publishing major new research into Strategies in Voice and Messaging, ‘Telco Strategies in the Cloud’, and the impact and opportunities of combining personal data and digital and mobile commerce.

The rest of this report outlines the myths and their antidote realities in more depth (first two sections previewed below).

Telco 2.0 is about transforming telecoms business models

Myth 1: Telco 2.0 is just about two-sided business models

The concept of the two-sided telecoms business model has certainly had an impact on the industry, as can be seen for example in the illustrations below from Vodafone and Telefonica investor presentations.

Figure 2 – The impact of the Telco 2.0 Two-Sided Telecoms Business Model

Impact of Telco 2.0 on Investor Presentations

Source: STL Partners / Telco 2.0

While we’re pleased to see the idea of the two-sided business model propagated, there is a degree to which the idea has been a victim of its own success. It appears that some people now think that the two ideas of ‘Telco 2.0’ and ‘Two-Sided Telco Business Models’ are one and the same, and that the two-sided model is the totality of Telco 2.0.

This is not correct. While we still use the concept of the two-sided telco business model as a tool to explain how operators need to consider how they add value to consumer and enterprises and show that revenues can flow from multiple sources, ‘Telco 2.0’ is much more than this and includes:

  • Extending and enhancing existing core services – voice, messaging, data, content – to deliver more value to customers.
  • Developing bespoke communications and IT solutions for specific vertical industries.
  • Leveraging infrastructure more effectively to improve the customer experience (offer greater speed and responsiveness) while reducing cost (offloading traffic onto cheaper networks) and generating new revenue (‘onloading’ traffic from more expensive networks).
  • Distributing existing products and services via new channels and to new customers such as embedding voice within enterprise business processes or bundling connectivity in with consumer products.
  • Deploying assets including identity and authentication capabilities and customer data to both improve customers’ experience of existing core services and develop valuable new services for third-party enterprises and consumers.
  • Developing products and services that are largely ‘OTT’ – independent of the network.

STL Partners believes that business model innovation equates to business transformation.  Innovation can occur or be originated in many different ways and that each of these can have a knock-on effect through an organisation and beyond it to other organisations and industries.  Our analytical framework for business model innovation covers 5 domains (see Figure 3).

Figure 3 – Analytical framework for business model innovation

STL Partners Business Model Framework

Source: Source: Faber et al; Designing business models for mobile ICT services, 2001; adapted and developed by STL Partners

Redesigning Telco 1.0 really matters

Myth 2: Telco 1.1 isn’t part of it

Figure 4 – Existing service revenues in the UK market

Current Data Revenue Growth EMEA June 12


Source: STL Partners / Telco 2.0

To illustrate the challenges facing the existing business model, Chris Barraclough, MD and Chief Strategist, Telco 2.0 / STL Partners, presented the above example analysis of voice and data revenues from the UK market at the EMEA Brainstorm in June 2012 as a preview of analysis we are conducting across the main markets in Europe. Two-thirds of the delegates supported this analysis, with over half saying they thought this was ‘about right’ – although just under a third thought it too pessimistic. Whatever the eventual outcome in the market, there is little doubt that the existing business model is under increasing pressure across many regions and for many operators.

There is a natural temptation when presented with forecasts like this for executives to just seek out the nearest red pen and start to cut their way to profits. While a degree of cost reduction is clearly required, this cannot be the sole strategy or commoditisation and a total lack of flexibility is the only possible outcome.

It is obviously important to extend the life of the core business model, and telcos have long been adept at lobbying the regulator as a primary strategy. Further to this, both continuing to re-price data and bundle in new services are also proven strategies. But this really cannot change the game enough and telcos need to fundamentally improve the interactions they have with their customers to retain any relevance as consumer-facing entities.

We have looked at many ways in which telcos can learn how to improve their customers’ experience from the leading web and physical retailers, with Amazon as a particular case in point. This is critical both to telcos existing business and to their prospects for building new businesses. Better service / product experience design and delivery, and the use of customer data to drive personalisation and intelligence in their experiences, are key opportunities to improve customer interactions for telcos, as shown in Figure 5 – The ‘Telco 2.0 Flywheel’.

Figure 5 – The ‘Telco 2.0 Flywheel’

Telco 2 Customer Experience Flywheel

Source: STL Partners / Telco 2.0

And quality is not the only issue: the quantity of customer interactions matters too, and for many telcos the quantity is now declining. For customers it is a simple equation: experience = relevance, so if your customers start using you less, you become less relevant.  Telcos need to find new ways to interact with customers.  

To read the note in full, including the following sections detailing support for the analysis…

  • All telcos need to innovate
  • New Digital Business Models impact all global marketsTelcos need to act now
  • Some new models will create value
  • There’s more to strategy than ‘OTT’
  • Collaboration and Innovation both have roles
  • Strategy, platforms, people, and skills are the priorities
  • It’s not just a ‘Pipe Dream’

…and the following figures…

  • Figure 1 – Telco 2.0: Misleading Myths Vs. Realities
  • Figure 2 – The impact of the Telco 2.0 Two-Sided Telecoms Business Model
  • Figure 3 – Analytical framework for business model innovation
  • Figure 4 – Existing service revenues in the UK market
  • Figure 5 – The ‘Telco 2.0 Flywheel’
  • Figure 6 – Optimism in APAC
  • Figure 7 – Time remaining on key strategic control points
  • Figure 8 – Different Business Models need Different Metrics
  • Figure 9 – The six opportunity areas have different models
  • Figure 10 – ‘Under The Floor’ Pressures
  • Figure 11 – Six Telco 2.0 implementation strategies
  • Figure 12 – Telcos need new skills, systems, structures and incentives
  • Figure 13: The STL Partners 12-stage innovation development and launch process
  • Figure 14: A non-exhaustive collection of Telefonica’s Telco 2.0 projects
  • Figure 15: Vodafone – from splendid isolation in 2005 to local collaborator in 2011

Members of the Telco 2.0 Executive Briefing Subscription Service and the Telco 2.0 Transformation stream can download the full 24 page report in PDF format hereNon-Members, please subscribe here. For this or other enquiries, please email contact@telco2.net / call +44 (0) 207 247 5003.

Companies and Technologies Featured: ISIS, E5, Oscar, 4T Sverige, Vodafone, Telenor, Telefonica, Singtel, O2, Priority Moments, Top-Up Surprises.

Euro telcos: fiddling while the platform burns?

Summary: Most executives across the European telecoms industry accept that the current telco business model is in decline (the ‘burning platform’), but wholehearted action to create sustainable new models is not in place. We identify the key barriers and next steps to overcome them in this top-level analysis of findings from our recent EMEA Executive Brainstorm. (July 2012, Executive Briefing Service, Transformation Stream.)

UK Services Revenues: Actual and Forecast (index)

  Read in Full (Members only)   To Subscribe click here

Below is an extract from this 16 page Telco 2.0 Report that can be downloaded in full in PDF format by members of the Telco 2.0 Executive Briefing service and the Telco 2.0 Transformation stream here. Non-members can subscribe here and for this and other enquiries, please email contact@telco2.net / call +44 (0) 207 247 5003.

To share this article easily, please click:


Executive Summary

The Burning Platform

It was clear at the Telco 2.0/New Digital Economics Brainstorm in London a few weeks ago that most executives across the European telecoms industry accept that the current telco business model is in decline (the ‘burning platform’), but wholehearted action to create sustainable new models is not in place. 

Figure 1 – The burning platform illustrated: e.g. forecast decline in UK revenues

UK Services Revenues: Actual and Forecast (index)

Source: Presentation by Chris Barraclough, Chief Strategist and MD Telco 2.0

Two thirds of delegates thought this leading indicator forecast ‘about right’ or ‘too optimistic’.

Telcos need to act more decisively

The core message to the leaders of the European telecoms industry is that they must make a more concerted effort to change direction now or will have much less control over their future destinies.

Some telcos are taking steps, but even the most advanced are still in experimental mode, and the rest somewhere between strategic slide-ware and tacit acceptance of a future as a ‘pipe’.

As well as prudent re-pricing of data and diligence in cost and efficiency management, the primary opportunities for telcos are to re-conceive the core communications proposition, re-define the overall experience of being a telco customer and ultimately to create interoperable multi-sided business models that help 3rd parties and end-users (people, organisations and devices) connect in more efficient and effective ways. These actions will create a more valuable and defensible role for telcos in the emerging digital economy.

Overcoming industry inhibitions

To progress, the industry needs to overcome the following challenges:

  • Time is short. Delegates perceived that telcos had significantly less time to secure strategic control points in the digital economy than at previous brainstorms. Telcos need to act more decisively now in payments, advertising, creating new forms of ‘OTT’ communications, identity and cloud services.
  • Money is hard to find. The business cases for some of the new models are complex and the economics are different from traditional telco business models. We know because we have been working on many recently, and have also been recommending important new evaluation metrics. It’s not straightforward, nor is it easy to fill the gap left by the predicted decline in the current model, but it is possible to create new value.
  • Technology is a tool, not a strategy. The business case for LTE, for example, is hard to make without new service revenues in addition to access, which somewhat begs the question of who and what is leading this major industry investment. 
  • The right people are hard to find. 95% of delegates thought there is a serious shortage of the internal skills needed to manage, innovate and deliver very different types of propositions. Understanding, addressing and filling this gap is a vital priority.
  • Customers will not solve the industry’s problems. Most customers – upstream and downstream – do not understand how telcos could help them in new ways. Our research shows a range in comprehension and belief in telcos’ abilities, so telcos need to work harder to create and sell new solutions.
  • It’s tricky to organise innovation and change at scale. The operators that are starting to take action face a complex organisational challenge: should innovation be built into the core business or established in a new unit? In the core it is closer to the heart but also more vulnerable to the organisation’s white blood cells (the ones that attack unrecognised intruders). In a separate unit it’s easier to grant more freedoms but it’s much more difficult to integrate and change the core. 
  • Collaboration: the Prisoners’ Dilemma. Many of the new business models will only work effectively if telcos cooperate on a common approach. This is usually slow and difficult (witness the slow progress of RCS-e and the demise of WAC). There is also regulatory uncertainty around industry collaboration, and fear of the regulator is quite reasonably a powerful internal inhibitor in telcos. Additionally, some players perceive they could achieve competitive advantage by ‘going it alone’. A way through this dilemma needs to be navigated, and our recent analysis suggests some new ways to think about this.
  • It’s hard to change a winning formula (even when you are losing). Financial markets have been keen on telcos’ relative stability and cash flows in turbulent economic times. At the same time there are also those high up in telco organisations who have known nothing but success with the existing model and who will argue to defend the status quo. Yet the financial markets, well known as fickle and irrational beasts, will at some point start to be much more sensitive to the structural change in the telco industry and seek a new direction. Unreasonably perhaps, they will expect change to happen quickly, and if this is not apparent, they will demand new leaders but by then it may be too late.

Next steps for STL Partners and Telco 2.0

Telco 2.0 first described the core challenges facing the industry six years ago in ‘How to make money in an IP world‘, and proposed the ‘two-sided telecoms business model‘ as a key part of the solution four years ago. Over the last year we have published the ‘Roadmap to New Telco 2.0 Business Models‘ describing core innovations needed, and ‘Dealing with the Disruptors – Google, Apple, Facebook, Skype and Amazon‘ outlining strategies in the adjacent competitive landscape.

We’re now driving a range of implementation projects with individual players and collaborative consortiums and will be publishing a further detailed Telco 2.0 implementation guide later this year. Through our research we will also be benchmarking telcos’ strategies, to help the capital markets better understand how to make investment choices in the industry, and looking in-depth at creative strategies in voice and messaging, m-commerce, cloud services and M2M, as well as continuing our work with the World Economic Forum on one of the biggest prizes, how telcos can play a pivotal role in enabling the emergence of a new class of economic asset, ‘Personal Data‘.

We will also be running further invitation only Executive Brainstorms in Dubai (November 6-7, 2012), Singapore (4-5 December, 2012), Silicon Valley (19-20 March 2013), and London (23-24 April, 2013). Email contact@stlpartners.com or call +44 (0) 207 243 5003 to find out more.    

Support for Key Findings

The Platform is burning

Figure 2 – Delegates broadly agreed with STL’s UK Revenue forecast

STL Partners UK Revenue Forecast (June 2012)

Chris Barraclough, MD and Chief Strategist, Telco 2.0 / STL Partners, presented an example analysis of voice and data revenues from the UK market, and predicted a 24% decline from the peak in 2009 to 2018.

Delegates broadly supported this analysis, with over half saying they thought this was ‘about right’. We will be conducting and publishing further analysis in the top 5 European markets over the next few months.

NB The original ‘burning platform’ reference comes from this article describing a choice between certain death and possible death, and is now used to describe a situation where people are forced to act by dint of the alternative being somewhat worse. Nokia recently made ‘burning platform’ a famous phrase in the handset part of the telecoms sector, but it’s now relevant to telcos themselves as they face significant declines in their core revenues.

To read the note in full, including the following sections detailing support for the analysis…

  • Time is short
  • Money is hard to find
  • The right people are hard to find
  • Customers will not solve the industry’s problems
  • It’s tricky to organise innovation and change at scale
  • Collaboration: the Prisoners’ Dilemma
  • It’s hard to change a winning formula (even when you are losing)
  • Next steps

…and the following figures…

  • Figure 1 – The burning platform illustrated: e.g. forecast decline in UK revenues
  • Figure 2 – Delegates broadly agreed with STL’s UK Revenue forecast
  • Figure 3 – Time is running out for telcos
  • Figure 4 – The business case for Telco OTT Voice and Messaging is complex
  • Figure 5 – Telcos need to transform skills, systems, structures and incentives
  • Figure 6 – Upstream customers’ views on telco capabilities
  • Figure 7 – KPN is building innovation into the core rather than a separate business unit
  • Figure 8 – The Prisoners’ Dilemma
  • Figure 9 – It’s difficult to get the timing of new investments right 

Members of the Telco 2.0 Executive Briefing Subscription Service and the Telco 2.0 Transformation stream can download the full 16 page report in PDF format hereNon-Members, please subscribe here. For this or other enquiries, please email contact@telco2.net / call +44 (0) 207 247 5003.

Facebook: what the pre-IPO S-1 filing revealed

Summary: New figures released in Facebook’s S-1 filing for its IPO stack up with Telco 2.0’s previous analysis of Facebook’s performance for our report ‘Dealing with the Disruptors’. This further strengthens our views that many mooted valuations are overblown, and that Facebook will seek new sources of value in communications. (February 2012, Executive Briefing Service, Dealing with Disruption Stream).

Facebook user saturation bubble chart

  Read in Full (Members only)  Buy a single user license online  To Subscribe click here

Below is an extract from this 23 page Telco 2.0 Report that can be downloaded in full in PDF format by members of the Telco 2.0 Executive Briefing service and the Telco 2.0 Dealing with Disruption Stream here. Non-members can subscribe here, buy a Single User license for this report online here for £595 (+VAT for UK buyers), or for multi-user licenses or other enquiries, please email contact@telco2.net / call +44 (0) 207 247 5003. We’ll also be discussing our findings and more on Facebook at the Silicon Valley (27-28 March) and London (12-13 June) New Digital Economics Brainstorms.

To share this article easily, please click:


Introduction

The Facebook public share flotation is underway and as part of the process, it has published its first set of financial statements which detail financial trading and key performance indicators for the previous three years for their S-1 filing with the US Securities Exchange Commission (SEC)

The Telco 2.0 Team has recently analysed Facebook’s strategy and business model in our strategy report Dealing with the ‘Disruptors’: Google, Apple, Facebook, Microsoft/Skype and Amazon. Back in August 2011 we published a preview (Facebook: really ‘worth’ $30 billion max – $100 billion is hype), and we’ve now taken the opportunity to revisit our analysis in the light of the new data from Facebook’s S-1 filing.

Overview of findings

Figure 1: STL Forecast vs. Actuals from Facebook S-1

2011 (figures in millions)

Facebook S-1

Telco 2.0 forecast

Users

845

800

Revenue

$3,711

$3,500

Free Cash Flow

$470

$438

Facebook has a remarkable set of financials for a company so young.

Nonetheless, the Telco 2.0 Team stands by its original model and conclusions, which were that many mooted valuations of Facebook were too high given its current services and growth profile, and that the discrepancy would compel Facebook to expand into adjacent fields. The publication of the Facebook Initial Public Offering (IPO) affirms this belief. If Facebook attains anywhere near the expected valuation, they will have a share currency which will make expansion through mergers and acquisitions easier to achieve.

Our valuation of Facebook was US$30bn and we see no trading or key performance indicators in the S-1 filing which would make us alter our valuation. This compares to various reports which indicate a valuation for Facebook of US$100bn.

Our estimates (reviewed in this report) imply a p/e of 30 at launch, which would be consistent with Facebook being considered more of a growth stock than the Google of 2011, in an environment much less bullish than that of 2004.

Though as our friend Richard Kramer, MD of Arete financial research says, “tech stock valuations are frequently irrational”, so the market may well go crazy for Facebook at IPO. However, there has to be a point where reality bites, and the pressure on Facebook to find new revenues will be intense.

Section 2: Peer Comparison

The Facebook IPO filing allows a comparison with two companies who built great businesses built upon networks: Search (as represented by Google) and Mobile (as represented by Vodafone)

Figure 1: Three major tech companies, the first nine years

Facebook google Vodafone first 9 years revenue

Source: STL Partners analysis of company records

A good start

Vodafone and Facebook show similar revenue growth over the first nine years. However, Google stands out because it is all about discovery, and for advertisers, generates potential leads. As we’ve said before, this is a huge challenge for Facebook moving forward: how can it move beyond brand advertising to lead generation, or failing that, getting users to pay for services via Facebook Credits.

Figure 2: A Dash to 45+% Margins

Facebook Google Vodafone first 9 years EBITDA

Source: STL Partners analysis of company records

Facebook has the highest profit (EBITDA) margin at this stage of development even though, as advertising-funded businesses, both Facebook and Google suffered early start-up losses while building the audience and attention that appeal to advertisers.

However, when we examine the current state in terms of absolute revenues, cash and profits, Facebook is far behind both Vodafone and Google in absolute numbers, and requires huge ongoing growth to deserve anywhere near the valuation of $100bn quoted in some quarters.

Figure 3: Comparisons: Facebook, Google, Vodafone

2011 Results

Facebook

Google

Vodafone (*)

Revenue

$1.55bn

$37.9bn

$72.6bn

Free Cash Flow

$0.470bn

$11.1bn

$11.1bn

Enterprise Value (Market Capitalisation plus/(minus) Net Debt/(Cash)

$100bn (#)

$153bn

$181bn

*Vodafone figures are for the year 2010/11 (ending Mar-2011) and converted to $’s using cable rate of 1.58.

#The IPO price of Facebook has not yet been fixed, but the press seem focussed upon a $100bn valuation

To read the note in full, including the following analysis…

  • Section 1: Introduction
  • Overview of findings
  • Section 2: Peer Comparison
  • Section 3: Exploring Growth Opportunities
  • 3.1 The challenges of continuing growth
  • 3.2 Attracting More Attention
  • 3.3 Selling More Ads
  • 3.4 Getting more from mobile
  • 3.5 Extending payments
  • 3.6 Moving into communications
  • 3.7 Facebook Web Services
  • 3.8 Possible Acquisitions
  • 4. Risks
  • 4.1 Privacy
  • 4.2 Competition
  • 4.3 The “Once Cool Nightclub Effect”
  • 5. Summary
  • Index


…and the following charts…

  • Figure 1: STL Forecast vs. Actuals from Facebook S-1
  • Figure 2: Three major tech companies, the first nine years
  • Figure 3: A Dash to 45+% Margins
  • Figure 4: Comparisons: Facebook, Google, Vodafone
  • Figure 5: Facebook Geographical Breakdown
  • Figure 6: Facebook Struggling in Asia
  • Figure 7: Tapping Out the User Pool
  • Figure 8: Leading User Engagement
  • Figure 9: Social Networks – biggest single category by user time online
  • Figure 10: Advertising Dominates Facebook’s Revenue
  • Figure 11: ARPU flat for last 12 months
  • Figure 12: Revenue-generating dominated by the USA
  • Figure 13: Consolidation in display ads may have some way to run yet
  • Figure 14: Google + Explodes Out Of The Blocks
  • Figure 15: STL Partners Facebook valuation assumptions


Members of the Telco 2.0 Executive Briefing Subscription Service and the Telco 2.0 Dealing with Disruption Stream can download the full 23 page report in PDF format here. Non-Members, please subscribe here, buy a Single User license for this report online here for £595 (+VAT for UK buyers), or for multi-user licenses or other enquiries, please email contact@telco2.net / call +44 (0) 207 247 5003.

Organisations, geographies, people and products referenced: 0.facebook.com, Amazon, Amazon Web Services (AWS), AOL, Apple, Arete, Asia, Bebo, China, Comscore, Deezer, Deutsche Telekom, Europe, Facebook, Facebook Credits, Friends Reunited, Google, Google +, Google Buzz, ITV, Japan, Korea, LiveJournal, Microsoft, MySpace, Netflix, newsfeeds, North America, Opera, Orkut, Pandora, Richard Kramer, RIM, Skype, Sponsored Stories, Spotify, Twitter, UK, US Securities Exchange Commission (SEC), USA Vodafone, WhatsApp, Yahoo!, YouTube, Zynga.

Technologies and industry terms referenced: Advertising, ARPU, Bass diffusion model, EBITDA, Facebook fatigue, gaming, Initial Public Offering (IPO), Mobile, monthly active users (MAU), music, platform, Privacy, S-1, Search, Social Networks, valuation, video.

Dealing with the ‘Disruptors’: Google, Apple, Facebook, Microsoft/Skype and Amazon (Updated Extract)

Executive Summary (Extract)

This report analyses the strategies behind the success of Amazon, Apple, Facebook, Google and Skype, before going on to consider the key risks they face and how telcos and their partners should deal with these highly-disruptive Internet giants.

As the global economy increasingly goes digital, these five companies are using the Internet to create global brands with much broader followings than those of the traditional telecoms elite, such as Vodafone, AT&T and Nokia. However, the five have markedly different business models that offer important insights into how to create world-beating companies in the digital economy:

  • Amazon: Amazon’s business-to-business Marketplace and Cloud offerings are text-book examples of how to repurpose assets and infrastructure developed to serve consumers to open up new upstream markets. As the digital economy goes mobile, Amazon’s highly-efficient two-sided commerce platform is enabling it to compete effectively with rivals that control the leading smartphone and tablet platforms – Apple and Google.
  • Apple: Apple has demonstrated that, with enough vision and staying power, an individual company can single-handedly build an entire ecosystem. By combining intuitive and very desirable products, with a highly-standardised platform for software developers, Apple has managed to create an overall customer experience that is significantly better than that offered by more open ecosystems. But Apple’s strategy depends heavily on it continuing to produce the very best devices on the market, which will be difficult to sustain over the long-term.
  • Facebook: A compelling example of how to build a business on network effects. It took Facebook four years of hard work to reach a tipping point of 100 million users, but the social networking service has been growing easily and rapidly ever since. Facebook has the potential to attract 1.4 billion users worldwide, but only if it continues to sidestep rising privacy concerns, consumer fatigue or a sudden shift to a more fashionable service.
  • Google: The search giant’s virtuous circle keeps on spinning to great effect – Google develops scores of free, and often-compelling, Internet services, software platforms and apps, which attract consumers and advertisers, enabling it to create yet more free services. But Google’s acquisition of Motorola Mobility risks destabilising the Android ecosystem on which a big chunk of its future growth depends.
  • Skype: Like Facebook and Google, Skype sought users first and revenues second. By creating a low-cost, yet feature-rich, product, Skype has attracted more than 660 million users and created sufficient strategic value to persuade Microsoft to hand over $8.5bn. Skype’s share of telephony traffic is rising inexorably, but Google and Apple may go to great lengths to prevent a Microsoft asset gaining a dominant position in peer-to-peer communications.

The strategic challenge

There is a clear and growing risk that consumers’ fixation on the products and services provided by the five leading disruptors could leave telcos providing commoditised connectivity and struggling to make a respectable return on their massive investment in network infrastructure and spectrum.

In developed countries, telcos’ longstanding cash-cows – mobile voice calls and SMS – are already being undermined by Internet-based alternatives offered by Skype, Google, Facebook and others. Competition from these services could see telcos lose as much as one third of their messaging and voice revenues within five years (see Figure 1) based on projections from our global survey, carried out in September 2011.

Figure 1 – The potential combined impact of the disruptors on telcos’ core services

Impact of Google, Apple, Facebook, Microsoft/Skype, Amaxon on telco services

Source: Telco 2.0 online survey, September 2011, 301 respondents

Moreover, most individual telcos lack the scale and the software savvy to compete effectively in other key emerging mobile Internet segments, such as local search, location-based services, digital content, apps distribution/retailing and social-networking.

The challenge for telecoms and media companies is to figure out how to deal with the Internet giants in a strategic manner that both protects their core revenues and enables them to expand into new markets. Realistically, that means a complex, and sometimes nuanced, co-opetition strategy, which we characterise as the “Great Game”.

In Figure 3 below, we’ve mapped the players’ roles and objectives against the markets they operate in, giving an indication of the potential market revenue at stake, and telcos’ generic strategies.

Figure 3- The Great Game – Positions, Roles and Strategies

The Great Game - Telcos, Amazon, Apple, Google, Facebook, Skype/Microsoft

Our in-depth analysis, presented in this report, describes the ‘Great Game’ and the strategies that we recommend telcos and others can adopt in summary and in detail. [END OF FIRST EXTRACT]

Report contents

  • Executive Summary [5 pages – including partial extract above]
  • Key Recommendations for telcos and others [20 pages]
  • Introduction [10 pages – including further extract below]


The report then contains c.50 page sections with detailed analysis of objectives, business model, strategy, and options for co-opetition for:

  • Google
  • Apple
  • Facebook
  • Microsoft/Skype
  • Amazon

Followed by:

  • Conclusions and recommendations [10 pages]
  • Index

The report includes 124 charts and tables.

The rest of this page comprises an extract from the report’s introduction, covering the ‘new world order’, investor views, the impact of disruptors on telcos, and how telcos are currently fighting back (including pricing, RCS and WAC), and further details of the report’s contents. 


Introduction

The new world order

The onward march of the Internet into daily life, aided and abetted by the phenomenal demand for smartphones since the launch of the first iPhone in 2007, has created a new world order in the telecoms, media and technology (TMT) industry.

Apple, Google and Facebook are making their way to the top of that order, pushing aside some of the world’s biggest telcos, equipment makers and media companies. This trio, together with Amazon and Skype (soon to be a unit of Microsoft), are fundamentally changing consumers’ behaviour and dismantling longstanding TMT value chains, while opening up new markets and building new ecosystems.

Supported by hundreds of thousands of software developers, Apple, Google and Facebook’s platforms are fuelling innovation in consumer and, increasingly, business services on both the fixed and mobile Internet. Amazon has set the benchmark for online retailing and cloud computing services, while Skype is reinventing telephony, using IP technology to provide compelling new functionality and features, as well as low-cost calls.

On their current trajectory, these five companies are set to suck much of the value out of the telecoms services market, substituting relatively expensive and traditional voice and messaging services with low-cost, feature-rich alternatives and leaving telcos simply providing data connectivity. At the same time, Apple, Amazon, Google and Facebook have become major conduits for software applications, games, music and other digital content, rewriting the rules of engagement for the media industry.

In a Telco2.0 online survey of industry executives conducted in September 2011, respondents said they expect Apple, Google, Facebook and Skype together to have a major impact on telcos’ voice and messaging revenues in the next three to five years . Although these declines will be partially compensated for by rising revenues from mobile data services, the respondents in the survey anticipate that telcos will see a major rise in data carriage costs (see Figure 1 – The potential combined impact of the disruptors on telcos’ core services).

In essence, we consider Amazon, Apple, Facebook, Google and Skype-Microsoft to be the most disruptive players in the TMT ecosystem right now and, to keep this report manageable, we have focused on these five giants. Still, we acknowledge that other companies, such as RIM, Twitter and Baidu, are also shaping consumers’ online behaviour and we will cover these players in more depth in future research.

The Internet is, of course, evolving rapidly and we fully expect new disruptors to emerge, taking advantage of the so-called Social, Local, Mobile (SoLoMo) forces, sweeping through the TMT landscape. At the same time, the big five will surely disrupt each other. Google is increasingly in head-to-head competition with Facebook, as well as Microsoft, in the online advertising market, while squaring up to Apple and Microsoft in the smartphone platform segment. In the digital entertainment space, Amazon and Google are trying to challenge Apple’s supremacy, while also attacking the cloud services market.

Investor trust

Unlike telcos, the disruptors are generally growing quickly and are under little, or no, pressure from shareholders to pay dividends. That means they can accumulate large war chests and reinvest their profits in new staff, R&D, more data centres and acquisitions without any major constraints. Investors’ confidence and trust enables the disruptors to spend money freely, keep innovating and outflank dividend-paying telcos, media companies and telecoms equipment suppliers.

By contrast, investors generally don’t expect telcos to reinvest all their profits in their businesses, as they don’t believe telcos can earn a sufficiently high return on capital. Figure 16 shows the dividend yields of the leading telcos (marked in blue). Of the disruptors, only Microsoft (marked in green) pays a dividend to shareholders.

Figure 16: Investors expect dividends, not growth, from telcos

Figure 1 Chart Google Apple Facebook Microsoft Skype Amazon Sep 2011 Telco 2.0

Source: Google Finance 2/9/2011

The top telcos’ turnover and net income is comparable, or superior, to that of the leading disruptors, but this isn’t reflected in their respective market capitalisations. AT&T’s turnover is approximately four times that of Google and its net income twice as great, yet their market cap is similar. Even accounting for their different capital structures, investors clearly expect Google to grow much faster than AT&T and syphon off more of the value in the TMT sector.

More broadly, the disparity in the market value between the leading disruptors and the leading telcos’ market capitalisations suggest that investors expect Apple, Microsoft and Google’s revenues and profits to keep rising, while they believe telcos’ will be stable or go into decline. Figure 17 shows how the market capitalisation of the disruptors (marked in green) compares with that of the most valuable telcos (marked in blue) at the beginning of September 2011.

Figure 17: Investors value the disruptors highly

Figure 2 Chart Google Apple Facebook Microsoft Skype Amazon Market Capitalisation Sep 2011 Telco 2.0

Source: Google Finance 2/9/2011 (Facebook valued at Facebook $66bn based on IPG sale in August 2011)

Impact of disruptors on telcos

It has taken longer than many commentators expected, but Internet-based messaging and social networking services are finally eroding telcos’ SMS revenues in developed markets. KPN, for example, has admitted that smartphones, equipped with data communications apps (and Whatsapp in particular), are impacting its voice and SMS revenues in its consumer wireless business in its home market of The Netherlands (see Figure 18). Reporting its Q2 2011 results, KPN said that changing consumer behaviour cut its consumer wireless service revenues in Holland by 2% year-on-year.

Figure 18: KPN reveals falling SMS usage

Figure 3 Chart Google Apple Facebook Microsoft Skype Amazon KPN Trends Sep 2011 Telco 2.0

Source: KPN Q2 results

In the second quarter, Vodafone also reported a fall in messaging revenue in Spain and southern Africa, while Orange saw its average revenue per user from data and SMS services fall in Poland.

How telcos are fighting back

Big bundles

Carefully-designed bundles are the most common tactic telcos are using to try and protect their voice and messaging business. Most postpaid monthly contracts now come with hundreds of SMS messages and voice minutes, along with a limited volume of data, bundled into the overall tariff package. This mix encourages consumers to keep using the telcos’ voice and SMS services, which they are paying for anyway, rather than having Skype or another VOIP service soak up their precious data allowance.

To further deter usage of VOIP services, KPN and some other telcos are also creating tiered data tariffs offering different throughput speeds. The lower-priced tariffs tend to have slow uplink speeds, making them unsuitable for VOIP (see Figure 19 below). If consumers want to use VOIP, they will need to purchase a higher-priced data tariff, earning the telco back the lost voice revenue.

Figure 19: How KPN is trying to defend its revenues

Figure 4 Chart Google Apple Facebook Microsoft Skype Amazon KPN Defence Sep 2011 Telco 2.0

Source: KPN’s Q2 results presentation

Of course, such tactics can be undermined by competition – if one mobile operator in a market begins offering generous data-only tariffs, consumers may well gravitate towards that operator, forcing the others to adjust their tariff plans.

Moreover, bundling voice, SMS and data will generally only work for contract customers. Prepaid customers, who only want to pay for what they are use, are naturally charged for each minute of calls they make and each message they send. These customers, therefore, have a stronger financial incentive to find a free WiFi network and use that to send messages via Facebook or make calls via Skype.

The Rich Communications Suite (RCS)

To fend off the threat posed by Skype, Facebook, Google and Apple’s multimedia communications services, telcos are also trying to improve their own voice and messaging offerings. Overseen by mobile operator trade association the GSMA, the Rich Communications Suite is a set of standards and protocols designed to enable mobile phones to exchange presence information, instant messages, live video footage and files across any mobile network.

In an echo of social networks, the GSMA says RCS will enable consumers to create their own personal community and share content in real time using their mobile device.

From a technical perspective, RCS uses the Session Initiation Protocol (SIP) to manage presence information and relay real-time information to the consumer about which service features they can use with a specific contact. The actual RCS services are carried over an IP-Multimedia Subsystem (IMS), which telcos are using to support a shift to all-IP fixed and mobile networks.

Deutsche Telekom, Orange, Telecom Italia, Telefonica and Vodafone have publically committed to deploy RCS services, indicating that the concept has momentum in Europe, in particular. The GSMA says that interoperable RCS services will initially be launched by these operators in Spain, Germany, France and Italy in late 2011 and 2012. [NB We’ll be discussing RCSe with some of the operators at our EMEA event in London in November 2011.]

In theory, at least, RCS will have some advantages over many of the communications services offered by the disruptors. Firstly, it will be interoperable across networks, so you’ll be able to reach people using different service providers. Secondly, the GSMA says RCS service features will be automatically available on mobile devices from late 2011 without the need to download and install software or create an account (by contrast, Apple’s iMessage service, for example, will only be installed on Apple devices).

But questions remain over whether RCS devices will arrive in commercial quantities fast enough, whether RCS services will be priced in an attractive way and will be packaged and marketed effectively. Moreover, it isn’t yet clear whether IMS will be able to handle the huge signalling load that would arise from widespread usage of RCS.

Internet messaging protocols, such as XMPP, require the data channel to remain active continuously. Tearing down and reconnecting generates lots of signalling traffic, but the alternative – maintaining a packet data session – will quickly drain the device’s battery.
By 2012, Facebook and Skype may be even more entrenched than they are today and their fans may see no need to use telcos’ RCS services.

Competing head-on

Some of the largest mobile operators have tried, and mostly failed, to take on the disruptors at their own game. Vodafone 360, for example, was Vodafone’s much-promoted, but ultimately, unsuccessful €500 million attempt to insert itself between its customers and social networking and messaging services from the likes of Facebook, Windows Live, Google and Twitter.

As well as aggregating contacts and feeds from several social networks, Vodafone 360 also served as a gateway to the telco’s app and music store. But most Vodafone customers didn’t appear to see the need to have an aggregator sit between them and their Facebook feed. During 2011, the service was stripped back to be just the app and music store. In essence, Vodafone 360 didn’t add enough value to what the disruptors are already offering. We understand, from discussions with executives at Vodafone, that the service is now being mothballed.

A small number of large telcos, mostly in emerging markets where smartphones are not yet commonplace, have successfully built up a portfolio of value-added consumer services that go far beyond voice and messaging. One of the best examples is China Mobile, which claims more than 82 million users for its Fetion instant messaging service, for example (see Figure 20 – China Mobile’s Internet Services).

Figure 20 – China Mobile’s Internet Services

China Mobile Services, Google, Apple, Facebook Report, Telco 2.0

Source: China Mobile’s Q2 2011 results

However, it remains to be seen whether China Mobile will be able to continue to attract so many customers for its (mostly paid-for) Internet services once smartphones with full web access go mass-market in China, making it easier for consumers to access third-parties’ services, such as the popular QQ social network.

Some telcos have tried to compete with the disruptors by buying innovative start-ups. A good example is Telefonica’s acquisition of VOIP provider Jajah for US$207 million in January 2010. Telefonica has since used Jajah’s systems and expertise to launch low-cost international calling services in competition with Skype and companies offering calling cards. Telefonica expects Jajah’s products to generate $280 million of revenue in 2011, primarily from low-cost international calls offered by its German and UK mobile businesses, according to a report in the FT.

The Wholesale Applications Community (WAC)

Concerned about their growing dependence on the leading smartphone platforms, such as Android and Apple’s iOS, many of the world’s leading telcos have banded together to form the Wholesale Applications Community (WAC).

WAC’s goal is to create a platform developers can use to create apps that will run across different device operating systems, while tapping the capabilities of telcos’ networks and messaging and billing systems.

At the Mobile World Congress in February 2011, WAC said that China Mobile, MTS, Orange, Smart, Telefónica, Telenor, Verizon and Vodafone are “connected to the WAC platform”, while adding that Samsung and LG will ensure “that all devices produced by the two companies that are capable of supporting the WAC runtime will do so.”

It also announced the availability of the WAC 2.0 specification, which supports HTML5 web applications, while WAC 3.0, which is designed to enable developers to tap network assets, such as in-app billing and user authentication, is scheduled to be available in September 2011.

Ericsson, the leading supplier of mobile networks, is a particularly active supporter of WAC, which also counts leading Alcatel-Lucent, Huawei, LG Electronics, Qualcomm, Research in Motion, Samsung and ZTE, among its members.

In theory, at least, apps developers should also throw their weight behind WAC, which promises the so far unrealised dream of “write once, run anywhere.” But, in reality, games developers, in particular, will probably still want to build specific apps for specific platforms, to give their software a performance and functionality edge over rivals.

Still, the ultimate success or failure of WAC will likely depend on how enthusiastically Apple and Google, in particular, embrace HTML5 and actively support it in their respective smartphone platforms. We discuss this question further in the Apple and Google chapters of this report.

Summarising current telcos’ response to disruptors


Telcos, and their close allies in the equipment market, are clearly alert to the threat posed by the major disruptors, but they have yet to develop a comprehensive game plan that will enable them to protect their voice and messaging revenue, while expanding into new markets.

Collective activities, such as RCS and WAC, are certainly necessary and worthwhile, but are not enough. Telcos, and companies across the broader TMT ecosystem, need to also adapt their individual strategies to the rise of Amazon, Apple, Facebook, Google and Skype-Microsoft. This report is designed to help them do that.

[END OF EXTRACT]


Your Text is on Fire: OTT’s to burn 40% SMS revenue by 2015

Introduction

Background

STL Partners’ New Digital Economics Executive Brainstorm EMEA, took place from 8-10 November in London, and brought together 5 events in 1 venue, co-locating the Telco 2.0, M-Commerce, 2.0 Cloud 2.0, M2M 2.0 and Digital Entertainment 2.0 brainstorms, using a unique and widely acclaimed interactive format called ‘Mindshare’ to help clarify the important ‘next steps’ for both individual companies and industries.

Building on output from previous brainstorms and new market research and analysis from STL Partners, it focuses on new growth opportunities at the intersection of Telecoms, Media and Technology. The keynote Strategy Report Dealing with the ‘Disruptors’: Google, Apple, Facebook, Microsoft/Skype and Amazon was launched at the brainstorm, and a similar agenda will be discussed at the New Digital Economics – APAC Brainstorm, Accelerating New Growth Opportunities in Telecoms, Media and Tech, 30 November – 1 December, Capella Resort, Singapore.

This note provides an extract of key take-outs and votes on the ‘Voice and Messaging 2.0’ sessions from the EMEA brainstorm for Telco 2.0 readers and subscribers.

Brainstorm participants will also receive detailed write-ups and analysis from the event sessions they registered for, and we will be using the input from all the sessions of the EMEA, Americas and APAC brainstorms as input to new analysis across all of the topics covered in the coming months.

The telco business model challenge is getting acute in EMEA

Your text platform is on fire

Telco SMS revenue will decline on average by around 40% across the Europe and Middle East region by 2015 according to the senior execs at this month’s Telco 2.0 brainstorm in London. The main cause is competitive pressure from so-called ‘Over-The-Top’ (OTT) alternatives (Facebook, Skype, Google, BBM, etc).

Figure 1 – Predicted decline of mobile telco messaging revenues

EMEA 2011 Messaging Decline Chart 40% Telco 2.0


The cause of this predicted decline was unambiguous – the impact of so-called Over The Top (OTT) players’ messaging services like iMessage, BlackBerry Messenger, Whatsapp, Skype and Facebook.

Figure 2 – Causes of predicted mobile messaging decline

EMEA 2011 Messaging Decline Chart OTT Causes Telco 2.0

This is similar to the impact of the new services that we saw predicted in the survey conducted across 300 senior execs in the research for our latest report Dealing with the ‘Disruptors’: Google, Apple, Facebook, Microsoft/Skype and Amazon.

Indeed, KPN and some Middle-Eastern operators have reported even higher percentage declines among users of certain devices and applications.

The Voice platform is smoking too

While not as pressing as the impact on Messaging revenues, delegates had a pessimistic view of the prospects for voice revenues.

Figure 3 – Predicted decline of mobile carrier voice revenues

EMEA 2011 Voice Decline Chart 20% Telco 2.0

The causes behind the voice declines were seen as somewhat broader, with competition and regulation taking up 56% compared to 16% for Messaging, although ‘Responding to price pressures from OTT alternatives’ was still the main choice with 44% of the vote.

Figure 4 – Causes of predicted mobile voice revenue decline

EMEA 2011 Voice Decline Chart 20% reasons Telco 2.0

All in all, it looks as if the pressures on voice and messaging revenues are beginning to bite as we originally predicted in our 2008 strategy report Lessons from Internet Communications Services – Skype, Facebook, and others: how Telcos can adapt and compete – although the options for adaptation and competition have narrowed somewhat due to the success of the so-called OTT players and the relative lack of action by telcos.

Who should telcos fear most?

Delegates did not have an entirely consistent view of the threats and opportunities presented by the OTT players as shown below.

Figure 5 – Who should telcos support / fear most in voice and messaging?

EMEA 2011 Voice and Messaging Decline Chart OTT Fears Telco 2.0

This is not entirely surprising given the relative attractions and perils presented in different scenarios as we describe in Dealing with the ‘Disruptors’: Google, Apple, Facebook, Microsoft/Skype and Amazon.

However, what is consistent for operators is that:

  • There is most to gain, in the short-term at least, in supporting Microsoft as a counterweight to Apple and Google;
  • RIM / Blackberry is perceived to have the least power – and also presents a opportunity as a counterweight to Apple and Google, albeit a weakened one;
  • Facebook is indeed a ‘double-edged sword’ – as a threat in terms of its potential to enter communications and an opportunity in driving data use;
  • Apple and Google are the established players with the most current power, and hence threat.

Will RCS-e help?

At the November 2011 EMEA Brainstorm, Cenk Serdar, Director, Data & Communications Service, Vodafone, and Rainer Deutschmann, SVP Core Telco Products, DTAG, carried out a live demonstration of RCS-e, the GSMA-backed future voice & messaging solution using IMS. Morten Sorby, EVP of Strategy & Regulatory Affairs, Telenor, and Andreas Bernstrom, CEO, Rebtel, joined the vibrant subsequent debate with the audience and Simon Torrance, CEO STL Partners.

The following is an anonymised top-level summary of the resulting discussions and the votes.

Getting to market

Instant messaging, video, and file-sharing are the key features in RCS-e, and are being introduced as a refined set compared to the original specifications in order to bring applications to market as quickly as possible. This refinement was lead by the E5 Group of top European operators.

The most important item on the future roadmap is service discovery. Beyond that, contacts transfer, location sharing, and multi-device operation are on the to-do list.

Interestingly, it seems that some of the RCS-e use cases focus on supporting enterprise applications such as trying to provide a platform for better CRM and person-to-organisation applications (for example, an enhanced helpdesk for a furniture company). This has consequences for the design of APIs and business relationships facing upstream towards enterprises and developers.

Arguments for success or failure

Arguments put forward at the Brainstorm for RCS-e included:

  • While Apple’s iMessenger and RIM’s BlackBerry Messenger are impressive products, they aren’t ubiquitious or necessarily deeply integrated with other applications in the way that SMS, MMS, and telephony could be.
  • RCS-e doesn’t require the user to download any new apps – the vast majority of users aren’t already using sophisticated communications tools like smartphones.
  • RCS-e ‘is a service for mass-market users’ rather than just smartphones.
  • Seven of the major device makers are committed, and the RCS-e standard is an open standard, so nothing prevents Apple iOS or RIM BBX developers implementing it independently.
  • RCS-e is building its global footprint. Spain, France, and Germany will launch sequentially between now and the first half of 2012. South Korea is committed to deploying RCS-e, and discussions were going on with other Asian countries.

Arguments put forward against RCS-e included:

  • Smartphones will change customer behaviour and catalyse change as more people get them. Horace Dediu, Associate Analyst at STL Partners, predicts that Western Europe and North America will go 100% smartphone within 18 months – so control will be further ceded to the Smartphone OS owners.
  • Cost is the main reason users move to Skype and similar services, and RCS-e doesn’t reduce costs.
  • The feature set just isn’t that convincing compared to what else can be done using VOIP services and other smartphone apps.

Delegates were split in their views on the likely efficacy of RCS.

Figure 6 – Will RCS-e offer an attractive alternative to OTT services?

EMEA 2011 RCS-e attractive vs OTT Telco 2.0 chart

Telco 2.0’s questions

The value of RCS-e is a subject that stirs strong opinions from across the industry, and it was intriguing to see the extreme polarity of delegate views at the Brainstorm.

Figure 7 – Is RCS-e ‘too little too late’?

EMEA 2011 RCS-e too little too late Telco 2.0 chart

Telco 2.0 will be conducting an in-depth analysis of Messaging and Voice 2.0 strategies, including RCS-e and its prospects in coming months.

Our questions on RCS-e at this point are as follows.

How many Christmas 2012 handsets will have RCS-e?

An critical factor is whether the wave of cheap smartphones will support RCS-e and if so, whether they support it well or only half-heartedly. The great bulk of them will be Android devices, and therefore the key vendors will be HTC and Samsung.
HTC are signed up, but their device line-up is concentrated on the high end, and they are very much second to Samsung in terms of volume.

Samsung is shipping more Androids than any other vendor, and indeed more smartphones than any other vendor, and they have a portfolio of products from the Ace to the Galaxy S II rather than a single top-end hero product. A key question is to what extent across their handset range they will sign up to RCS-e.

Are the features really convincing?

It is notoriously difficult to accurately predict the appeal of features in advance of consumer trials. However, a challenge for operators will be that, unlike Apple, they will have limited control of the design and implementation of the end-to-end customer experience.
How quickly can RCS-e evolve?

An important issue regarding services “embedded” in the core network or the device operating system is that they are unlikely to get upgrades anywhere near as quickly as either standalone applications or Web services. Operators tend to be slow to push out OTA upgrades to device OS, even after the manufacturers release them, and software iterations in the core network are taken slowly for very good reasons. App developers and Web 2.0 players tend to have much faster development cycles, so in terms of both user experience design control and release iteration operators are at a disadvantage.

What is RCS-e realistically intended to achieve now?

Opinions vary on what RCS-e is meant to achieve for operators, though few people we’ve spoken to in private recently believe that RCS-e is a ‘silver-bullet’ to combat so-called ‘OTT’ revenue erosion. Indeed, there appears to be a growing minority who appear to have ‘given up’ on voice and messaging revenues.

A more tenable position perhaps is that RCS-e may help a little, and that extending the life of the Messaging and Voice revenue streams by only a few months would justify the business case. One argument we’ve heard is that RCS-e is about enhancing and protecting the telco services bundle of minutes, texts, and data.

In a wider sense, it is a move by operators to provide something new to consumers, and it may at least be a small step to revitalise their relevance to consumers. In our view, it is far from the only strategy that operators should explore.

Content

  • What else can be done?
  • A new strategy framework for Messaging and Voice 2.0 Strategies
  • Developing alternative sources of value


  • Figure 1 – Predicted decline of mobile telco messaging revenues
  • Figure 2 – Causes of predicted mobile messaging decline
  • Figure 3 – Predicted decline of mobile carrier voice revenues
  • Figure 4 – Causes of predicted mobile voice revenue decline
  • Figure 5 – Who should telcos support / fear most in voice and messaging?
  • Figure 6 – Will RCS-e offer an attractive alternative to OTT services?
  • Figure 7 – Is RCS-e ‘too little too late’?
  • Figure 8 – Strategic Messaging and Voice options for operators


Digital Money 2.0: a vision of the future of M-Commerce (ClickandBuy Presentation)

In Digital Money 2.0. Presentation by Stefan Reinhardt, SVP Mechant Services, ClickandBuy (a Deutsche Telekom company), covering a background to the company, state of the market in Germany, and its future vision for the market. Presented at EMEA Brainstorm, November 2011.

OS Wars small STL Partners Nov 2011

Download presentation here.

Links here for more on New Digital Economics brainstorms and Money and Payments research, or call +44 (0) 207 247 5003.

Extracted example slide:

Slide on Digital Money Vision, ClickandBuy, STL Partners, Telco 2.0, New Digital Economics, Nov 2011

The ‘Great Game’ – Google, Apple, Facebook, Skype, Amazon (STL Presentation)

In Amazon, Apple, Facebook, Google, Skype – the Great Game. Presentation by Chris Barraclough, Chiref Strategist and MD STL Partners, covering some of the key insights from the Telco 2.0 Strategy Report  Dealing with the ‘Disruptors’: Google, Apple, Facebook, Microsoft/Skype and Amazon. Presented at EMEA Brainstorm, November 2011.

Cloud EMEA Nov 2011 BT Financial Sector

Download presentation here.

Links here for more on New Digital Economics brainstorms and Adjacent Players and Disruptors research, or call +44 (0) 207 247 5003.

Extracted example slide (NB revenue values shown are ‘orders of magnitude’:

Slide on great game, STL Partners, Telco 2.0, Google, Apple, Facebook, Amazon, Skype, Microsoft Nov 2011nancial Services Nov 2011

Strategy 2.0: The Six Key Telco 2.0 Opportunities

A summary of the six Telco 2.0 opportunities to transform telco’s business models for success in an IP-based, post PSTN world: Core Services, Vertical Solutions, Infrastructure Services, Embedded Communications, 3rd Party Enablers, and Own Brand OTT Services. It includes an extract from the Roadmap to New Telco 2.0 Business Models, updates on latest developments, and feedback from over 500 senior TMT industry execs. (July 2011, Executive Briefing Service, Transformation Stream). Telco 2.0 Six Key Opportunity Types Chart July 2011
  Read in Full (Members only)    Buy This Report    To Subscribe

Below is an extract from this 50 page Telco 2.0 Report that can be downloaded in full in PDF format by members of the Telco 2.0 Executive Briefing service and the Telco 2.0 Transformation Stream here. Non-members can buy a Single User license for this report online here for £795 (+VAT) or subscribe here. For multiple user licenses, package deals to buy this report and the Roadmap report together, or to find out about interactive strategy workshops on this topic, please email contact@telco2.net or call +44 (0) 207 247 5003.

To share this article easily, please click:

//

Background – The Roadmap to New Telco 2.0 Business Models

The Telco 2.0 Strategy Report ’The Roadmap to New Telco 2.0 Business Models’ published in April 2011 examines ways in which operators can extend and solidify their roles in the future ecosystem, making themselves a cornerstone of a new structure. This Executive Briefing contains extracts from the full Strategy Report, and updates and validates it with feedback from recent Telco 2.0 and New Digital Economics Executive Brainstorms in EMEA and the Americas.

Updating the Telecoms Business Model

For the past four years, STL Partners has been using an iconic diagram (see Figure 1, below) to illustrate our views about the role of ‘two-sided’ business models in the telecoms industry. It highlights the critical role of a telecom operator in enabling interactions between its traditional end-user (“downstream”) customers and a variety of new “upstream” parties, such as application developers and media companies. In 2007, we also introduced the concept of “distribution” of Telcos’ core services through these upstream channels, with the addition of a range of value-added B2B services based around the inherent capabilities of the network and service platform.

This concept of two-sided business models originally introduced in the Telco 2.0 Strategy Report The $125Bn ‘Two-Sided’ Telecoms Market Opportunity has to a degree become synonymous with Telco 2.0, and has been widely embraced by the industry. We have now decided it is time to update our definition of “Telco 2.0” to reflect both business model evolution and fundamental changes in the telecoms industry structure itself. While these trends are indeed driving adoption of multi-sided business models, we have also observed that that are redefining the landscape for ‘traditional’ one-sided telecom model as well.

Figure 1: The high-level Telco 2.0 Business Model diagram

Telco 2.0 Roadmap Two-Sided Business Model Schematic Chart

Source: STL Partners / Telco 2.0

Pressure on All Sides

In particular, it is critical to understand the increasing pressure on Telcos’ traditional markets and value propositions, on all sides – not just by Internet/media companies (so-called “over-the-top” players), but also by third-party infrastructure operators and wholesalers, network and device vendors, governments, and even end-users themselves. In addition, there have been delays and organisational complexities in exploiting the true potential of some “upstream” opportunities.

Newcomers such as Apple have developed their own communications/content ecosystems, regulators have pushed for structural separation, Governments have funded wholesale networks and application developers have cherry-picked lucrative domains such as social networking. Network equipment vendors are helping operators convert capex to opex – but in the process are themselves capturing more industry value through outsourcing. End-users have developed work-arounds to reduce their expenditure on telco services (e.g. “missed calls”).

Figure 2 – Telcos squeezed from all sides

Telco 2.0 Roadmap Report Telecoms Industry Squeeze Competitve Forces Chart

Source: Telco 2.0, The Roadmap to New Telco 2.0 Business Models

Taken together, the impact of these trends has led Telco 2.0 to expand its framework to embrace and refine its target market domains for telcos, especially in terms of innovation around advanced new “retail” services. We feel that it is becoming even more difficult for operators to navigate through this minefield – and if they are to succeed, they will need to develop and sell more appropriate, integrated and well-designed offerings. While defensive moves have their place, there is also an urgent need to innovate – but with well-focused efforts and resources.

Originally, we spoke of three business model elements for telcos: Improved retail telecoms services; ‘Distribution’ of core telecom products and services through alternate upstream channels; and delivery to upstream customers of value-added enablers. (In the past, we did not explicitly address wholesale telco-telco services, as they were essentially “internal machinery” of the day-to-day retail business).

Figure 3 – The three opportunity areas in the original Telco 2.0 business model

Telco 2.0 3 Original Business Model Opportunities Chart

Source: Telco 2.0, The $125Bn ‘Two-Sided’ Telecoms Market Opportunity

Introducing the New Telco 2.0 Framework

A long-term, strategic framework for is needed for telcos, both in fixed and mobile sectors. While the industry has strong cash flows, it needs to redefine its own space, exploit its strengths, and seek out areas of revenue growth and strong differentiation. Telcos also need to look for sources of their own profit in areas such as managed services, rather than just exploiting the cost savings offered by vendors and outsourcers.

Figure 4 – The New Telco 2.0 Industry Framework

Telco 2.0 Roadmap Report Telecoms Industry New Industry Framework Chart

Source: Telco 2.0, The Roadmap to New Telco 2.0 Business Models

Our new framework is an evolution of the old, incorporating the two-sided model, and defining six opportunity types, comprising three existing types previously defined by Telco 2.0:

  • Core services (previously ‘Enhanced retail’), which encompasses structural and strategic improvements to existing wholesale and retail services;
  • Embedded Communications (previously ‘Distribution platform’);
  • Third-party business enablers (previously ‘B2B VAS platform’);

and extending it in three main directions:

  • A separated and richer tier of Infrastructure services;
  • Explicitly identifying the integration of telecoms, IT and networking being undertaken by operators in the corporate space – Vertical industry solutions (SI)
  • Own-brand OTT services.

The Six Telco 2.0 Opportunity Types

We have grouped the opportunities into six types shown in the following diagram and discussed further in the rest of this report.

Figure 5 – the Six Telco 2.0 Opportunity Types

Telco 2.0 Roadmap Report Telecoms Industry Six Opportunities Chart

Source: Telco 2.0, The Roadmap to New Telco 2.0 Business Models

1. Core services (previously Retail Services), which encompasses transformational structural and strategic improvements to existing mainstream “Telco 1.0” offerings such as subscriptions, telephony and broadband access. These will remain at the core of telco revenues irrespective of other shifts, enhanced by the smart and targeted delivery of improved offers, manifesting in benefits via revenue addition, up-sell, and customer satisfaction. Our research identifies a portfolio of approaches here, such as:

  • Incremental improvements to basic products’ quality or speed;
  • Exploitation of new device categories driving service adoption and usage;
  • Supply of added-value content and services;
  • Better segmentation and customisation;
  • More targeted, personalised and granular pricing;
  • Better channels to market;
  • Efforts to gain improved (and genuine) loyalty and value perception;
  • Innovative ways to drive incremental usage and spending, for example through incentives and promotions.

In parallel with the revenue drivers, operators are also focusing on cost savings, throughout network operations and other areas such as retail channel costs and commissions, device subsidies and so forth.

2. Vertical industry solutions have been developed by fixed operators over the last decade and now starting to be demanded by customers for mobile solutions too. They comprise telephony services (voice and data) being integrated with IT with the operator acting in a systems integrator role to provide a complete solution. These solutions are tailored and packaged for specific vertical industries – transport, logistics, banking, government, manufacturing, utilities, etc. Companies such as BT (with BT Global Services), Orange (with Business Services) and Deutsche Telekom (with T-Systems) are examples of companies that have moved aggressively into this area.

3. A separated and richer tier of Infrastructure services, which includes telecom capacity “bulk” wholesale, as well as more granular “distribution” two-sided business models and aspects of hosting/cloud services. Some of these offerings have been around for a long time – bitstream ADSL, unbundled local loop sales and so forth. Others (data MVNOs, wholesale wireless networks) are relatively new. At the same time, operators are cutting new deals with each other for network sharing, backhaul provision, national roaming and so forth. We are splitting the new services out in this category, as a reflection of their impact on the cost side of operators’ business models, and new regulatory regimes (such as open access) that are redefining industry structure in many markets.

4. Embedded communications (previously Distribution Platform) – essentially the delivery to consumers of basic telecom services, primarily voice telephony, SMS and broadband data access, through new routes such as application-embedded functions or devices which “come with data” pre-provisioned.

5. Third-party Enablers (previously B2B VAS Platform) – the provision of extra capabilities derived from the operator’s ’platform’ rather than just network transport. This includes functions such as billing-on-behalf, location, authentication and call-control, provided as basic building blocks to developers and businesses, or abstracted to more complex and full-featured enablers (for example, a location-enabled appointment reminder service). Another class of third-party enablers originates in the huge customer databases that Telcos maintain – in theory, it should be possible to monetise these through advertising or provision of aggregated data to 3rd parties – subject to privacy constraints.

6. Own-brand OTT services. Many operators are starting to exploit the scale of the wider Internet or smartphone universe, by offering content, communications and connectivity services outside the perimeter of their own access subscriber base. With a target market of 1-2bn people, it is (in theory) much easier to lower per-unit production costs for new offerings and gain “viral” adoption. It avoids the politics and bureaucracy of partnerships and industry-wide consortia – and potentially has the ‘pot-of-gold’ of creating huge value from minimal capital investment. On the downside, the execution risks are significant – as is the potential for self-cannibalisation of existing services.

Figure 6 – The Six Opportunity Areas – Strategy, Typical Services and Examples

Telco 2.0 Roadmap Six Opportunities Examples Table

Source: Telco 2.0, The Six Opportunity Types Executive Briefing

To read the report in full, including the following contents…

  • Introduction & Background
  • The Roadmap to New Telco 2.0 Business Models
  • Updating the Telecoms Business Model
  • Executive Summary
  • Introducing the New Telco 2.0 Framework
  • Summary: The Six Telco 2.0 Opportunity Types
  • New Developments and Feedback from Telco 2.0 and New Digital Economics Brainstorms
  • Relative Attractiveness of Opportunity Areas
  • Different Opportunities need Different Business Models
  • The Unwelcome Need to Increase Investment in Innovation
  • New Metrics to Unlock New Investment
  • A Common Theme: Time is Short
  • Next Steps – M-Commerce 2.0: how Personal Data will Revolutionise Customer Engagement
  • The Six Opportunity Types Described
  • Opportunity Type 1: Core services
  • Opportunity Type 2: Vertical industry solutions (SI)
  • Opportunity Type 3: Infrastructure services
  • Opportunity Type 4: Embedded communications
  • Opportunity Type 5: Third-party business enablers
  • Opportunity Type 6: Own-brand “OTT”
  • Index

…with the following figures, charts and tables…

  • Figure 1 – The high-level Telco 2.0 Business Model diagram
  • Figure 2 – Telcos squeezed from all sides
  • Figure 3 – The three opportunity areas in the original Telco 2.0 business model
  • Figure 4 – The New Telco 2.0 Industry Framework
  • Figure 5 – the Six Telco 2.0 Opportunity Types
  • Figure 6 – The Six Opportunity Areas – Strategy, Typical Services and Examples
  • Figure 7 – Americas 2011: What will be the impact of Telco 2.0 Growth Opportunities?
  • Figure 8 – EMEA Nov 2010: B2B Enabling Services and Distribution Platform Need Investment
  • Figure 9 – Each Opportunity Area will have Different Revenue Splits
  • Figure 10 – Operators must invest more in services
  • Figure 11 – Different Business Models Need Different Metrics
  • Figure 12 – Impact of New Business Models on CROIC
  • Figure 13 – Other than “being a pipe”, Telcos have the most time and Opportunity to address Identity & Authentication Control Points
  • Figure 14 – Customer Data and Mobile Money are CSP’s most under exploited Assets?
  • Figure 15 – 100% campaign gain from personalisation
  • Figure 16 – Closed-loop of customer relationships & loyalty
  • Figure 17 – Ericsson’s Mobile Broadband ‘Fuel Gauge’
  • Figure 18 – BT Global Services vertical industry approach
  • Figure 19 – Many regulators see wholesale as key to NGA success
  • Figure 20 – Three Different Types of Embedded Communications
  • Figure 21 – Broadband access market forecast 2005-2015
  • Figure 22 – ‘Comes with Connectivity’
  • Figure 23 – Distribution and Enablers Vs Ontology of Telco wholesale and VAS offerings
  • Figure 24 – What is the best revenue model for Telco API programmes?
  • Figure 25 – Skype is a good fit for many Microsoft products
  • Figure 26 – Telco strategy options for co-opetition with Skype
  • Figure 27 – The Seven ‘VAS Platform’ Applications / 3rd Party Business Enabler Areas
  • Figure 28 – 5 Strategic Options for Developing OTT Services

……Members of the Telco 2.0 Executive Briefing Subscription Service and the Telco 2.0 Transformation Stream can download the full 50 page report in PDF format here. Non-Members, please see here for how to subscribe, here to buy a single user license for £795 (+VAT), or for multi-user licenses and any other enquiries please email contact@telco2.net or call +44 (0) 207 247 5003.

Organisations and products referenced: 3UK, Alcatel-Lucent, Amazon, Amazon Kindle, Android, Apple, AT&T, BlackBerry, BT, BT Global Services, Carphone Warehouse, Cisco, Clearwire, Deutsche Telekom, Equant, Facebook, FCC, Gamesload, Google, Harbinger/SkyTerra network, iPad, iPhone, Jajah, KDDI, LightSquared, LinkedIn, Microsoft, Musicload, O2, Ofcom, Openzone, Optism, Orange, ProgrammableWeb, Qualcomm, Revoo, Scout24 family, Skype, smartphones, SMS, Softwareload, Telefonica, T-Mobile, UQ, Verizon, Videoparty, Vodafone, W3C, Xiam, YouTube.

Technologies and industry terms referenced: 3G, 4G, ADSL, API, appstore, authentication, B2B VAS platform, backhaul, billing-on-behalf, bitstream ADSL, broadband data access, Bulk wholesale, cable, cloud, Comes with data, Core services, CRM, data centres, Embedded Communications, femtocells, fibre, freemium, GSM, healthcare, Identity, Infrastructure services, location, LTE, M2M, managed services, messaging, MiFi, MVNO, MVNOs, Net Neutrality, NGA, NGN, own-brand OTT, Own-brand OTT, pipe, platforms, QoS, R&D, Retail, Sender pays, SIM, slice and dice, smart grids, Third-party business enablers, two-sided, unbundled local loop, Vertical industry solutions, voice telephony, VoIP, wholesale wireless networks, WiFi, WiMAX.