
Q-Beat: Telco quantum deployment tracker
Trends and insights from our database of quantum technology trials and deployments within telcos worldwide

Trends and insights from our database of quantum technology trials and deployments within telcos worldwide

Insights from our Future skills tracker tool show that telcos remain behind technology companies (techcos) in the penetration of the key role types that would enable them to compete and add value like technology companies. The tracker provides direction on where telcos should learn from techcos and build capabilities to increase operational efficiency and enable new revenue streams going forward.

Our telco AI data centre forecast examines the rise of AI factories alongside the evolution of network edge infrastructure, showing how AI-driven demand is accelerating growth in telco compute capacity. How will data sovereignty requirements and new industrial AI applications reshape the telco compute capacity landscape?

Ericsson used its annual analyst event in Boston to outline the steps it is taking to strengthen its enterprise connectivity portfolio, set against the backdrop of a challenging financial period for the company. This report highlights four key themes that emerged from the event.

Telcos leading the development of mobile network APIs must set strategies now to scale the market beyond the first wave of customers and use cases. We explore three potential pathways for growth: courting new customers, creating new capabilities and a combination of both.

As telcos team up to expand into new markets, what are the key lessons from existing joint ventures?

Recently, several telcos made the news with AI factory initiatives. We outline the reasons and the approaches to these investments.

Telcos need new skill sets to enable their organisations to compete and add value like technology companies. Insights from our Future skills tracker tool show that telcos remain behind techcos in the penetration of key role types and provide direction on the expert capabilities required to become more innovative, agile and technology-driven overall.

As AI’s energy consumption rises, so do sustainability concerns. This report explores why this technology is so power-intensive, how to mitigate its impact and whether it can help reduce emissions. It also examines four possible scenarios for future energy consumption – from unchecked growth to greater efficiency – and their sustainability implications.

Our latest iteration of the Network edge data centre forecast shows that deployments are gradually bringing this market to life, despite the first early exits happening in 2024. What impact will 5G SA, data regulation and AI have on development of the network edge landscape?

This report analyses the edge computing strategies of the ‘big three’ cloud providers – Amazon Web Services (AWS), Google Cloud and Microsoft Azure. We assess how successful they have been at developing solutions across the edge continuum, including on-premise, network and regional edge, and determine who leads this nascent market.

We examined 20 organisations that have started to build a subscription marketplace across a wide range of industries. Our analysis identifies the critical success factors telcos need to capture this opportunity.
Telco cloud activity in 2024 is showing signs of growing momentum with 72 deployments in the year to date, in contrast to 90 for the whole of 2023. Even though many of these deployments are announced but yet to complete in 2024, there are improving prospects for vRAN and open RAN, alongside a positive outlook for 5G standalone.
Telcos need new skills to change their organisations to compete like technology companies. Insights from our Future skills tracker tool show that telcos are behind techcos in the penetration of key skillsets and provides direction on the capabilities required to become more innovative, agile and software-driven overall.
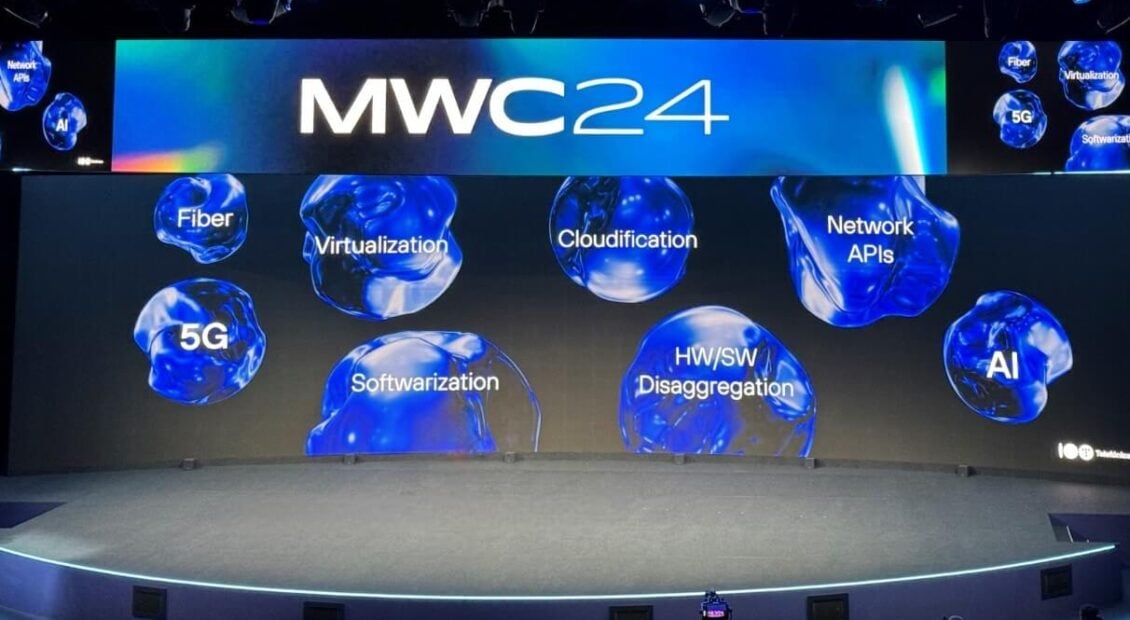
STL Partners’ Research team present their observations from and analysis of the biggest mobile industry event of the year. There was a lot of buzz around AI and API but behind the tech jargon, we saw evidence that our industry continues to morph to become more open and customer-focused.

Drawing from the experience of Lumen, SK Telecom, Telefónica, Verizon and Vodafone, this report identifies the steps, partnerships and expectations of a successful telco edge strategy.

To achieve their net-zero targets, telcos must be proactive in finding mechanisms to embed sustainability in their decision-making. Singtel shows how this can be done through three initiatives focused on scenario planning, carbon accounting and disclosures.