Winning Strategies: Differentiated Mobile Data Services

Introduction

Verizon’s performance in the US

Our work on the US cellular market – for example, in the Disruptive Strategy: “Uncarrier” T-Mobile vs VZW, AT&T, and Free.fr  and Free-T-Mobile: Disruptive Revolution or a Bridge Too Far?  Executive Briefings – has identified that US carrier strategies are diverging. The signature of a price-disruption event we identified with regard to France was that industry-wide ARPU was falling, subscriber growth was unexpectedly strong (amounting to a substantial increase in penetration), and there was a shakeout of minor operators and MVNOs.

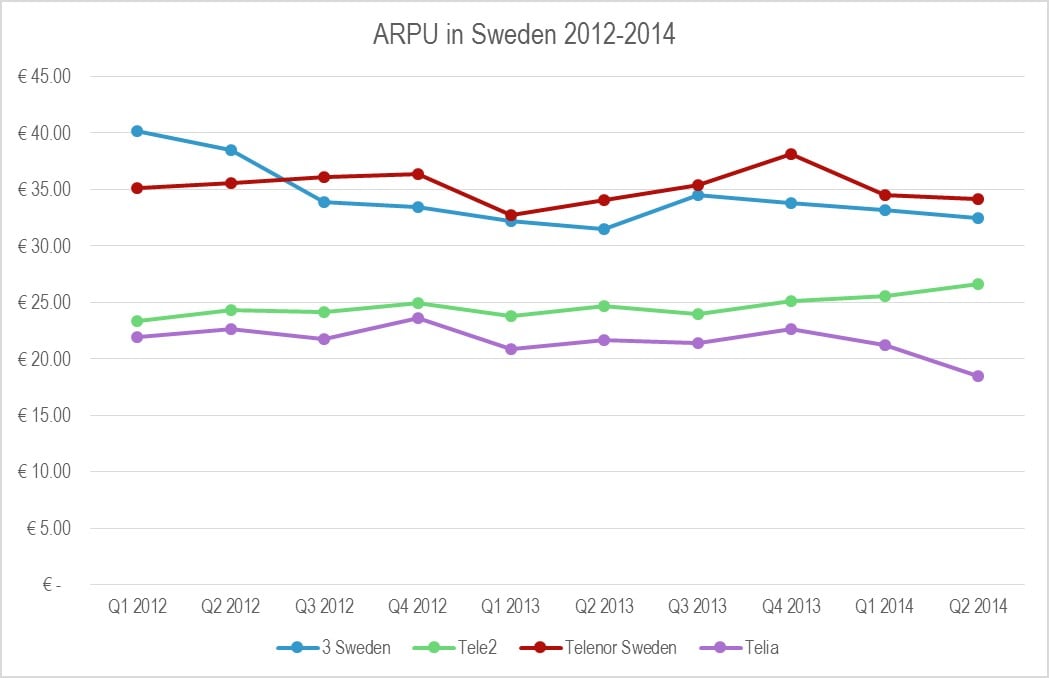
Although there are strong signs of a price war – for example, falling ARPU industry-wide, resumed subscriber growth, minor operators exiting, and subscriber-acquisition initiatives such as those at T-Mobile USA, worth as much as $400-600 in handset subsidy and service credit – it seems that Verizon Wireless is succeeding while staying out of the mire, while T-Mobile, Sprint, and minor operators are plunged into it, and AT&T may be going that way too. Figure 1 shows monthly ARPU, converted to Euros for comparison purposes.

Figure 1: Strategic divergence in the US

Figure 1 Strategic Divergence in the US
Source: STL Partners, themobileworld.com

We can also look at this in terms of subscribers and in terms of profitability, bringing in the cost side. The following chart, Figure 2, plots margins against subscriber growth, with the bubbles set proportional to ARPU. The base year 2011 is set to 100 and the axes are set to the average values. We’ve named the four quadrants that result appropriately.

Figure 2: Four carriers, four fates

Figure 2 Four carriers four fate
Source: STL Partners

Clearly, you’d want to be in the top-right, top-performer quadrant, showing subscriber growth and growing profitability. Ideally, you’d also want to be growing ARPU. Verizon Wireless is achieving all three, moving steadily north-west and climbing the ARPU curve.

At the same time, AT&T is gradually being drawn into the price war, getting closer to the lower-right “volume first” quadrant. Deep within that one, we find T-Mobile, which slid from a defensive crouch in the upper-left into the hopeless lower-left zone and then escaped via its price-slashing strategy. (Note that the last lot of T-Mobile USA results were artificially improved by a one-off spectrum swap.) And Sprint is thrashing around, losing profitability and going nowhere fast.

The usual description for VZW’s success is “network differentiation”. They’re just better than the rest, and as a result they’re reaping the benefits. (ABI, for example, reckons that they’re the world’s second most profitable operator on a per-subscriber basis  and the world’s most profitable in absolute terms.) We can restate this in economic terms, saying that they are the most efficient producer of mobile service capacity. This productive capacity can be used either to cut prices and gain share, or to increase quality (for example, data rates, geographic coverage, and voice mean-opinion score) at higher prices. This leads us to an important conclusion: network differentiation is primarily a cost concept, not a price concept.

If there are technical or operational choices that make network differentiation possible, they can be deployed anywhere. It’s also possible, though, that VZW is benefiting from structural factors, perhaps its ex-incumbent status, or its strong position in the market for backbone and backhaul fibre, or perhaps just its scale (although in that case, why is AT&T doing so much worse?). And another possibility often mooted is that the US is somehow a better kind of mobile market. Less competitive (although this doesn’t necessarily show up in metrics like the Herfindahl index of concentration), supposedly less regulated, and undoubtedly more profitable, it’s often held up by European operators as an example. Give us the terms, they argue, and we will catch up to the US in LTE deployment.

As a result, it is often argued in lobbying circles that European markets are “too competitive” or in need of “market repair”, and therefore, the argument runs, the regulator ought to turn a blind eye to more consolidation or at least accept a hollowing out of national operating companies. More formally, the prices (i.e. ARPUs) prevailing do not provide a sufficient margin over operators’ fixed costs to fund discretionary investment. If this was true, we would expect to find little scope for successful differentiation in Europe.

Further, if the “incumbent advantage” story was true of VZW over and above the strategic moves that it has made, we might expect to find that ex-incumbent, converged operators were pulling into the lead across Europe, benefiting from their wealth of access and backhaul assets. In this note, we will try to test these statements, and then assess what the answer might be.

How do European Operators compare?

We selected a clutch of European mobile operators and applied the same screen to identify what might be happening. In doing so we chose to review the UK, German, French, Swedish, and Italian markets jointly with the US, in an effort to avoid a purely European crisis-driven comparison.

Figure 3: Applying the screen to European carriers

Figure 3 Applying the screen to European carriers

Source: STL Partners

Our first observation is that the difference between European and American carriers has been more about subscriber growth than about profitability. The axes are set to the same values as in Figure 2, and the data points are concentrated to their left (showing less subscriber growth in Europe) not below them (less profitability growth).

Our second observation is that yes, there certainly are operators who are delivering differentiated performance in the EU. But they’re not the ones you might expect. Although the big converged incumbents, like T-Mobile Germany, have strong margins, they’re not increasing them and on the whole their performance is average only. Nor is scale a panacea, which brings us to our next observation.

Our third observation is that something is visible at this level that isn’t in the US: major opcos that are shrinking. Vodafone, not a company that is short of scale, gets no fewer than three of its OpCos into the lower-left quadrant. We might say that Vodafone Italy was bound to suffer in the context of the Italian macro-economy, as was TIM, but Vodafone UK is in there, and Vodafone Germany is moving steadily further left and down.

And our fourth observation is the opposite, significant growth. Hutchison OpCo 3UK shows strong performance growth, despite being a fourth operator with no fixed assets and starting with LTE after first-mover EE. Their sibling 3 Sweden is also doing well, while even 3 Italy was climbing up until the last quarter and it remains a valid price warrior. They are joined in the power quadrant with VZW by Telenor’s Swedish OpCo, Telia Mobile, and O2 UK (in the last two cases, only marginally). EE, for its part, has only marginally gained subscribers, but it has strongly increased its margins, and it may yet make it.

But if you want really dramatic success, or if you doubt that Hutchison could do it, what about Free? The answer is that they’re literally off the chart. In Figure 4, we add Free Mobile, but we can only plot the first few quarters. (Interestingly, since then, Free seems to be targeting a mobile EBITDA margin of exactly 9%.)

The distinction here is between the pure-play, T-Mobile-like price warriors in the lower right quadrant, who are sacrificing profitability for growth, and the group we’ve identified, who are improving their margins even as they gain subscribers. This is the signature of significant operational improvement, an operator that can move traffic more efficiently than its competitors. Because the data traffic keeps coming, ever growing at the typical 40% annual clip, it is necessary for any operator to keep improving in order to survive. Therefore, the pace of improvement marks operational excellence, not just improvement.

Figure 4: Free Mobile, a disruptive force that’s literally off the charts

Figure 4 Free Mobile a disruptive force thats literally off the charts

Source: STL Partners

We can also look at this at the level of the major multinational groups. Again, Free’s very success presents a problem to clarity in this analysis – even as part of a virtual group of independents, the ‘Indies’ in Figure 5, it’s difficult to visualise. T-Mobile USA’s savage price cutting, though, gets averaged out and the inclusion of EE boosts the result for Orange and DTAG. It also becomes apparent that the “market repair” story has a problem in that there isn’t a major group committed to hard discounting. But Hutchison, Telenor, and Free’s excellence, and Vodafone’s pain, stand out.

Figure 5: The differences are if anything more pronounced within Europe at the level of the major multinationals

Figure 5 The differences are if anything more pronounced within Europe at the level of the major multinationals

Source: STL Partners

In the rest of this report we analyse why and how these operators (3UK, Telenor Sweden and Free Mobile) are managing to achieve such differentiated performance, identify the common themes in their strategic approaches and the lessons from comparison to their peers, and the important wider consequences for the market.


  • Executive Summary
  • Introduction
  • Applying the Screen to European Mobile
  • Case study 1: Vodafone vs. 3UK
  • 3UK has substantially more spectrum per subscriber than Vodafone
  • 3UK has much more fibre-optic backhaul than Vodafone
  • How 3UK prices its service
  • Case study 2: Sweden – Telenor and its competitors
  • The network sharing issue
  • Telenor Sweden: heavy on the 1800MHz
  • Telenor Sweden was an early adopter of Gigabit Ethernet backhaul
  • How Telenor prices its service
  • Case study 3: Free Mobile
  • Free: a narrow sliver of spectrum, or is it?
  • Free Mobile: backhaul excellence through extreme fixed-mobile integration
  • Free: the ultimate in simple pricing
  • Discussion
  • IP networking metrics: not yet predictive of operator performance
  • Network sharing does not obviate differentiation
  • What is Vodafone’s strategy for fibre in the backhaul?
  • Conclusions


  • Figure 1: Strategic divergence in the US
  • Figure 2: Four carriers, four fates
  • Figure 3: Applying the screen to European carriers
  • Figure 4: Free Mobile, a disruptive force that’s literally off the charts
  • Figure 5: The differences are if anything more pronounced within Europe at the level of the major multinationals
  • Figure 6: Although Vodafone UK and O2 UK share a physical network, O2 is heading for VZW-like territory while VF UK is going nowhere fast
  • Figure 7: Strategic divergence in the UK
  • Figure 8: 3UK, also something of an ARPU star
  • Figure 9: 3UK is very different from Hutchison in Italy or even Sweden
  • Figure 10: 3UK has more spectrum on a per-subscriber basis than Vodafone
  • Figure 11: Vodafone’s backhaul upgrades are essentially microwave; 3UK’s are fibre
  • Figure 12: 3 Europe is more than coping with surging data traffic
  • Figure 13: 3UK service pricing
  • Figure 14: The Swedish market shows a clear winner…
  • Figure 15: Telenor.se is leading on all measures
  • Figure 16: How Swedish network sharing works
  • Figure 17: Network sharing does not equal identical performance in the UK
  • Figure 18: Although extensive network sharing complicates the picture, Telenor Sweden has a strong position, especially in the key 1800MHz band
  • Figure 19: If the customers want more data, why not sell them more data?
  • Figure 20: Free Mobile, network differentiator?
  • Figure 21: Free Mobile, the price leader as always
  • Figure 22: Free Mobile succeeds with remarkably little spectrum, until you look at the allocations that are actually relevant to its network
  • Figure 23: Free’s fixed-line network plans
  • Figure 24: Free leverages its FTTH for outstanding backhaul density
  • Figure 25: Free: value on 3G, bumper bundler on 4G
  • Figure 26: The carrier with the most IPv4 addresses per subscriber is…
  • Figure 27: AS_PATH length – not particularly predictive either
  • Figure 28: The buzzword count. “Fibre” beats “backhaul” as a concern
  • Figure 29: Are Project Spring’s targets slipping?


Free-T-Mobile: Disruptive Revolution or a Bridge Too Far?

Free’s Bid for T-Mobile USA 

The future of the US market and its 3rd and 4th operators has been a long-running saga. The market, the world’s richest, remains dominated by the duopoly of AT&T and Verizon Wireless. It was long expected that Softbank’s acquisition of Sprint heralded disruption, but in the event, T-Mobile was simply quicker to the punch.

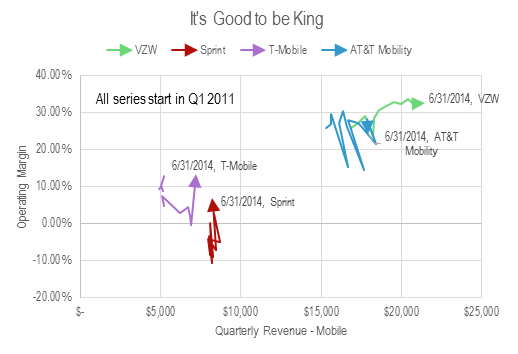
Since the launch of T-Mobile’s “uncarrier” price-war strategy, we have identified signs of a “Free Mobile-like” disruption event, for example, substantial net-adds for the disruptor, falling ARPUs, a shakeout of MVNOs and minor operators, and increased industry-wide subscriber growth. However, other key indicators like a rapid move towards profitability by the disruptor are not yet in evidence, and rather than industry-wide deflation, we observe divergence, with Verizon Wireless increasing its ARPU, revenues, and margins, while AT&T’s are flat, Sprint’s flat to falling, and T-Mobile’s plunging.

This data is summarised in Figure 1.

Figure 1: Revenue and margins in the US. The duopoly is still very much with us


Source: STL Partners, company filings

Compare and contrast Figure 2, which shows the fully developed disruption in France. 


Figure 2: Fully-developed disruption. Revenue and margins in France


Source: STL Partners, company filings

T-Mobile: the state of play in Q2 2014

When reading Figure 1, you should note that T-Mobile’s Q2 2014 accounts contain a negative expense item of $747m, reflecting a spectrum swap with Verizon Wireless, which flatters their margin. Without it, the operating margin would be 2.99%, about a third of Sprint’s. Poor as this is, it is at least positive territory, after a Q1 in which T-Mobile lost money. It is not quite true to say that T-Mobile only made it to profitability thanks to the one-off spectrum deal; excluding it, the carrier would have made $215m in operating income in Q2, a $243m swing from the $28m net loss in Q1. This is explained by a $223m narrowing of T-Mobile’s losses on device sales, as shown in Figure 2, and may explain why the earnings release makes no mention of profits instead of adjusted EBITDA despite it being a positive quarter.

Figure 3: T-Mobile’s return to underlying profitability – caused by moderating its smartphone bonanza somewhat

Source: STL Partners, company filings

T-Mobile management likes to cite its ABPU (Average Billings per User) metric in preference to ARPU, which includes the hire-purchase charges on device sales under its quick-upgrade plans. However, as Figure 3 shows, this is less exciting than it sounds. The T-Mobile management story is that as service prices, and hence ARPU, fall in order to bring in net-adds, payments for device sales “decoupled” from service plans will rise and take up the slack. They are, so far, only just doing so. Given that T-Mobile is losing money on device pricing, this is no surprise.


  • Executive Summary
  • Free’s Bid for T-Mobile USA
  • T-Mobile: the state of play in Q2 2014
  • Free-Mobile: the financials
  • Indicators of a successful LBO
  • Free.fr: a modus operandi for disruption
  • Surprise and audacity
  • Simple products
  • The technical edge
  • Obstacles to the Free modus operandi
  • Spectrum
  • Fixed-mobile synergy
  • Regulation
  • Summary
  • Two strategic options
  • Hypothesis one: change the circumstances via a strategic deal with the cablecos
  • Hypothesis two: 80s retro LBO
  • Problems that bite whichever option is taken
  • The other shareholders
  • Free’s management capacity and experience
  • Conclusion


  • Figure 1: Revenue and margins in the US. The duopoly is still very much with us
  • Figure 2: Fully-developed disruption. Revenue and margins in France
  • Figure 3: T-Mobile’s return to underlying profitability – caused by moderating its smartphone bonanza somewhat
  • Figure 4: Postpaid ARPU falling steadily, while ABPU just about keeps up
  • Figure 5: T-Mobile’s supposed “decoupling” of devices from service has extended $3.5bn of credit to its customers, rising at $1bn/quarter
  • Figure 6: Free’s valuation of T-Mobile is at the top end of a rising trend
  • Figure 7: Example LBO
  • Figure 8: Free-T-Mobile in the context of notable leveraged buyouts
  • Figure 9: Free Mobile’s progress towards profitability has been even more impressive than its subscriber growth


Triple-Play in the USA: Infrastructure Pays Off

Introduction

In this note, we compare the recent performance of three US fixed operators who have adopted contrasting strategies and technology choices, AT&T, Verizon, and Comcast. We specifically focus on their NGA (Next-Generation Access) triple-play products, for the excellent reason that they themselves focus on these to the extent of increasingly abandoning the subscriber base outside their footprints. We characterise these strategies, attempt to estimate typical subscriber bundles, discuss their future options, and review the situation in the light of a “Deep Value” framework.

A Case Study in Deep Value: The Lessons from Apple and Samsung

Deep value strategies concentrate on developing assets that will be difficult for any plausible competitor to replicate, in as many layers of the value chain as possible. A current example is the way Apple and Samsung – rather than Nokia, HTC, or even Google – came to dominate the smartphone market.

It is now well known that Apple, despite its image as a design-focused company whose products are put together by outsourcers, has invested heavily in manufacturing throughout the iOS era. Although the first generation iPhone was largely assembled from proprietary parts, in many ways it should be considered as a large-scale pilot project. Starting with the iPhone 3GS, the proportion of Apple’s own content in the devices rose sharply, thanks to the acquisition of PA Semiconductor, but also to heavy investment in the supply chain.

Not only did Apple design and pilot-produce many of the components it wanted, it bought them from suppliers in advance to lock up the supply. It also bought machine tools the suppliers would need, often long in advance to lock up the supply. But this wasn’t just about a tactical effort to deny componentry to its competitors. It was also a strategic effort to create manufacturing capacity.

In pre-paying for large quantities of components, Apple provides its suppliers with the capital they need to build new facilities. In pre-paying for the machine tools that will go in them, they finance the machine tool manufacturers and enjoy a say in their development plans, thus ensuring the availability of the right machinery. They even invent tools themselves and then get them manufactured for the future use of their suppliers.

Samsung is of course both Apple’s biggest competitor and its biggest supplier. It combines these roles precisely because it is a huge manufacturer of electronic components. Concentrating on its manufacturing supply chain both enables it to produce excellent hardware, and also to hedge the success or failure of the devices by selling componentry to the competition. As with Apple, doing this is very expensive and demands skills that are both in short supply, and sometimes also hard to define. Much of the deep value embedded in Apple and Samsung’s supply chains will be the tacit knowledge gained from learning by doing that is now concentrated in their people.

The key insight for both companies is that industrial and user-experience design is highly replicable, and patent protection is relatively weak. The same is true of software. Apple had a deeply traumatic experience with the famous Look and Feel lawsuit against Microsoft, and some people have suggested that the supply-chain strategy was deliberately intended to prevent something similar happening again.

Certainly, the shift to this strategy coincides with the launch of Android, which Steve Jobs at least perceived as a “stolen product”. Arguably, Jobs repeated Apple’s response to Microsoft Windows, suing everyone in sight, with about as much success, whereas Tim Cook in his role as the hardware engineering and then supply-chain chief adopted a new strategy, developing an industrial capability that would be very hard to replicate, by design.

Three Operators, Three Strategies

AT&T

The biggest issue any fixed operator has faced since the great challenges of privatisation, divestment, and deregulation in the 1980s is that of managing the transition from a business that basically provides voice on a copper access network to one that basically provides Internet service on a co-ax, fibre, or possibly wireless access network. This, at least, has been clear for many years.

AT&T is the original telco – at least, AT&T likes to be seen that way, as shown by their decision to reclaim the iconic NYSE ticker symbol “T”. That obscures, however, how much has changed since the divestment and the extremely expensive process of mergers and acquisitions that patched the current version of the company together. The bit examined here is the AT&T Home Solutions division, which owns the fixed-line ex-incumbent business, also known as the merged BellSouth and SBC businesses.

AT&T, like all the world’s incumbents, deployed ADSL at the turn of the 2000s, thus getting into the ISP business. Unlike most world incumbents, in 2005 it got a huge regulatory boost in the form of the Martin FCC’s Comcast decision, which declared that broadband Internet service was not a telecommunications service for regulatory purposes. This permitted US fixed operators to take back the Internet business they had been losing to independent ISPs. As such, they were able to cope with the transition while concentrating on the big-glamour areas of M&A and wireless.

As the 2000s advanced, it became obvious that AT&T needed to look at the next move beyond DSL service. The option taken was what became U-Verse, a triple-play product which consists of:

  • Either ADSL, ADSL2+, or VDSL, depending on copper run length and line quality
  • Plus IPTV
  • And traditional telephony carried over IP.

This represents a minimal approach to the transition – the network upgrade requires new equipment in the local exchanges, or Central Offices in US terms, and in street cabinets, but it does not require the replacement of the access link, nor any trenching.

This minimisation of capital investment is especially important, as it was also decided that U-Verse would not deploy into areas where the copper might need investment to carry it. These networks would eventually, it was hoped, be either sold or closed and replaced by wireless service. U-Verse was therefore, for AT&T, in part a means of disposing of regulatory requirements.

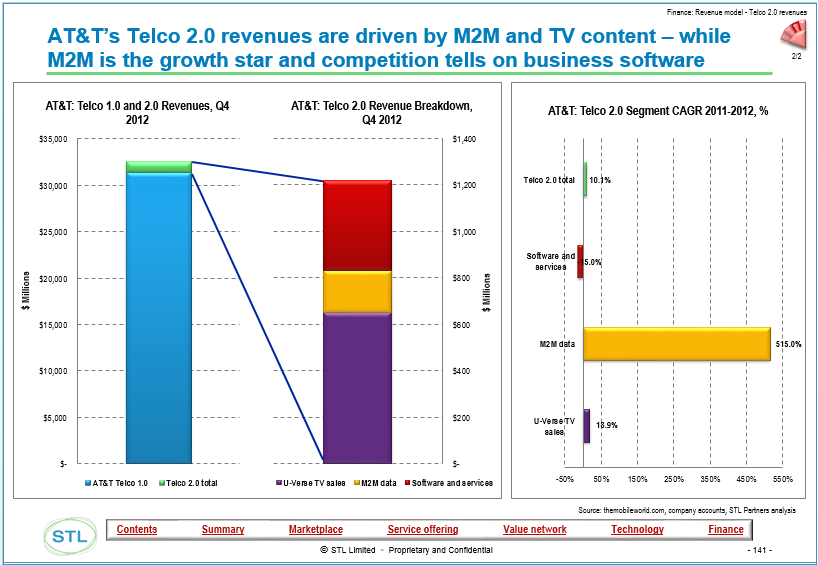
It was also important that the system closely coupled the regulated domain of voice with the unregulated, or at least only potentially regulated, domain of Internet service and the either unregulated or differently regulated domain of content. In many ways, U-Verse can be seen as a content first strategy. It’s TV that is expected to be the primary replacement for the dwindling fixed voice revenues. Figure 1 shows the importance of content to AT&T vividly.

Figure 1: U-Verse TV sales account for the largest chunk of Telco 2.0 revenue at AT&T, although M2M is growing fast

Telco 2 UVerse TV sales account for the largest chunk of Telco 2 revenue at ATandT although M2M is growing fast.png

Source: Telco 2.0 Transformation Index

This sounds like one of the telecoms-as-media strategies of the late 1990s. However, it should be clearly distinguished from, say, BT’s drive to acquire exclusive sports content and to build up a brand identity as a “channel”. U-Verse does not market itself as a “TV channel” and does not buy exclusive content – rather, it is a channel in the literal sense, a distributor through which TV is sold. We will see why in the next section.

The US TV Market

It is well worth remembering that TV is a deeply national industry. Steve Jobs famously described it as “balkanised” and as a result didn’t want to take part. Most metrics vary dramatically across national borders, as do qualitative observations of structure. (Some countries have a big public sector broadcaster, like the BBC or indeed Al-Jazeera, to give a basic example.) Countries with low pay-TV penetration can be seen as ones that offer greater opportunities, it being usually easier to expand the customer base than to win share from the competition (a “blue ocean” versus a “red sea” strategy).

However, it is also true that pay-TV in general is an easier sell in a market where most TV viewers already pay for TV. It is very hard to convince people to pay for a product they can obtain free.

In the US, there is a long-standing culture of pay-TV, originally with cable operators and more recently with satellite (DISH and DirecTV), IPTV or telco-delivered TV (AT&T U-Verse and Verizon FiOS), and subscription OTT (Netflix and Hulu). It is also a market characterised by heavy TV usage (an average household has 2.8 TVs). Out of the 114.2 million homes (96.7% of all homes) receiving TV, according to Nielsen, there are some 97 million receiving pay-TV via cable, satellite, or IPTV, a penetration rate of 85%. This is the largest and richest pay-TV market in the world.

In this sense, it ought to be a good prospect for TV in general, with the caveat that a “Sky Sports” or “BT Sport” strategy based on content exclusive to a distributor is unlikely to work. This is because typically, US TV content is sold relatively openly in the wholesale market, and in many cases, there are regulatory requirements that it must be provided to any distributor (TV affiliate, cable operator, or telco) that asks for it, and even that distributors must carry certain channels.

Rightsholders have backed a strategy based on distribution over one based on exclusivity, on the principle that the customer should be given as many opportunities as possible to buy the content. This also serves the interests of advertisers, who by definition want access to as many consumers as possible. Hollywood has always aimed to open new releases on as many cinema screens as possible, and it is the movie industry’s skills, traditions, and prejudices that shaped this market.

As a result, it is relatively easy for distributors to acquire content, but difficult for them to generate differentiation by monopolising exclusive content. In this model, differentiation tends to accrue to rightsholders, not distributors. For example, although HBO maintains the status of being a premium provider of content, consumers can buy it from any of AT&T, Verizon, Comcast, any other cable operator, satellite, or direct from HBO via an OTT option.

However, pay-TV penetration is high enough that any new entrant (such as the two telcos) is committed to winning share from other providers, the hard way. It is worth pointing out that the US satellite operators DISH and DirecTV concentrated on rural customers who aren’t served by the cable MSOs. At the time, their TV needs weren’t served by the telcos either. As such, they were essentially greenfield deployments, the first pay-TV propositions in their markets.

The biggest change in US TV in recent times has been the emergence of major new distributors, the two RBOCs and a range of Web-based over-the-top independents. Figure 2 summarises the situation going into 2013.

Figure 2: OTT video providers beat telcos, cablecos, and satellite for subscriber growth, at scale

OTT video providers beat telcos cablecos and satellite for subscriber growth at scale

Source: Telco 2.0 Transformation Index

The two biggest classes of distributors saw either a marginal loss of subscribers (the cablecos) or a marginal gain (satellite). The two groups of (relatively) new entrants, as you’d expect, saw much more growth. However, the OTT players are both bigger and much faster growing than the two telco players. It is worth pointing out that this mostly represents additional TV consumption, typically, people who already buy pay-TV adding a Netflix subscription. “Cord cutting” – replacing a primary TV subscription entirely – remains rare. In some ways, U-Verse can be seen as an effort to do something similar, upselling content to existing subscribers.

Competing for the Whole Bundle – Comcast and the Cable Industry

So how is this option doing? The following chart, Figure 3, shows that in terms of overall service ARPU, AT&T’s fixed strategy is delivering inferior results than its main competitors.

Figure 3: Cable operators lead the way on ARPU. Verizon, with FiOS, is keeping up

Cable operators lead the way on ARPU. Verizon, with FiOS, is keeping up

Source: Telco 2.0 Transformation Index

The interesting point here is that Time Warner Cable is doing less well than some of its cable industry peers. Comcast, the biggest, claims a $159 monthly ARPU for triple-play customers, and it probably has a higher density of triple-players than the telcos. More representatively, they also quote a figure of $134 monthly average revenue per customer relationship, including single- and double-play customers. We have used this figure throughout this note. TWC, in general, is more content-focused and less broadband-focused than Comcast, having taken much longer to roll out DOCSIS 3.0. But is that important? After all, aren’t cable operators all about TV? Figure 4 shows clearly that broadband and voice are now just as important to cable operators as they are to telcos. The distinction is increasingly just a historical quirk.

Figure 4: Non-video revenues – i.e. Internet service and voice – are the driver of growth for US cable operators

Non video revenues ie Internet service and voice are the driver of growth for US cable operatorsSource: NCTA data, STL Partners

As we have seen, TV in the USA is not a differentiator because everyone’s got it. Further, it’s a product that doesn’t bring differentiation but does bring costs, as the rightsholders exact their share of the selling price. Broadband and voice are different – they are, in a sense, products the operator makes in-house. Most have to buy the tools (except Free.fr which has developed its own), but in any case the operator has to do that to carry the TV.

The differential growth rates in Figure 4 represent a substantial change in the ISP industry. Traditionally, the Internet engineering community tended to look down on cable operators as glorified TV distribution systems. This is no longer the case.

In the late 2000s, cable operators concentrated on improving their speeds and increasing their capacity. They also pressed their vendors and standardisation forums to practice continuous improvement, creating a regular upgrade cycle for DOCSIS firmware and silicon that lets them stay one (or more) jumps ahead of the DSL industry. Some of them also invested in their core IP networking and in providing a deeper and richer variety of connectivity products for SMB, enterprise, and wholesale customers.

Comcast is the classic example of this. It is a major supplier of mobile backhaul, high-speed Internet service (and also VoIP) for small businesses, and a major actor in the Internet peering ecosystem. An important metric of this change is that since 2009, it has transitioned from being a downlink-heavy eyeball network to being a balanced peer that serves about as much traffic outbound as it receives inbound.

The key insight here is that, especially in an environment like the US where xDSL unbundling isn’t available, if you win a customer for broadband, you generally also get the whole bundle. TV is a valuable bonus, but it’s not differentiating enough to win the whole of the subscriber’s fixed telecoms spend – or to retain it, in the presence of competitors with their own infrastructure. It’s also of relatively little interest to business customers, who tend to be high-value customers.


  • Executive Summary
  • Introduction
  • A Case Study in Deep Value: The Lessons from Apple and Samsung
  • Three Operators, Three Strategies
  • AT&T
  • The US TV Market
  • Competing for the Whole Bundle – Comcast and the Cable Industry
  • Competing for the Whole Bundle II: Verizon
  • Scoring the three strategies – who’s winning the whole bundles?
  • SMBs and the role of voice
  • Looking ahead
  • Planning for a Future: What’s Up Cable’s Sleeve?
  • Conclusions


  • Figure 1: U-Verse TV sales account for the largest chunk of Telco 2.0 revenue at AT&T, although M2M is growing fast
  • Figure 2: OTT video providers beat telcos, cablecos, and satellite for subscriber growth, at scale
  • Figure 3: Cable operators lead the way on ARPU. Verizon, with FiOS, is keeping up
  • Figure 4: Non-video revenues – i.e. Internet service and voice – are the driver of growth for US cable operators
  • Figure 5: Comcast has the best pricing per megabit at typical service levels
  • Figure 6: Verizon is ahead, but only marginally, on uplink pricing per megabit
  • Figure 7: FCC data shows that it’s the cablecos, and FiOS, who under-promise and over-deliver when it comes to broadband
  • Figure 7: Speed sells at Verizon
  • Figure 8: Comcast and Verizon at parity on price per megabit
  • Figure 9: Typical bundles for three operators. Verizon FiOS leads the way
  • Figure 12: The impact of learning by doing on FTTH deployment costs during the peak roll-out phase

Mobile Broadband 2.0: The Top Disruptive Innovations

Summary: Key trends, tactics, and technologies for mobile broadband networks and services that will influence mid-term revenue opportunities, cost structures and competitive threats. Includes consideration of LTE, network sharing, WiFi, next-gen IP (EPC), small cells, CDNs, policy control, business model enablers and more.(March 2012, Executive Briefing Service, Future of the Networks Stream).

Trends in European data usage

  Read in Full (Members only)  Buy a single user license online  To Subscribe click here

Below is an extract from this 44 page Telco 2.0 Report that can be downloaded in full in PDF format by members of the Telco 2.0 Executive Briefing service and Future Networks Stream here. Non-members can subscribe here, buy a Single User license for this report online here for £795 (+VAT for UK buyers), or for multi-user licenses or other enquiries, please email contact@telco2.net / call +44 (0) 207 247 5003. We’ll also be discussing our findings and more on Facebook at the Silicon Valley (27-28 March) and London (12-13 June) New Digital Economics Brainstorms.

To share this article easily, please click:


Introduction

Telco 2.0 has previously published a wide variety of documents and blog posts on mobile broadband topics – content delivery networks (CDNs), mobile CDNs, WiFi offloading, Public WiFi, network outsourcing (“‘Under-The-Floor’ (UTF) Players: threat or opportunity? ”) and so forth. Our conferences have featured speakers and panellists discussing operator data-plan pricing strategies, tablets, network policy and numerous other angles. We’ve also featured guest material such as Arete Research’s report LTE: Late, Tempting, and Elusive.

In our recent ‘Under the Floor (UTF) Players‘ Briefing we looked at strategies to deal with some of of the challenges facing operators’ resulting from market structure and outsourcing

Under The Floor (UTF) Players Telco 2.0

This Executive Briefing is intended to complement and extend those efforts, looking specifically at those technical and business trends which are truly “disruptive”, either immediately or in the medium-term future. In essence, the document can be thought of as a checklist for strategists – pointing out key technologies or trends around mobile broadband networks and services that will influence mid-term revenue opportunities and threats. Some of those checklist items are relatively well-known, others more obscure but nonetheless important. What this document doesn’t cover is more straightforward concepts around pricing, customer service, segmentation and so forth – all important to get right, but rarely disruptive in nature.

During 2012, Telco 2.0 will be rolling out a new MBB workshop concept, which will audit operators’ existing technology strategy and planning around mobile data services and infrastructure. This briefing document is a roundup of some of the critical issues we will be advising on, as well as our top-level thinking on the importance of each trend.

It starts by discussing some of the issues which determine the extent of any disruption:

  • Growth in mobile data usage – and whether the much-vaunted “tsunami” of traffic may be slowing down
  • The role of standardisation , and whether it is a facilitator or inhibitor of disruption
  • Whether the most important MBB disruptions are likely to be telco-driven, or will stem from other actors such as device suppliers, IT companies or Internet firms.

The report then drills into a few particular domains where technology is evolving, looking at some of the most interesting and far-reaching trends and innovations. These are split broadly between:

  • Network infrastructure evolution (radio and core)
  • Control and policy functions, and business-model enablers

It is not feasible for us to cover all these areas in huge depth in a briefing paper such as this. Some areas such as CDNs and LTE have already been subject to other Telco 2.0 analysis, and this will be linked to where appropriate. Instead, we have drilled down into certain aspects we feel are especially interesting, particularly where these are outside the mainstream of industry awareness and thinking – and tried to map technical evolution paths onto potential business model opportunities and threats.

This report cannot be truly exhaustive – it doesn’t look at the nitty-gritty of silicon components, or antenna design, for example. It also treads a fine line between technological accuracy and ease-of-understanding for the knowledgeable but business-focused reader. For more detail or clarification on any area, please get in touch with us – email mailto:contact@stlpartners.com or call +44 (0) 207 247 5003.

Telco-driven disruption vs. external trends

There are various potential sources of disruption for the mobile broadband marketplace:

  • New technologies and business models implemented by telcos, which increase revenues, decrease costs, improve performance or alter the competitive dynamics between service providers.
  • 3rd party developments that can either bolster or undermine the operators’ broadband strategies. This includes both direct MBB innovations (new uses of WiFi, for example), or bleed-over from adjacent related marketplaces such as device creation or content/application provision.
  • External, non-technology effects such as changing regulation, economic backdrop or consumer behaviour.

The majority of this report covers “official” telco-centric innovations – LTE networks, new forms of policy control and so on,

External disruptions to monitor

But the most dangerous form of innovation is that from third parties, which can undermine assumptions about the ways mobile broadband can be used, introducing new mechanisms for arbitrage, or somehow subvert operators’ pricing plans or network controls. 

In the voice communications world, there are often regulations in place to protect service providers – such as banning the use of “SIM boxes” to terminate calls and reduce interconnection payments. But in the data environment, it is far less obvious that many work-arounds can either be seen as illegal, or even outside the scope of fair-usage conditions. That said, we have already seen some attempts by telcos to manage these effects – such as charging extra for “tethering” on smartphones.

It is not really possible to predict all possible disruptions of this type – such is the nature of innovation. But by describing a few examples, market participants can gauge their level of awareness, as well as gain motivation for ongoing “scanning” of new developments.

Some of the areas being followed by Telco 2.0 include:

  • Connection-sharing. This is where users might link devices together locally, perhaps through WiFi or Bluetooth, and share multiple cellular data connections. This is essentially “multi-tethering” – for example, 3 smartphones discovering each other nearby, perhaps each with a different 3G/4G provider, and pooling their connections together for shared use. From the user’s point of view it could improve effective coverage and maximum/average throughput speed. But from the operators’ view it would break the link between user identity and subscription, and essentially offload traffic from poor-quality networks on to better ones.
  • SoftSIM or SIM-free wireless. Over the last five years, various attempts have been made to decouple mobile data connections from SIM-based authentication. In some ways this is not new – WiFi doesn’t need a SIM, while it’s optional for WiMAX, and CDMA devices have typically been “hard-coded” to just register on a specific operator network. But the GSM/UMTS/LTE world has always relied on subscriber identification through a physical card. At one level, it s very good – SIMs are distributed easily and have enabled a successful prepay ecosystem to evolve. They provide operator control points and the ability to host secure applications on the card itself. However, the need to obtain a physical card restricts business models, especially for transient/temporary use such as a “one day pass”. But the most dangerous potential change is a move to a “soft” SIM, embedded in the device software stack. Companies such as Apple have long dreamed of acting as a virtual network provider, brokering between user and multiple networks. There is even a patent for encouraging bidding per-call (or perhaps per data-connection) with telcos competing head to head on price/quality grounds. Telco 2.0 views this type of least-cost routing as a major potential risk for operators, especially for mobile data – although it also possible enables some new business models that have been difficult to achieve in the past.
  • Encryption. Various of the new business models and technology deployment intentions of operators, vendors and standards bodies are predicated on analysing data flows. Deep packet inspection (DPI) is expected to be used to identify applications or traffic types, enabling differential treatment in the network, or different charging models to be employed. Yet this is rendered largely useless (or at least severely limited) when various types of encryption are used. Various content and application types already secure data in this way – content DRM, BlackBerry traffic, corporate VPN connections and so on. But increasingly, we will see major Internet companies such as Apple, Google, Facebook and Microsoft using such techniques both for their own users’ security, but also because it hides precise indicators of usage from the network operators. If a future Android phone sends all its mobile data back via a VPN tunnel and breaks it out in Mountain View, California, operators will be unable to discern YouTube video from search of VoIP traffic. This is one of the reasons why application-based charging models – one- or two-sided – are difficult to implement.
  • Application evolution speed. One of the largest challenges for operators is the pace of change of mobile applications. The growing penetration of smartphones, appstores and ease of “viral” adoption of new services causes a fundamental problem – applications emerge and evolve on a month-by-month or even week-by-week basis. This is faster than any realistic internal telco processes for developing new pricing plans, or changing network policies. Worse, the nature of “applications” is itself changing, with the advent of HTML5 web-apps, and the ability to “mash up” multiple functions in one app “wrapper”. Is a YouTube video shared and embedded in a Facebook page a “video service”, or “social networking”?

It is also really important to recognise that certain procedures and technologies used in policy and traffic management will likely have some unanticipated side-effects. Users, devices and applications are likely to respond to controls that limit their actions, while other developments may result in “emergent behaviours” spontaneously. For instance, there is a risk that too-strict data caps might change usage models for smartphones and make users just connect to the network when absolutely necessary. This is likely to be at the same times and places when other users also feel it necessary, with the unfortunate implication that peaks of usage get “spikier” rather than being ironed-out.

There is no easy answer to addressing these type of external threats. Operator strategists and planners simply need to keep watch on emerging trends, and perhaps stress-test their assumptions and forecasts with market observers who keep tabs on such developments.

The mobile data explosion… or maybe not?

It is an undisputed fact that mobile data is growing exponentially around the world. Or is it?

A J-curve or an S-curve?

Telco 2.0 certainly thinks that growth in data usage is occurring, but is starting to see signs that the smooth curves that drive so many other decisions might not be so smooth – or so steep – after all. If this proves to be the case, it could be far more disruptive to operators and vendors than any of the individual technologies discussed later in the report. If operator strategists are not at least scenario-planning for lower data growth rates, they may find themselves in a very uncomfortable position in a year’s time.

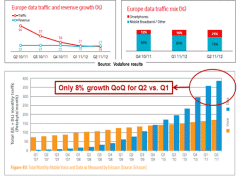
In its most recent study of mobile operators’ traffic patterns, Ericsson concluded that Q2 2011 data growth was just 8% globally, quarter-on-quarter, a far cry from the 20%+ growths seen previously, and leaving a chart that looks distinctly like the beginning of an S-curve rather than a continued “hockey stick”. Given that the 8% includes a sizeable contribution from undoubted high-growth developing markets like China, it suggests that other markets are maturing quickly. (We are rather sceptical of Ericsson’s suggestion of seasonality in the data). Other data points come from O2 in the UK , which appears to have had essentially zero traffic growth for the past few quarters, or Vodafone which now cites European data traffic to be growing more slowly (19% year-on-year) than its data revenues (21%). Our view is that current global growth is c.60-70%, c.40% in mature markets and 100%+ in developing markets.

Figure 1 – Trends in European data usage

 Trends in European Data Usage
 

Now it is possible that various one-off factors are at play here – the shift from unlimited to tiered pricing plans, the stronger enforcement of “fair-use” plans and the removal of particularly egregious heavy users. Certainly, other operators are still reporting strong growth in traffic levels. We may see resumption in growth, for example if cellular-connected tablets start to be used widely for streaming video. 

But we should also consider the potential market disruption, if the picture is less straightforward than the famous exponential charts. Even if the chart looks like a 2-stage S, or a “kinked” exponential, the gap may have implications, like a short recession in the economy. Many of the technical and business model innovations in recent years have been responses to the expected continual upward spiral of demand – either controlling users’ access to network resources, pricing it more highly and with greater granularity, or building out extra capacity at a lower price. Even leaving aside the fact that raw, aggregated “traffic” levels are a poor indicator of cost or congestion, any interruption or slow-down of the growth will invalidate a lot of assumptions and plans.

Our view is that the scary forecasts of “explosions” and “tsunamis” have led virtually all parts of the industry to create solutions to the problem. We can probably list more than 20 approaches, most of them standalone “silos”.

Figure 2 – A plethora of mobile data traffic management solutions

A Plethora of Mobile Data Traffic Management Solutions

What seems to have happened is that at least 10 of those approaches have worked – caps/tiers, video optimisation, WiFi offload, network densification and optimisation, collaboration with application firms to create “network-friendly” software and so forth. Taken collectively, there is actually a risk that they have worked “too well”, to the extent that some previous forecasts have turned into “self-denying prophesies”.

There is also another common forecasting problem occurring – the assumption that later adopters of a technology will have similar behaviour to earlier users. In many markets we are now reaching 30-50% smartphone penetration. That means that all the most enthusiastic users are already connected, and we’re left with those that are (largely) ambivalent and probably quite light users of data. That will bring the averages down, even if each individual user is still increasing their consumption over time. But even that assumption may be flawed, as caps have made people concentrate much more on their usage, offloading to WiFi and restricting their data flows. There is also some evidence that the growing numbers of free WiFi points is also reducing laptop use of mobile data, which accounts for 70-80% of the total in some markets, while the much-hyped shift to tablets isn’t driving much extra mobile data as most are WiFi-only.

So has the industry over-reacted to the threat of a “capacity crunch”? What might be the implications?

The problem is that focusing on a single, narrow metric “GB of data across the network” ignores some important nuances and finer detail. From an economics standpoint, network costs tend to be driven by two main criteria:

  • Network coverage in terms of area or population
  • Network capacity at the busiest places/times

Coverage is (generally) therefore driven by factors other than data traffic volumes. Many cells have to be built and run anyway, irrespective of whether there’s actually much load – the operators all want to claim good footprints and may be subject to regulatory rollout requirements. Peak capacity in the most popular locations, however, is a different matter. That is where issues such as spectrum availability, cell site locations and the latest high-speed networks become much more important – and hence costs do indeed rise. However, it is far from obvious that the problems at those “busy hours” are always caused by “data hogs” rather than sheer numbers of people each using a small amount of data. (There is also another issue around signalling traffic, discussed later). 

Yes, there is a generally positive correlation between network-wide volume growth and costs, but it is far from perfect, and certainly not a direct causal relationship.

So let’s hypothesise briefly about what might occur if data traffic growth does tail off, at least in mature markets.

  • Delays to LTE rollout – if 3G networks are filling up less quickly than expected, the urgency of 4G deployment is reduced.
  • The focus of policy and pricing for mobile data may switch back to encouraging use rather than discouraging/controlling it. Capacity utilisation may become an important metric, given the high fixed costs and low marginal ones. Expect more loyalty-type schemes, plus various methods to drive more usage in quiet cells or off-peak times.
  • Regulators may start to take different views of traffic management or predicted spectrum requirements.
  • Prices for mobile data might start to fall again, after a period where we have seen them rise. Some operators might be tempted back to unlimited plans, for example if they offer “unlimited off-peak” or similar options.
  • Many of the more complex and commercially-risky approaches to tariffing mobile data might be deprioritised. For example, application-specific pricing involving packet-inspection and filtering might get pushed back down the agenda.
  • In some cases, we may even end up with overcapacity on cellular data networks – not to the degree we saw in fibre in 2001-2004, but there might still be an “overhang” in some places, especially if there are multiple 4G networks.
  • Steady growth of (say) 20-30% peak data per annum should be manageable with the current trends in price/performance improvement. It should be possible to deploy and run networks to meet that demand with reducing unit “production cost”, for example through use of small cells. That may reduce the pressure to fill the “revenue gap” on the infamous scissors-diagram chart.

Overall, it is still a little too early to declare shifting growth patterns for mobile data as a “disruption”. There is a lack of clarity on what is happening, especially in terms of responses to the new controls, pricing and management technologies put recently in place. But operators need to watch extremely closely what is going on – and plan for multiple scenarios.

Specific recommendations will depend on an individual operator’s circumstances – user base, market maturity, spectrum assets, competition and so on. But broadly, we see three scenarios and implications for operators:

  • “All hands on deck!”: Continued strong growth (perhaps with a small “blip”) which maintains the pressure on networks, threatens congestion, and drives the need for additional capacity, spectrum and capex.
    • Operators should continue with current multiple strategies for dealing with data traffic – acquiring new spectrum, upgrading backhaul, exploring massive capacity enhancement with small cells and examining a variety of offload and optimisation techniques. Where possible, they should explore two-sided models for charging and use advanced pricing, policy or segmentation techniques to rein in abusers and reward those customers and applications that are parsimonious with their data use. Vigorous lobbying activities will be needed, for gaining more spectrum, relaxing Net Neutrality rules and perhaps “taxing” content/Internet companies for traffic injected onto networks.
  • “Panic over”: Moderating and patchy growth, which settles to a manageable rate – comparable with the patterns seen in the fixed broadband marketplace
    • This will mean that operators can “relax” a little, with the respite in explosive growth meaning that the continued capex cycles should be more modest and predictable. Extension of today’s pricing and segmentation strategies should improve margins, with continued innovation in business models able to proceed without rush, and without risking confrontation with Internet/content companies over traffic management techniques. Focus can shift towards monetising customer insight, ensuring that LTE rollouts are strategic rather than tactical, and exploring new content and communications services that exploit the improving capabilities of the network.
  • “Hangover”: Growth flattens off rapidly, leaving operators with unused capacity and threatening brutal price competition between telcos.
    • This scenario could prove painful, reminiscent of early-2000s experience in the fixed-broadband marketplace. Wholesale business models could help generate incremental traffic and revenue, while the emphasis will be on fixed-cost minimisation. Some operators will scale back 4G rollouts until cost and maturity go past the tipping-point for outright replacement of 3G. Restrictive policies on bandwidth use will be lifted, as operators compete to give customers the fastest / most-open access to the Internet on mobile devices. Consolidation – and perhaps bankruptcies – may ensure as declining data prices may coincide with substitution of core voice and messaging business

To read the note in full, including the following analysis…

  • Introduction
  • Telco-driven disruption vs. external trends
  • External disruptions to monitor
  • The mobile data explosion… or maybe not?
  • A J-curve or an S-curve?
  • Evolving the mobile network
  • Overview
  • LTE
  • Network sharing, wholesale and outsourcing
  • WiFi
  • Next-gen IP core networks (EPC)
  • Femtocells / small cells / “cloud RANs”
  • HetNets
  • Advanced offload: LIPA, SIPTO & others
  • Peer-to-peer connectivity
  • Self optimising networks (SON)
  • M2M-specific broadband innovations
  • Policy, control & business model enablers
  • The internal politics of mobile broadband & policy
  • Two sided business-model enablement
  • Congestion exposure
  • Mobile video networking and CDNs
  • Controlling signalling traffic
  • Device intelligence
  • Analytics & QoE awareness
  • Conclusions & recommendations
  • Index

…and the following figures…

  • Figure 1 – Trends in European data usage
  • Figure 2 – A plethora of mobile data traffic management solutions
  • Figure 3 – Not all operator WiFi is “offload” – other use cases include “onload”
  • Figure 4 – Internal ‘power tensions’ over managing mobile broadband
  • Figure 5 – How a congestion API could work
  • Figure 6 – Relative Maturity of MBB Management Solutions
  • Figure 7 – Laptops generate traffic volume, smartphones create signalling load
  • Figure 8 – Measuring Quality of Experience
  • Figure 9 – Summary of disruptive network innovations

Members of the Telco 2.0 Executive Briefing Subscription Service and Future Networks Stream can download the full 44 page report in PDF format hereNon-Members, please subscribe here, buy a Single User license for this report online here for £795 (+VAT for UK buyers), or for multi-user licenses or other enquiries, please email contact@telco2.net / call +44 (0) 207 247 5003.

Organisations, geographies, people and products referenced: 3GPP, Aero2, Alcatel Lucent, AllJoyn, ALU, Amazon, Amdocs, Android, Apple, AT&T, ATIS, BBC, BlackBerry, Bridgewater, CarrierIQ, China, China Mobile, China Unicom, Clearwire, Conex, DoCoMo, Ericsson, Europe, EverythingEverywhere, Facebook, Femto Forum, FlashLinq, Free, Germany, Google, GSMA, H3G, Huawei, IETF, IMEI, IMSI, InterDigital, iPhones,Kenya, Kindle, Light Radio, LightSquared, Los Angeles, MBNL, Microsoft, Mobily, Netflix, NGMN, Norway, NSN, O2, WiFi, Openet, Qualcomm, Radisys, Russia, Saudi Arabia, SoftBank, Sony, Stoke, Telefonica, Telenor, Time Warner Cable, T-Mobile, UK, US, Verizon, Vita, Vodafone, WhatsApp, Yota, YouTube, ZTE.

Technologies and industry terms referenced: 2G, 3G, 4.5G, 4G, Adaptive bitrate streaming, ANDSF (Access Network Discovery and Selection Function), API, backhaul, Bluetooth, BSS, capacity crunch, capex, caps/tiers, CDMA, CDN, CDNs, Cloud RAN, content delivery networks (CDNs), Continuous Computing, Deep packet inspection (DPI), DPI, DRM, Encryption, Enhanced video, EPC, ePDG (Evolved Packet Data Gateway), Evolved Packet System, Femtocells, GGSN, GPS, GSM, Heterogeneous Network (HetNet), Heterogeneous Networks (HetNets), HLRs, hotspots, HSPA, HSS (Home Subscriber Server), HTML5, HTTP Live Streaming, IFOM (IP Flow Mobility and Seamless Offload), IMS, IPR, IPv4, IPv6, LIPA (Local IP Access), LTE, M2M, M2M network enhancements, metro-cells, MiFi, MIMO (multiple in, MME (Mobility Management Entity), mobile CDNs, mobile data, MOSAP, MSISDN, MVNAs (mobile virtual network aggregators)., MVNO, Net Neutrality, network outsourcing, Network sharing, Next-generation core networks, NFC, NodeBs, offload, OSS, outsourcing, P2P, Peer-to-peer connectivity, PGW (PDN Gateway), picocells, policy, Policy and Charging Rules Function (PCRF), Pre-cached video, pricing, Proximity networks, Public WiFi, QoE, QoS, RAN optimisation, RCS, remote radio heads, RFID, self-optimising network technology (SON), Self-optimising networks (SON), SGW (Serving Gateway), SIM-free wireless, single RANs, SIPTO (Selective IP Traffic Offload), SMS, SoftSIM, spectrum, super-femtos, Telco 2.0 Happy Pipe, Transparent optimisation, UMTS, ‘Under-The-Floor’ (UTF) Players, video optimisation, VoIP, VoLTE, VPN, White space, WiFi, WiFi Direct, WiFi offloading, WiMAX, WLAN.

The value of “Smart Pipes” to mobile network operators

Preface

Rationale and hypothesis for this report

It is over fourteen years since David Isenberg wrote his seminal paper The Rise of the Stupid Network in which he outlined the view that telephony networks would increasingly become dumb pipes as intelligent endpoints came to control how and where data was transported. Many of his predictions have come to fruition. Cheaper computing technology has resulted in powerful ‘smartphones’ in the hands of millions of people and new powerful internet players are using data centres to distribute applications and services ‘over the top’ to users over fixed and mobile networks.

The hypothesis behind this piece of research is that endpoints cannot completely control the network. STL Partners believes that the network itself needs to retain intelligence so it can interpret the information it is transporting between the endpoints. Mobile network operators, quite rightly, will not be able to control how the network is used but must retain the ability within the network to facilitate a better experience for the endpoints. The hypothesis being tested in this research is that ‘smart pipes’ are needed to:

  1. Ensure that data is transported efficiently so that capital and operating costs are minimised and the internet and other networks remain cheap methods of distribution.
  2. Improve user experience by matching the performance of the network to the nature of the application or service being used. ‘Best effort’ is fine for asynchronous communication, such as email or text, but unacceptable for voice. A video call or streamed movie requires guaranteed bandwidth, and real-time gaming demands ultra-low latency;
  3. Charge appropriately for use of the network. It is becoming increasingly clear that the Telco 1.0 business model – that of charging the end-user per minute or per Megabyte – is under pressure as new business models for the distribution of content and transportation of data are being developed. Operators will need to be capable of charging different players – end-users, service providers, third-parties (such as advertisers) – on a real-time basis for provision of broadband and guaranteed quality of service (QoS);
  4. Facilitate interactions within the digital economy. Operators can compete and partner with other players, such as the internet companies, in helping businesses and consumers transact over the internet. Networks are no longer confined to communications but are used to identify and market to prospects, complete transactions, make and receive payments and remittances, and care for customers. The knowledge that operators have about their customers coupled with their skills and assets in identity and authentication, payments, device management, customer care etc. mean that ‘the networks’ can be ‘enablers’ in digital transactions between third-parties – helping them to happen more efficiently and effectively.

Overall, smarter networks will benefit network users – upstream service providers and end users – as well as the mobile network operators and their vendors and partners. Operators will also be competing to be smarter than their peers as, by differentiating here, they gain cost, revenue and performance advantages that will ultimately transform in to higher shareholder returns.

Sponsorship and editorial independence

This report has kindly been sponsored by Tellabs and is freely available. Tellabs developed the initial concepts, and provided STL Partners with the primary input and scope for the report. Research, analysis and the writing of the report itself was carried out independently by STL Partners. The views and conclusions contained herein are those of STL Partners.

About Tellabs

Tellabs logo

Tellabs innovations advance the mobile Internet and help our customers succeed. That’s why 43 of the top 50 global communications service providers choose our mobile, optical, business and services solutions. We help them get ahead by adding revenue, reducing expenses and optimizing networks.

Tellabs (Nasdaq: TLAB) is part of the NASDAQ Global Select Market, Ocean Tomo 300® Patent Index, the S&P 500 and several corporate responsibility indexes including the Maplecroft Climate Innovation Index, FTSE4Good and eight FTSE KLD indexes. http://www.tellabs.com

Executive Summary

Mobile operators no longer growth stocks

Mobile network operators are now valued as utility companies in US and Europe (less so APAC). Investors are not expecting future growth to be higher than GDP and so are demanding money to be returned in the form of high dividends.

Two ‘smart pipes’ strategies available to operators

In his seminal book, Michael Porter identified three generic strategies for companies – ‘Cost leadership’, ‘Differentiation’ and ‘Focus’. Two of these are viable in the mobile telecommunications industry – Cost leadership, or Happy Pipe in STL Partners parlance, and Differentiation, or Full-service Telco 2.0. No network operators have found a Focus strategy to work as limiting the customer base to a segment of the market has not yielded sufficient returns on the high capital investment of building a network. Even MVNOs that have pursued this strategy, such as Helio which targeted Korean nationals in the US, have struggled.

Underpinning the two business strategies are related ‘smart pipe’ approaches – smart network and smart services:

Normal
0

false
false
false

EN-GB
X-NONE
X-NONE


Porter

Strategy

Telco 2.0 strategy

Nature of smartness

Characteristics

Cost leadership

Happy Pipe

Smart network

Cost efficiency – minimal network, IT and commercial costs.  Simple utility offering.

Differentiation

Full-service Telco 2.0

Smart services

Technical and commercial flexibility: improve customer experience by integrating network capabilities with own and third-party services and charging either end user or service provider (or both).

Normal
0

false
false
false

EN-GB
X-NONE
X-NONE

Source: STL Partners

It is important to note that, currently at least, having a smart network is a precursor of smart services.  It would be impossible for an operator to implement a Full-service Telco 2.0 strategy without having significant network intelligence.  Full-service Telco 2.0 is, therefore, an addition to a Happy Pipe strategy.

Smart network strategy good, smart services strategy better

In a survey conducted for this report, it was clear that operators are pursuing ‘smart’ strategies, whether at the network level or extending beyond this into smart services, for three reasons:

  • Revenue growth: protecting existing revenue sources and finding new ones.  This is seen as the single most important driver of building more intelligence.
  • Cost savings: reducing capital and operating costs.
  • Performance improvement: providing customers with an improved customer experience.

Assuming that most mobile operators currently have limited smartness in either network or services, our analysis suggests significant upside in financial performance from successfully implementing either a Happy Pipe or Full-service Telco 2.0 strategy.  Most mobile operators generate Cash Returns on Invested Capital of between 5 and 7%.  For the purposes of our analysis, we have a assumed a baseline of 5.8%.  The lower capital and operator costs of a Happy Pipe strategy could increase this to 7.4% and the successful implementation of a Full-service Telco 2.0 strategy would increase this to a handsome 13.3%:

Normal
0

false
false
false

EN-GB
X-NONE
X-NONE

Telco 2.0 strategy

Nature of smartness

Cash Returns on Invested Capital

As-is – Telco 1.0

Low – relatively dumb

5.8%

Happy Pipe

Smart network

7.4%

Full-service Telco 2.0

Smart services

13.3%

Source: STL Partners

STL Partners has identified six opportunity areas for mobile operators to exploit with a Full-service Telco 2.0 strategy.  Summarised here, these are outlined in detail in the report:

Opportunity Type

Approach

Typical Services

Core Services

Improving revenues and customer loyalty by better design, analytics, and smart use of data in existing services.

Access, Voice and Messaging, Broadband, Standard Wholesale, Generic Enterprise ICT Services (inc. SaaS)

Vertical industry solutions (SI)

Delivery of ICT projects and support to vertical enterprise sectors.

Systems Integration (SI), Vertical CEBP solutions, Vertical ICT, Vertical M2M solutions, and Private Cloud.

Infrastructure services

Optimising cost and revenue structures by buying and selling core telco ICT asset capacity.

Bitstream ADSL, Unbundled Local Loop, MVNOs, Wholesale Wireless, Network Sharing, Cloud – IaaS.

Embedded communications

Enabling wider use of voice, messaging, and data by facilitating access to them and embedding them in new products.

Comes with data, Sender pays delivery, Horizontal M2M Platforms, Voice, Messaging and Data APIs for 3rd Parties.

Third-pary business enablers

Enabling new telco assets (e.g. Customer data) to be leveraged in support of 3rd party business processes.

Telco enabled Identity and Authorisation, Advertising and Marketing, Payments. APIs to non-core services and assets.

Own-brand OTT services

Building value through Telco-owned online properties and ‘Over-the-Top’ services.

Online Media, Enterprise Web Services, Own Brand VOIP services.


Source: STL Partners

Normal
0

false
false
false

EN-GB
X-NONE
X-NONE

Regional approaches to smartness vary

As operators globally experience a slow-down in revenue growth, they are pursuing ways of maintaining margins by reducing costs.  Unsurprisingly therefore, most operators in North America, Europe and Asia-Pacific appear to be pursuing a Happy Pipe/smart network strategy.  Squeezing capital and operating costs and improving network performance is being sought through such approaches as:

  • Physical network sharing – usually involving passive elements such as towers, air-conditioning equipment, generators, technical premises and pylons.
  • Peering data traffic rather than charging (and being charged) for transit.
  • Wi-Fi offload – moving data traffic from the mobile network on to cheaper fixed networks.
  • Distributing content more efficiently through the use of multicast and CDNs.
  • Efficient network configuration and provisioning.
  • Traffic shaping/management via deep-packet inspection (DPI) and policy controls.
  • Network protection – implementing security procedures for abuse/fraud/spam so that network performance is maximised.
  • Device management to ameliorate device impact on network and improve customer experience

Vodafone Asia-Pacific is a good example of an operator pursuing these activities aggressively and as an end in itself rather than as a basis for a Telco 2.0 strategy.  Yota in Russia and Lightsquared in the US are similarly content with being Happy Pipers.

In general, Asia-Pacific has the most disparate set of markets and operators.  Markets vary radically in terms of maturity, structure and regulation and operators seem to polarise into extreme Happy Pipers (Vodafone APAC, China Mobile, Bharti) and Full-Service Telco 2.0 players (NTT Docomo, SK Telecom, SingTel, Globe).

In Telefonica, Europe is the home of the operator with the most complete Telco 2.0 vision globally.  Telefonica has built and acquired a number of ‘smart services’ which appear to be gaining traction including O2 Priority Moments, Jajah, Tuenti and Terra.  Recent structural changes at the company, in which Telefonica Digital was created to focus on opportunities in the digital economy, further indicate the company’s focus on Telco 2.0 and smart services.  Europe too appears to be the most collaborative market.  Vodafone, Telefonica, Orange, Telecom Italia and T-Mobile are all working together on a number of Telco 2.0 projects and, in so doing, seek to generate enough scale to attract upstream developers and downstream end-users.

The sheer scale of the two leading mobile operators in the US, AT&T and Verizon, which have over 100 million subscribers each, means that they are taking a different approach to Telco 2.0.  They are collaborating on one or two opportunities, notably with ISIS, a near-field communications payments solution for mobile, which is a joint offer from AT&T, Verizon and T-Mobile.  However, in the main, there is a high degree of what one interviewee described as ‘Big Bell dogma’ – the view that their company is big enough and powerful enough to take on the OTT players and ‘control’ the experiences of end users in the digital economy.  The US market is more consolidated than Europe (giving the big players more power) but, even so, it seems unlikely that either AT&T or Verizon can keep customers using only their services – the lamented wall garden approach.

Implementing a Telco 2.0 strategy is important but challenging

STL Partners explored both how important and how difficult it is to implement the changes required to deliver a Happy Pipe strategy (outlined in the bullets above) and those needed for Full-service Telco 2.0 strategy, via industry interviews with operators and a quantitative survey.  The key findings of this analysis were:

  • Overall, respondents felt that many activities were important as part of a smart strategy.  In our survey, all except two activity areas – Femto/pico underlay and Enhanced switches (vs. routers) – were rated by more than 50% of respondents as either ‘Quite important’ or ‘Very important’ (see chart below).
  • Activities associated with a Full-service Telco 2.0 strategy were rated as particularly important:
  • Making operator assets available via APIs, Differentiated pricing and charging and Personalised and differentiated services were ranked 1, 2 and 3 out of the thirteen activities.
  • Few considered that any of the actions were dangerous and could destroy value, although Physical network sharing and Traffic shaping/DPI were most often cited here.
Smart Networks - important implementation factors to MNOs
Source: STL Partners/Telco 2.0 & Tellabs ‘Smart pipes’ survey, July 2011, n=107

NOTE: Overall ranking was based on a weighted scoring policy of Very important +4, Quite important +3, Not that important +2, Unimportant +1, Dangerous -4.

Overall, most respondents to the survey and people we spoke with felt that operators had more chance in delivering a Happy Pipe strategy and that only a few Tier 1 operators would be successful with a Full-Service Telco 2.0 strategy.  For both strategies, they were surprisingly sceptical about operators’ ability to implement the necessary changes.  Five reasons were cited as major barriers to success and were particularly big when considering a Full-Service Telco 2.0 strategy:

  1. Competition from internet players.  Google, Apple, Facebook et al preventing operators from expanding their role in the digital economy.
  2. Difficulty in building a viable ecosystem. Bringing together the required players for such things as near-field communications (NFC) mobile payments and sharing value among them.
  3. Lack of mobile operators skills.  The failure of operators to develop or exploit key skills required for facilitating transactions such as customer data management and privacy.
  4. Culture.  Being too wedded to existing products, services and business models to alter the direction of the super-tanker.
  5. Organisation structure. Putting in place the people and processes to manage the change.

Looking at the specific activities required to build smartness, it was clear that those required for a Full-service Telco 2.0/smart services strategy are considered the hardest to implement (see chart below):

  • Personalised and differentiated services via use of customer data – content, advertising, etc.
  • Making operator assets available to end users and other service providers – location, presence, ID, payments
  • Differentiated pricing and charging based on customer segment, service, QoS
Smart Networks - how challenging are the changes?
Source: STL Partners/Telco 2.0 & Tellabs ‘Smart pipes’ survey, July 2011, n=100

NOTE: Overall ranking was based on a weighted scoring policy of Very easy +5, Relatively straightforward +4, Manageable +3, Quite difficult +2, Very difficult -2.

Conclusions and recommendations

By comparing the relative importance of specific activities against how easy they are to implement, we were able to classify them into four categories:

Category

Importance for delivering smart strategy

Relative ease of implementation

Must get right

High

Easy

Strive for new role

High

Difficult

Housekeeping

Low

Easy

Forget

Low

Difficult

Rating of factors needed for Telco 2.0 'Smart Pipes' and 'Full Services' Strategies
Source: STL Partners/Telco 2.0 & Tellabs ‘Smart pipes’ survey, July 2011, n=100

Unfortunately, as the chart above shows, no activities fall clearly into the ‘Forget’ categories but there are some clear priorities:

  • A Full-service Telco 2.0 strategy is about striving for a new role in the digital economy and is probably most appropriate for Tier 1 MNOs, since it is going to require substantial scale and investment in new skills such as software and application development and customer data.  It will also require the development of new partnerships and ecosystems and complex commercial arrangements with players from other industries (e.g. banking). 
  • There is a cluster of smart network activities that are individually relatively straightforward to implement and will yield a big bang for the buck if investments are made – the ‘Must get right’ group:
  • More efficient network configuration and provisioning;
  • Strengthen network security to cope with abuse and fraud;
  • Improve device management (and cooperation with handset manufacturers and content players) to reduce the impact of smartphone burden on the network;

Although deemed more marginal in our survey, we would include as equally important:

  • Traffic shaping and DPI which, in many cases, underpins various smart services opportunities such as differentiated pricing based on QoS and Multicast and CDNs which are proven in the fixed world and likely to be equally beneficial in a video-dominated mobile one.

There is second cluster of smart network activities which appear to be equally easy (or difficult) to implement but are deemed by respondents to be lower value and therefore fall into a lower ‘Housekeeping’ category:

  • Wi-Fi offload – we were surprised by this given the emphasis placed on this by NTT Docomo, China Mobile, AT&T, O2 and others;
  • Peering (vs. transit) and Enhanced switches  – this is surely business-as-usual for all MNOs;
  • Femto/Pico underlay – generally felt to be of limited importance by respondents although a few cited its importance in pushing network intelligence to the edge which would enable MNOs to more easily deliver differentiated QoS and more innovative retail and wholesale revenue models;
  • Physical network sharing – again, a surprising result given the keenness of the capital markets on this strategy. 


Overall, it appears that mobile network operators need to continue to invest resources in developing smart networks but that a clear prioritisation of efforts is needed given the multitude of ‘moving parts’ required to develop a smart network that will deliver a successful Happy Pipe strategy.

A successful Full-Service Telco 2.0 strategy is likely to be extremely profitable for a mobile network operator and would result in a substantial increase in share price.  But delivering this remains a major challenge and investors are sceptical.  Collaboration, experimentation and investment are important facets of a Telco 2.0 implementation strategy as they drive scale, learning and innovation respectively.  Given the demands of investors for dividend yields, investment is only likely to be available if an operator becomes more efficient, so implementing a Happy Pipe strategy which reduces capital and operating costs is critical.


Report Contents


  • Executive Summary
  • Mobile network operator challenges
  • The future could still be bright
  • Defining a ‘smart’ network
  • Understanding operator strategies
  • Video: Case study in delivering differentiation and cost leadership
  • The benefits of Smart on CROIC
  • Implementing a ‘smart’ strategy
  • Conclusions and recommendations

Report Figures


  • Figure 1: Pressure from all sides for operators
  • Figure 2: Vodafone historical dividend yield – from growth to income
  • Figure 3: Unimpressed capital markets and falling employment levels
  • Figure 4: Porter and Telco 2.0 competitive strategies
  • Figure 5: Defining Differentiation/Telco 2.0
  • Figure 6 – The Six Opportunity Areas – Approach, Typical Services and Examples
  • Figure 7: Defining Cost Leadership/Happy Pipe
  • Figure 8: Defining ‘smartness’
  • Figure 9: Telco 2.0 survey – Defining smartness
  • Figure 10: NTT’s smart content delivery system – a prelude to mobile CDNs?
  • Figure 11: Vodafone India’s ARPU levels are now below $4/month, illustrating the need for a ‘smart network’ approach
  • Figure 12: China Mobile’s WLAN strategy for coverage, capacity and cost control
  • Figure 13: GCash – Globe’s text-based payments service
  • Figure 14: PowerOn – SingTel’s on-demand business services
  • Figure 15: Telefonica’s Full-service Telco 2.0 strategy
  • Figure 16: Vodafone – main messages are about being an efficient data pipe
  • Figure 17: Collaboration with other operators key to smart services strategy
  • Figure 18: Verizon Wireless and Skype offering
  • Figure 19: Content delivery with and without a CDN
  • Figure 20: CDN benefits to consumers are substantial
  • Figure 21: Cash Returns on Invest Capital of different Telco 2.0 opportunity areas
  • Figure 22: The benefits of smart to a MNO are tangible and significant
  • Figure 23: Telco 2.0 Survey – benefits of smart to MNOs
  • Figure 24: Telco 2.0 survey – MNO chances of success with smart strategies
  • Figure 25: Telco 2.0 survey – lots of moving parts required for ‘smartness’
  • Figure 26: Telco 2.0 survey – Differentiation via smart services is particularly challenging
  • Figure 27: Telco 2.0 survey – Implementing changes is challenging
  • Figure 28: Telco 2.0 survey – Prioritising smart implementation activities


‘Under-The-Floor’ (UTF) Players: threat or opportunity?

Introduction

The ‘smart pipe’ imperative

In some quarters of the telecoms industry, the received wisdom is that the network itself is merely an undifferentiated “pipe”, providing commodity connectivity, especially for data services. The value, many assert, is in providing higher-tier services, content and applications, either to end-users, or as value-added B2B services to other parties. The Telco 2.0 view is subtly different. We maintain that:

  1. Increasingly valuable services will be provided by third-parties but that operators can provide a few end-user services themselves. They will, for example, continue to offer voice and messaging services for the foreseeable future.
  2. Operators still have an opportunity to offer enabling services to ‘upstream’ service providers such as personalisation and targeting (of marketing and services) via use of their customer data, payments, identity and authentication and customer care.
  3. Even if operators fail (or choose not to pursue) options 1 and 2 above, the network must be ‘smart’ and all operators will pursue at least a ‘smart network’ or ‘Happy Pipe’ strategy. This will enable operators to achieve three things.
  • To ensure that data is transported efficiently so that capital and operating costs are minimised and the Internet and other networks remain cheap methods of distribution.
  • To improve user experience by matching the performance of the network to the nature of the application or service being used – or indeed vice versa, adapting the application to the actual constraints of the network. ‘Best efforts’ is fine for asynchronous communication, such as email or text, but unacceptable for traditional voice telephony. A video call or streamed movie could exploit guaranteed bandwidth if possible / available, or else they could self-optimise to conditions of network congestion or poor coverage, if well-understood. Other services have different criteria – for example, real-time gaming demands ultra-low latency, while corporate applications may demand the most secure and reliable path through the network.
  • To charge appropriately for access to and/or use of the network. It is becoming increasingly clear that the Telco 1.0 business model – that of charging the end-user per minute or per Megabyte – is under pressure as new business models for the distribution of content and transportation of data are being developed. Operators will need to be capable of charging different players – end-users, service providers, third-parties (such as advertisers) – on a real-time basis for provision of broadband and maybe various types or tiers of quality of service (QoS). They may also need to offer SLAs (service level agreements), monitor and report actual “as-experienced” quality metrics or expose information about network congestion and availability.

Under the floor players threaten control (and smartness)

Either through deliberate actions such as outsourcing, or through external agency (Government, greenfield competition etc), we see the network-part of the telco universe suffering from a creeping loss of control and ownership. There is a steady move towards outsourced networks, as they are shared, or built around the concept of open-access and wholesale. While this would be fine if the telcos themselves remained in control of this trend (we see significant opportunities in wholesale and infrastructure services), in many cases the opposite is occurring. Telcos are losing control, and in our view losing influence over their core asset – the network. They are worrying so much about competing with so-called OTT providers that they are missing the threat from below.

At the point at which many operators, at least in Europe and North America, are seeing the services opportunity ebb away, and ever-greater dependency on new models of data connectivity provision, they are potentially cutting off (or being cut off from) one of their real differentiators.
Given the uncertainties around both fixed and mobile broadband business models, it is sensible for operators to retain as many business model options as possible. Operators are battling with significant commercial and technical questions such as:

  • Can upstream monetisation really work?
  • Will regulators permit priority services under Net Neutrality regulations?
  • What forms of network policy and traffic management are practical, realistic and responsive?

Answers to these and other questions remain opaque. However, it is clear that many of the potential future business models will require networks to be physically or logically re-engineered, as well as flexible back-office functions, like billing and OSS, to be closely integrated with the network.
Outsourcing networks to third-party vendors, particularly when such a network is shared with other operators is dangerous in these circumstances. Partners that today agree on the principles for network-sharing may have very different strategic views and goals in two years’ time, especially given the unknown use-cases for new technologies like LTE.

This report considers all these issues and gives guidance to operators who may not have considered all the various ways in which network control is being eroded, from Government-run networks through to outsourcing services from the larger equipment providers.

Figure 1 – Competition in the services layer means defending network capabilities is increasingly important for operators Under The Floor Players Fig 1 Defending Network Capabilities

Source: STL Partners

Industry structure is being reshaped

Over the last year, Telco 2.0 has updated its overall map of the telecom industry, to reflect ongoing dynamics seen in both fixed and mobile arenas. In our strategic research reports on Broadband Business Models, and the Roadmap for Telco 2.0 Operators, we have explored the emergence of various new “buckets” of opportunity, such as verticalised service offerings, two-sided opportunities and enhanced variants of traditional retail propositions.
In parallel to this, we’ve also looked again at some changes in the traditional wholesale and infrastructure layers of the telecoms industry. Historically, this has largely comprised basic capacity resale and some “behind the scenes” use of carriers-carrier services (roaming hubs, satellite / sub-oceanic transit etc).

Figure 2 – Telco 1.0 Wholesale & Infrastructure structure

Under The Floor (UTF) Players Fig 2 Telco 1.0 Scenario

Source: STL Partners

Content

  • Revising & extending the industry map
  • ‘Network Infrastructure Services’ or UTF?
  • UTF market drivers
  • Implications of the growing trend in ‘under-the-floor’ network service providers
  • Networks must be smart and controlling them is smart too
  • No such thing as a dumb network
  • Controlling the network will remain a key competitive advantage
  • UTF enablers: LTE, WiFi & carrier ethernet
  • UTF players could reduce network flexibility and control for operators
  • The dangers of ceding control to third-parties
  • No single answer for all operators but ‘outsourcer beware’
  • Network outsourcing & the changing face of major vendors
  • Why become an under-the-floor player?
  • Categorising under-the-floor services
  • Pure under-the-floor: the outsourced network
  • Under-the-floor ‘lite’: bilateral or multilateral network-sharing
  • Selective under-the-floor: Commercial open-access/wholesale networks
  • Mandated under-the-floor: Government networks
  • Summary categorisation of under-the-floor services
  • Next steps for operators
  • Build scale and a more sophisticated partnership approach
  • Final thoughts
  • Index


  • Figure 1 – Competition in the services layer means defending network capabilities is increasingly important for operators
  • Figure 2 – Telco 1.0 Wholesale & Infrastructure structure
  • Figure 3 – The battle over infrastructure services is intensifying
  • Figure 4 – Examples of network-sharing arrangements
  • Figure 5 – Examples of Government-run/influenced networks
  • Figure 6 – Four under-the-floor service categories
  • Figure 7: The need for operator collaboration & co-opetition strategies

LTE: Less Transforming than Expected

This is an extract from a report by Arete Research, a Telco 2.0TM partner specalising in investment analysis. The views in this article are not intended to constitute investment advice from Telco 2.0TM or STL Partners. We are reprinting Arete’s analysis to give our customers some additional insight into how some investors see the Telecoms market.

This report can be downloaded in full in PDF format by members of the Telco 2.0 Executive Briefing service and Future Networks Stream using the links below.

                            Read in Full (Members only)        To Subscribe

Please use the links or email contact@telco2.net or call +44 (0) 207 247 5003 to find out more.

To share this article easily, please click:


A New IPR Cold War Begins

Everyone in the technology industry loves “next gen” products: they solve all the problems of the previous iteration! In LTE: Late, Tempting, and Elusive in June ’09, we [Arete Research] forecast delays and said LTE would require intensive R&D and bring minimal near-term sales. Two years later, its impact is limited, mostly driven by market-specific reasons.  Now we see operators adopting LTE by moving to single RAN (radio access network) platforms, giving them a choice of how to use spectrum, and sparking de facto concentration of vendor market shares. 

The “single RAN” (including LTE) is another example of deflation in wireless infrastructure; peak shipments of HSPA may be five years off, but now come with LTE.  Collapsing networks onto single platforms (so-called “network modernisation”) prepares operators to re-farm spectrum, even if short-term spend goes up.  The vendor market is consolidating around Ericsson and Huawei (both financially stable), with ZTE and Samsung as new entrants, and ALU, NSN and NEC struggling to make profits (see Fig. 1) while “pioneering” new concepts. All vendors see LTE as their chance to gain share, a dangerous phase.  LTE also threatens to add costs in ’12 as networks need optimisation. A recent LTE Asia conference reinforced our three previous meanings for this nascent technology:

Still Late.  In ’09 we said “Late is Great,” with no business case for aggressive deployment.  Most operators are in “commercial trials”, awaiting firmer spectrum allocations, if not also devices.  LTE rollouts have been admirably measured in all but a few markets, and where accelerated, mostly done for market-specific reasons.

Less Tempting?  Operators are re-setting pricing and ending unlimited plans. LTE’s better spectral efficiency requires much higher device penetration.  Operators are gradually deploying LTE as part of a evolution to single RAN networks (allowing re-farming), but few talk of “enabling new business models” beyond 3G technology.

Elusive Economics.  As a new air interface, LTE needs work in spectrum, standards and handsets. Device makers are cagey about ramping LTE volumes at mid-range price points.  Vendors are still testing new concepts to lower costs in dense urban areas.  Network economics (of any G) are driven by single RAN rollouts, often by low-cost vendors.

Transformation Hardly Happens.  For all the US 4G hype, LTE is continuing a decade-old “revolution” in mobile data (DoCoMo launched 3G in ’01), boosted by smartphones since ’07.  LTE or not, operators struggle to add value beyond connectivity.  Investors should reward operators that reach the lowest long-term cash costs, even with upfront capex.

No Help to Vendor Margins.  Despite 175 “commitments” to launch LTE, single RANs will be no bonanza, inviting fresh attempts to “buy” share. In a market we see growing ~5-10% in ’12.  Ericsson and Huawei are the only vendors now generating returns above their capital costs: LTE will not make this better, while vendors like NSN and ALU must fend off aggressive new entrants like ZTE pricing low to win swaps deals.

Figure 1: Vendor “Pro-Forma” Margins ’07-’12E: Only Two Make Likely Cost of Capital

Arete Research Estimated Returns by Network Equipment Vendor 2011

To read the Briefing in full, including in addition to the above analysis of:

  • Operators: Better Late than Early!
  • Something New Here?
  • Standards/Spectrum: Much to Do
  • Vendors: Challenges ‘Aplenty
  • … Not Enough Profits for All
  • Devices: All to Come
  • Transformation… Not!

…and the following charts and tables…

  • Figure 1: Vendor “Pro-Forma” Margins ’07-’12E: Only Two Make Likely Cost of Capital
  • Figure 2: Verizon LTE Just in the Dots
  • Figure 3: Terminals Needed to Make LTE Work
  • Figure 4: “Scissor Effect” Facing Operators
  • Figure 5: Every Bit of the Air: Potential Spectrum to Be Used for LTE
  • Figure 6: Vendor Scale on ’11 Sales: Clear Gaps

Members of the Telco 2.0TM Executive Briefing Subscription Service and Future Networks Stream can download the full 7 page report in PDF format here. Non-Members, please see here for how to subscribe. Please email contact@telco2.net or call +44 (0) 207 247 5003 for further details.

CDNs 2.0: should telcos compete with Akamai?

Content Delivery Networks (CDNs) such as Akamai’s are used to improve the quality and reduce costs of delivering digital content at volume. What role should telcos now play in CDNs? (September 2011, Executive Briefing Service, Future of the Networks Stream).
Should telcos compete with Akamai?
  Read in Full (Members only)  Buy a single user license online  To Subscribe click here

Below is an extract from this 19 page Telco 2.0 Report that can be downloaded in full in PDF format by members of the Telco 2.0 Executive Briefing service and Future Networks Stream here. Non-members can subscribe here, buy a Single User license for this report online here for £795 (+VAT), or for multi-user licenses or other enquiries, please email contact@telco2.net / call +44 (0) 207 247 5003.

To share this article easily, please click:

//

Introduction


We’ve written about Akamai’s technology strategy for global CDN before as a fine example of the best practice in online video distribution and a case study in two-sided business models, to say nothing of being a company that knows how to work with the grain of the Internet. Recently, Akamai published a paper which gives an overview of its network and how it works. It’s a great paper, if something of a serious read. Having ourselves read, enjoyed and digested it, we’ve distilled the main elements in the following analysis, and used that as a basis to look at telcos’ opportunities in the CDN market.

Related Telco 2.0 Research

In the strategy report Mobile, Fixed and Wholesale Broadband Business Models – Best Practice Innovation, ‘Telco 2.0′ Opportunities, Forecasts and Future Scenarios we examined a number of different options for telcos to reduce costs and improve the quality of content delivery, including Content Delivery Networks (CDNs).

This followed on from Future Broadband Business Models – Beyond Bundling: winning the new $250Bn delivery game in which we looked at long term trends in network architectures, including the continuing move of intelligence and storage towards the edge of the network. Most recently, in Broadband 2.0: Delivering Video and Mobile CDNs we looked at whether there is now a compelling need for Mobile CDNs, and if so, should operators partner with existing players or build / buy their own?

We’ll also be looking in depth at the opportunities in mobile CDNs at the EMEA Executive Brainstorm in London on 9-10th November 2011.

Why have a CDN anyway?

The basic CDN concept is simple. Rather than sending one copy of a video stream, software update or JavaScript library over the Internet to each user who wants it, the content is stored inside their service provider’s network, typically at the POP level in a fixed ISP.

That way, there are savings on interconnect traffic (whether in terms of paid-for transit, capex, or stress on peering relationships), and by locating the servers strategically, savings are also possible on internal backhaul traffic. Users and content providers benefit from lower latency, and therefore faster download times, snappier user interface response, and also from higher reliability because the content servers are no longer a single point of failure.

What can be done with content can also be done with code. As well as simple file servers and media streaming servers, applications servers can be deployed in a CDN in order to bring the same benefits to Web applications. Because the content providers are customers of the CDN, it is possible to also apply content optimisation with their agreement at the time it is uploaded to the CDN. This makes it possible to save further traffic, and to avoid nasty accidents like this one.

Once the CDN servers are deployed, to make the network efficient, they need to be filled up with content and located so they are used effectively – so they need to be located in the right places. An important point of a CDN, and one that may play to telcos’ strengths, is that location is important.

Figure 1: With higher speeds, geography starts to dominate download times

CDN Akamai table distance throughput time Oct 2011 Telco 2.0

Source: Akamai

CDN Player Strategies

Market Overview

CDNs are a diverse group of businesses, with several major players, notably Akamai, the market leader, EdgeCast, and Limelight Networks, all of which are pure-play CDNs, and also a number of players that are part of either carriers or Web 2.0 majors. Level(3), which is widely expected to acquire the LimeLight CDN, is better known as a massive Internet backbone operator. BT Group and Telefonica both have CDN products. On the other hand, Google, Amazon, and Microsoft operate their own, very substantial CDNs in support of their own businesses. Amazon also provides a basic CDN service to third parties. Beyond these, there are a substantial number of small players.

Akamai is by far the biggest; Arbor Networks estimated that it might account for as much as 15% of Internet traffic once the actual CDN traffic was counted in, while the top five CDNs accounted for 10% of inter-domain traffic. The distinction is itself a testament to the effectiveness of CDN as a methodology.

The impact of CDN

As an example of the benefits of their CDN, above and beyond ‘a better viewing experience’, Akamai claim that they can demonstrate a 15% increase in completed transactions on an e-commerce site by using their application acceleration product. This doesn’t seem out of court, as Amazon.com has cited similar numbers in the past, in their case by reducing the volume of data needed to deliver a given web page rather than by accelerating its delivery.

As a consequence of these benefits, and the predicted growth in internet traffic, Akamai expect traffic on their platform to reach levels equivalent to the throughput of a US national broadcast TV station within 2-5 years. In the fixed world, Akamai claims offload rates of as much as 90%. The Jetstream CDN  blog points out that mobile operators might be able to offload as much as 65% of their traffic into the CDN. These numbers refer only to traffic sources that are customers of the CDN, but it ought to be obvious that offloading 90% of the YouTube or BBC iPlayer traffic is worth having.

In Broadband 2.0: Mobile CDNs and video distribution we looked at the early prospects for Mobile CDN, and indeed, Akamai’s own move into the mobile industry is only beginning. However, Telefonica recently announced that its internal, group-wide CDN has reached an initial capability, with service available in Europe and in Argentina. They intend to expand across their entire footprint. We are aware of at least one other mobile operator which is actively investing in CDN capabilities. The degree to which CDN capabilities can be integrated into mobile networks is dependent on the operator’s choice of network architecture, which we discuss later in this note.

It’s also worth noting that one of Akamai’s unique selling points is that it is very much a global operator. As usual, there’s a problem for operators, especially mobile operators, in that the big Internet platforms are global and operators are regional. Content owners can deal with one CDN for their services all around the world – they can’t deal with one telco. Also, big video sources like national TV broadcasters can usually deal with one ex-incumbent fixed operator and cover much of the market, but must deal with several mobile operators.

Application Delivery: the frontier of CDN

Akamai is already doing a lot of what we call “ADN” (Application-Delivery Networking) by analogy to CDN. In a CDN, content is served up near the network edge. In an ADN, applications are hosted in the same way in order to deliver them faster and more reliably. (Of course, the media server in a CDN node is itself a software application.) And the numbers we cited above regarding improved transaction completion rates are compelling.

However, we were a little under-whelmed by the details given of their Edge Computing product. It is restricted to J2EE and XSLT applications, and it seems quite limited in the power and flexibility it offers compared to the state of the art in cloud computing. Google App Engine and Amazon EC2 look far more interesting from a developer point of view. Obviously, they’re going for a different market. But we heartily agree with Dan Rayburn that the future of CDN is applications acceleration, and that this goes double for mobile with its relatively higher background levels of latency.

Interestingly, some of Akamai’s ADN customers aren’t actually distributing their code out to the ADN servers, but only making use of Akamai’s overlay network to route their traffic. Relatively small optimisations to the transport network can have significant benefits in business terms even before app servers are physically forward-deployed.

Other industry developments to watch

There are some shifts underway in the CDN landscape. Notably, as we mentioned earlier, there are rumours that Limelight Networks wants to exit the packet-pushing element of it in favour of the media services side – ingestion, transcoding, reporting and analytics. The most likely route is probably a sale or joint venture with Level(3). Their massive network footprint gives them both the opportunity to do global CDNing, and also very good reasons to do so internally. Being a late entrant, they have been very aggressive on price in building up a customer base (you may remember their role in the great Comcast peering war). They will be a formidable competitor and will probably want to move from macro-CDN to a more Akamai-like forward deployed model.

To read the note in full, including the following additional analysis…

  • Akamai’s technology strategy for a global CDN
  • Can Telcos compete with CDN Players?
  • Potential Telco Leverage Points
  • Global vs. local CDN strategies
  • The ‘fat head’ of content is local
  • The challenges of scale and experience
  • Strategic Options for Telcos
  • Cooperating with Akamai
  • Partnering with a Vendor Network
  • Part of the global IT operation?
  • National-TV-centred CDNs
  • A specialist, wholesale CDN role for challengers?
  • Federated CDN
  • Conclusion

…and the following charts…

  • Figure 1: With higher speeds, geography starts to dominate download times
  • Figure 2: Akamai’s network architecture
  • Figure 3: Architectural options for CDN in 3GPP networks
  • Figure 4: Mapping CDN strategic options

Members of the Telco 2.0 Executive Briefing Subscription Service and Future Networks Stream can download the full 19 page report in PDF format here. Non-Members, please subscribe here, buy a Single User license for this report online here for £795 (+VAT), or for multi-user licenses or other enquiries, please email contact@telco2.net / call +44 (0) 207 247 5003.

Organisations, people and products referenced: 3UK, Akamai, Alcatel-Lucent, Amazon, Arbor Networks, BBC, BBC iPlayer, BitTorrent, BT, Cisco, Dan Rayburn, EC2, EdgeCast, Ericsson, Google, GSM, Internet HSPA, Jetstream, Level(3), Limelight Networks, MBNL, Microsoft, Motorola, MOVE, Nokia Siemens Networks, Orange, TalkTalk, Telefonica, T-Mobile, Velocix, YouTube.

Technologies and industry terms referenced: 3GPP, ADSL, App Engine, backhaul, Carrier-Ethernet, Content Delivery Networks (CDNs), DNS, DOCSIS 3, edge computing, FTTx, GGSN, Gi interface, HFC, HSPA+, interconnect, IT, JavaScript, latency, LTE, Mobile CDNs, online, peering, POPs (Points of Presence), RNC, SQL, UMTS, VPN, WLAN.

Broadband 2.0: Mobile CDNs and video distribution

Summary: Content Delivery Networks (CDNs) are becoming familiar in the fixed broadband world as a means to improve the experience and reduce the costs of delivering bulky data like online video to end-users. Is there now a compelling need for their mobile equivalents, and if so, should operators partner with existing players or build / buy their own? (August 2011, Executive Briefing Service, Future of the Networks Stream).
Telco 2.0 Mobile CDN Schematic Small
  Read in Full (Members only)    Buy This Report    To Subscribe

Below is an extract from this 25 page Telco 2.0 Report that can be downloaded in full in PDF format by members of the Telco 2.0 Executive Briefing service and Future Networks Stream here. Non-members can buy a Single User license for this report online here for £595 (+VAT) or subscribe here. For multiple user licenses, or to find out about interactive strategy workshops on this topic, please email contact@telco2.net or call +44 (0) 207 247 5003.

To share this article easily, please click:

//

Introduction

As is widely documented, mobile networks are witnessing huge growth in the volumes of 3G/4G data traffic, primarily from laptops, smartphones and tablets. While Telco 2.0 is wary of some of the headline shock-statistics about forecast “exponential” growth, or “data tsunamis” driven by ravenous consumption of video applications, there is certainly a fast-growing appetite for use of mobile broadband.

That said, many of the actual problems of congestion today can be pinpointed either to a handful of busy cells at peak hour – or, often, the inability of the network to deal with the signalling load from chatty applications or “aggressive” devices, rather than the “tonnage” of traffic. Another large trend in mobile data is the use of transient, individual-centric flows from specific apps or communications tools such as social networking and messaging.

But “tonnage” is not completely irrelevant. Despite the diversity, there is still an inexorable rise in the use of mobile devices for “big chunks” of data, especially the special class of software commonly known as “content” – typically popular/curated standalone video clips or programmes, or streamed music. Images (especially those in web pages) and application files such as software updates fit into a similar group – sizeable lumps of data downloaded by many individuals across the operator’s network.

This one-to-many nature of most types of bulk content highlights inefficiencies in the way mobile networks operate. The same data chunks are downloaded time and again by users, typically going all the way from the public Internet, through the operator’s core network, eventually to the end user. Everyone loses in this scenario – the content publisher needs huge servers to dish up each download individually. The operator has to deal with transport and backhaul load from repeatedly sending the same content across its network (and IP transit from shipping it in from outside, especially over international links). Finally, the user has to deal with all the unpredictability and performance compromises involved in accessing the traffic across multiple intervening points – and ends up paying extra to support the operator’s heavier cost base.

In the fixed broadband world, many content companies have availed themselves of a group of specialist intermediaries called CDNs (content delivery networks). These firms on-board large volumes of the most important content served across the Internet, before dropping it “locally” as near to the end user as possible – if possible, served up from cached (pre-saved) copies. Often, the CDN operating companies have struck deals with the end-user facing ISPs, which have often been keen to host their servers in-house, as they have been able to reduce their IP interconnection costs and deliver better user experience to their customers.

In the mobile industry, the use of CDNs is much less mature. Until relatively recently, the overall volumes of data didn’t really move the needle from the point of view of content firms, while operators’ radio-centric cost bases were also relatively immune from those issues as well. Optimising the “middle mile” for mobile data transport efficiency seemed far less of a concern than getting networks built out and handsets and apps perfected, or setting up policy and charging systems to parcel up broadband into tiered plans. Arguably, better-flowing data paths and video streams would only load the radio more heavily, just at a time when operators were having to compress video to limit congestion.

This is now changing significantly. With the rise in smartphone usage – and the expectations around tablets – Internet-based CDNs are pushing much more heavily to have their servers placed inside mobile networks. This is leading to a certain amount of introspection among the operators – do they really want to have Internet companies’ infrastructure inside their own networks, or could this be seen more as a Trojan Horse of some sort, simply accelerating the shift of content sales and delivery towards OTT-style models? Might it not be easier for operators to build internal CDN-type functions instead?

Some of the earlier approaches to video traffic management – especially so-called “optimisation” without the content companies’ permission of involvement – are becoming trickier with new video formats and more scrutiny from a Net Neutrality standpoint. But CDNs by definition involve the publishers, so potentially any necessary compression or other processing can be collaboratively, rather than “transparently” without cooperation or willingness.

At the same time, many of the operators’ usual vendors are seeing this transition point as a chance to differentiate their new IP core network offerings, typically combining CDN capability into their routing/switching platforms, often alongside the optimisation functions as well. In common with other recent innovations from network equipment suppliers, there is a dangled promise of Telco 2.0-style revenues that could be derived from “upstream” players. In this case, there is a bit more easily-proved potential, since this would involve direct substitution of the existing revenues already derived from content companies, by the Internet CDN players such as Akamai and Limelight. This also holds the possibility of setting up a two-sided, content-charging business model that fits OK with rules on Net Neutrality – there are few complaints about existing CDNs except from ultra-purist Neutralists.

On the other hand, telco-owned CDNs have existed in the fixed broadband world for some time, with largely indifferent levels of success and adoption. There needs to be a very good reason for content companies to choose to deal with multiple national telcos, rather than simply take the easy route and choose a single global CDN provider.

So, the big question for telcos around CDNs at the moment is “should I build my own, or should I just permit Akamai and others to continue deploying servers into my network?” Linked to that question is what type of CDN operation an operator might choose to run in-house.

There are four main reasons why a mobile operator might want to build its own CDN:

  • To lower costs of network operation or upgrade, especially in radio network and backhaul, but also through the core and in IP transit.
  • To improve the user experience of video, web or applications, either in terms of data throughput or latency.
  • To derive incremental revenue from content or application providers.
  • For wider strategic or philosophical reasons about “keeping control over the content/apps value chain”

This Analyst Note explores these issues in more details, first giving some relevant contextual information on how CDNs work, especially in mobile.

What is a CDN?

The traditional model for Internet-based content access is straightforward – the user’s browser requests a piece of data (image, video, file or whatever) from a server, which then sends it back across the network, via a series of “hops” between different network nodes. The content typically crosses the boundaries between multiple service providers’ domains, before finally arriving at the user’s access provider’s network, flowing down over the fixed or mobile “last mile” to their device. In a mobile network, that also typically involves transiting the operator’s core network first, which has a variety of infrastructure (network elements) to control and charge for it.

A Content Delivery Network (CDN) is a system for serving Internet content from servers which are located “closer” to the end user either physically, or in terms of the network topology (number of hops). This can result in faster response times, higher overall performance, and potentially lower costs to all concerned.

In most cases in the past, CDNs have been run by specialist third-party providers, such as Akamai and Limelight. This document also considers the role of telcos running their own “on-net” CDNs.

CDNs can be thought of as analogous to the distribution of bulky physical goods – it would be inefficient for a manufacturer to ship all products to customers individually from a single huge central warehouse. Instead, it will set up regional logistics centres that can be more responsive – and, if appropriate, tailor the products or packaging to the needs of specific local markets.

As an example, there might be a million requests for a particular video stream from the BBC. Without using a CDN, the BBC would have to provide sufficient server capacity and bandwidth to handle them all. The company’s immediate downstream ISPs would have to carry this traffic to the Internet backbone, the backbone itself has to carry it, and finally the requesters’ ISPs’ access networks have to deliver it to the end-points. From a media-industry viewpoint, the source network (in this case the BBC) is generally called the “content network” or “hosting network”; the destination is termed an “eyeball network”.

In a CDN scenario, all the data for the video stream has to be transferred across the Internet just once for each participating network, when it is deployed to the downstream CDN servers and stored. After this point, it is only carried over the user-facing eyeball networks, not any others via the public Internet. This also means that the CDN servers may be located strategically within the eyeball networks, in order to use its resources more efficiently. For example, the eyeball network could place the CDN server on the downstream side of its most expensive link, so as to avoid carrying the video over it multiple times. In a mobile context, CDN servers could be used to avoid pushing large volumes of data through expensive core-network nodes repeatedly.

When the video or other content is loaded into the CDN, other optimisations such as compression or transcoding into other formats can be applied if desired. There may also be various treatments relating to new forms of delivery such as HTTP streaming, where the video is broken up into “chunks” with several different sizes/resolutions. Collectively, these upfront processes are called “ingestion”.

Figure 1 – Content delivery with and without a CDN

Mobile CDN Schematic, Fig 1 Telco 2.0 Report

Source: STL Partners / Telco 2.0

Value-added CDN services

It is important to recognise that the fixed-centric CDN business has increased massively in richness and competition over time. Although some of the players have very clever architectures and IPR in the forms of their algorithms and software techniques, the flexibility of modern IP networks has tended to erode away some of the early advantages and margins. Shipping large volumes of content is now starting to become secondary to the provision of associated value-added functions and capabilities around that data. Additional services include:

  • Analytics and reporting
  • Advert insertion
  • Content ingestion and management
  • Application acceleration
  • Website security management
  • Software delivery
  • Consulting and professional services

It is no coincidence that the market leader, Akamai, now refers to itself as “provider of cloud optimisation services” in its financial statements, rather than a CDN, with its business being driven by “trends in cloud computing, Internet security, mobile connectivity, and the proliferation of online video”. In particular, it has started refocusing away from dealing with “video tonnage”, and towards application acceleration – for example, speeding up the load times of e-commerce sites, which has a measurable impact on abandonment of purchasing visits. Akamai’s total revenues in 2010 were around $1bn, less than half of which came from “media and entertainment” – the traditional “content industries”. Its H1 2011 revenues were relatively disappointing, with growth coming from non-traditional markets such as enterprise and high-tech (eg software update delivery) rather than media.

This is a critically important consideration for operators that are looking to CDNs to provide them with sizeable uplifts in revenue from upstream customers. Telcos – especially in mobile – will need to invest in various additional capabilities as well as the “headline” video traffic management aspects of the system. They will need to optimise for network latency as well as throughput, for example – which will probably not have the cost-saving impacts expected from managing “data tonnage” more effectively.

Although in theory telcos’ other assets should help – for example mapping download analytics to more generalised customer data – this is likely to involve extra complexity with the IT side of the business. There will also be additional efforts around sales and marketing that go significantly beyond most mobile operators’ normal footprint into B2B business areas. There is also a risk that an analysis of bottlenecks for application delivery / acceleration ends up simply pointing the finger of blame at the network’s inadequacies in terms of coverage. Improving delivery speed, cost or latency is only valuable to an upstream customer if there is a reasonable likelihood of the end-user actually having connectivity in the first place.

Figure 2: Value-added CDN capabilities

Mobile CDN Schematic - Functionality Chart - Telco 2.0 Report

Source: Alcatel-Lucent

Application acceleration

An increasingly important aspect of CDNs is their move beyond content/media distribution into a much wider area of “acceleration” and “cloud enablement”. As well as delivering large pieces of data efficiently (e.g. video), there is arguably more tangible value in delivering small pieces of data fast.

There are various manifestations of this, but a couple of good examples illustrate the general principles:

  • Many web transactions are abandoned because websites (or apps) seem “slow”. Few people would trust an airline’s e-commerce site, or a bank’s online interface, if they’ve had to wait impatiently for images and page elements to load, perhaps repeatedly hitting “refresh” on their browsers. Abandoned transactions can be directly linked to slow or unreliable response times – typically a function of congestion either at the server or various mid-way points in the connection. CDN-style hosting can accelerate the service measurably, leading to increased customer satisfaction and lower levels of abandonment.
  • Enterprise adoption of cloud computing is becoming exceptionally important, with both cost savings and performance enhancements promised by vendors. Sometimes, such platforms will involve hybrid clouds – a mixture of private (Internal) and public (Internet) resources and connectivity. Where corporates are reliant on public Internet connectivity, they may well want to ensure as fast and reliable service as possible, especially in terms of round-trip latency. Many IT applications are designed to be run on ultra-fast company private networks, with a lot of “hand-shaking” between the user’s PC and the server. This process is very latency-dependent, and especially as companies also mobilise their applications the additional overhead time in cellular networks may otherwise cause significant problems.

Hosting applications at CDN-type cloud acceleration providers achieves much the same effect as for video – they can bring the application “closer”, with fewer hops between the origin server and the consumer. Additionally, the CDN is well-placed to offer additional value-adds such as firewalling and protection against denial-of-service attacks.

To read the 25 note in full, including the following additional content…

  • How do CDNs fit with mobile networks?
  • Internet CDNs vs. operator CDNs
  • Why use an operator CDN?
  • Should delivery mean delivery?
  • Lessons from fixed operator CDNs
  • Mobile video: CDNs, offload & optimisation
  • CDNs, optimisation, proxies and DPI
  • The role of OVPs
  • Implementation and planning issues
  • Conclusion & recommendations

… and the following additional charts…

  • Figure 3 – Potential locations for CDN caches and nodes
  • Figure 4 – Distributed on-net CDNs can offer significant data transport savings
  • Figure 5 – The role of OVPs for different types of CDN player
  • Figure 6 – Summary of Risk / Benefits of Centralised vs. Distributed and ‘Off Net’ vs. ‘On-Net’ CDN Strategies

……Members of the Telco 2.0 Executive Briefing Subscription Service and Future Networks Stream can download the full 25 page report in PDF format here. Non-Members, please see here for how to subscribe, here to buy a single user license for £595 (+VAT), or for multi-user licenses and any other enquiries please email contact@telco2.net or call +44 (0) 207 247 5003.

Organisations and products referenced: 3GPP, Acision, Akamai, Alcatel-Lucent, Allot, Amazon Cloudfront, Apple’s Time Capsule, BBC, BrightCove, BT, Bytemobile, Cisco, Ericsson, Flash Networks, Huawei, iCloud, ISPs, iTunes, Juniper, Limelight, Netflix, Nokia Siemens Networks, Ooyala, OpenWave, Ortiva, Skype, smartphone, Stoke, tablets, TiVo, Vantrix, Velocix, Wholesale Content Connect, Yospace, YouTube.

Technologies and industry terms referenced: acceleration, advertising, APIs, backhaul, caching, CDN, cloud, distributed caches, DNS, Evolved Packet Core, eyeball network, femtocell, fixed broadband, GGSNs, HLS, HTTP streaming, ingestion, IP network, IPR, laptops, LIPA, LTE, macro-CDN, micro-CDN, middle mile, mobile, Net Neutrality, offload, optimisation, OTT, OVP, peering proxy, QoE, QoS, RNCs, SIPTO, video, video traffic management, WiFi, wireless.

Mobile Broadband Economics: LTE ‘Not Enough’

Summary: Innovation appears to be flourishing in the delivery of mobile broadband. We saw applications that allow users to monitor and control their network usage and services, ‘dynamic pricing’, and other innovative pricing strategies at the EMEA Executive Brainstorm. Despite growing enthusiasm for LTE, delegates considered offloading traffic and network sharing at least as important commercial strategies for managing costs.

Members of the Telco 2.0 Subscrioption Service and Future Networks Stream can download a more comprehensive version of this report in PDF format here. Please email contact@telco2.net or call +44 (0) 207 247 5003 to contact Telco 2.0 or STL Partners for more details.

To share this article easily, please click:

//

Introduction

STL Partners’ New Digital Economics Executive Brainstorm & Developer Forum EMEA took place from 11-13 May in London. The event brought together 250 execs from across the telecoms, media and technology sectors to take part in 6 co-located interactive events: the Telco 2.0, Digital Entertainment 2.0, Mobile Apps 2.0, M2M 2.0 and Personal Data 2.0 Executive Brainstorms, and an evening AppCircus developer forum.

Building on output from the last Telco 2.0 events and new analysis from the Telco 2.0 Initiative – including the new strategy report ‘The Roadmap to New Telco 2.0 Business Models’ – the Telco 2.0 Executive Brainstorm explored latest thinking and practice in growing the value of telecoms in the evolving digital economy.

This document gives an overview of the output from the Mobile Broadband Economics session of the  Telco 2.0 stream.

Putting users in control

A key theme of the presentations in this session was putting users in more control of their mobile broadband service, by helping them to both understand what data they have used in an interactive environment, and giving them the option to choose to buy additional data capabilities on-demand when they need and can use it.

Delegates perceptions that key obstacles to building revenue were internal industry issues, and key cost issues involve better collaboration rather than technology (specifically, LTE) were both refreshing and surprising.

Ericsson presented a mobile Broadband Data ‘Fuel gauge’ app to show how users could be better informed of their usage and be interactively offered pricing and service offers.

Figure 1 – Ericsson’s Mobile Broadband ‘Fuel Gauge’

Telco 2.0 - Mobile Broadband Fuel Gauge

Source: Ericsson, 13th Telco 2.0 Executive Brainstorm, London, May 2011

Deutsche Telekom showed its new ‘self-care’ customer app, complete with WiFi finder, Facebook integration, and ad-funding options, and how they are changing from a focus on complex tariffs to essentially Small/Medium/Large options, with tiers of speed, caps, WiFi access, and varying levels of added-on bundled services.

While we admired the apparent simplicity of the UI design of many of the elements of the services shown, we retain doubts on the proposed use of RCS and various other operator-only “enablers”, and will be further examining the pros and cons of RCS in future analysis.

New pricing approaches

In addition to Ericsson’s concept of dynamic pricing, making offers to customers at times of most need and suitability, Openwave showed numerous innovative new approaches to charging by application, time/day, user group and event (e.g. ‘Movie Pass’), segmentation of plans by user type, and how to use data plan sales to sell other services.

Figure 2 – Innovative Mobile Broadband Offers

Telco 2.0 - Mobile Broadband Pricing Options

Source: Openwave, 13th Telco 2.0 Executive Brainstorm, London, May 2011

No single ‘Killer’ obstacle to growth – but lots of challenges

Delegates voted on the obstacles to mobile broadband revenues and the impact of various measures on the control of costs.

Figure 3 – Obstacles to growing Mobile Broadband Revenues

Telco 2.0 - Mobile Broadband Revenue Obstacles

Source: Delegate Vote, 13th Telco 2.0 Executive Brainstorm, London, May 2011

Our take on these results is that:

  • Overall, there appears to be no single ‘killer obstacle’ to growth;
  • Net Neutrality is increasingly seen as a lesser issue in EMEA, certainly than in the US;
  • Whilst securing the largest number of ’major issue’ votes, we are not certain that all delegates fully know the views, needs, expectations and knowledge of upstream customers, and although their expectations are seen as an issue, it does not particularly appear more challenging than organisational or technical ones;
  • Manageable technical and organisational issues (e.g. integration, organisational complexity) appear a bigger obstacle than unmanageable ones (e.g. inability to control devices), although;
  • Implementation issues vary by operator, as can be seen by the relatively large proportions who either do not see integration as an issue at all or see it as a major issue.

Managing Costs: Network Sharing, Offloads as important as LTE 

Figure 4 – Impact of Mobile Broadband Cost Reduction Strategies

Telco 2.0 - Mobile Broadband Cost Strategies

Source: Delegate Vote, 13th Telco 2.0 Executive Brainstorm, London, May 2011

Our take on these results is that the approaches fall into three groups:

  • Strategic, long-term solutions including network sharing, LTE and offloading;
  • Strategies with a potentially important but more moderate impact including pricing, network outsourcing, and video traffic optimisation;
  • And lower impact initiatives such as refreshing the 3G network.

It is interesting that network sharing deals were seen as a more strategic solution to long term cost issues than migration to LTE, although there is logic to this at the current stage of market development with the capital investments and longer time required to build out LTE networks. Similarly, data offload is currently an important cost management strategy.

We found it particularly interesting that network sharing (collaboration) deals are seen as significantly more effective than network outsourcing deals, and will be exploring this further in future analysis.

Next Steps

  • Further research and analysis in this area, including a report on the pros and cons of ‘Under the Floor’ (outsourced network) strategies.
  • More detailed Mobile Broadband sessions at upcoming Telco 2.0 Executive Brainstorms.


Public Wifi: Destroying LTE/Mobile Value?

Summary: By building or acquiring Public WiFi networks for tens of $Ms, highly innovative fixed players in the UK are stealthily removing $Bns of value from 3G and 4G mobile spectrum as smartphone and other data devices become increasingly carrier agnostic. What are the lessons globally?

Below is an extract from this 15 page Telco 2.0 Analyst Note that can be downloaded in full in PDF format by members of the Telco 2.0 Executive Briefing service and Future Networks Stream using the links below.

Read in Full (Members only)        To Subscribe

The mobile broadband landscape is a key session theme at our upcoming ‘New Digital Economics’ Brainstorm (London, 11-13 May). Please use the links or email contact@telco2.net or call +44 (0) 207 247 5003 to find out more.

To share this article easily, please click:

//

Two recent announcements have reignited interest in the UK Public WiFi space: Sky buying The Cloud for a reputed figure just short of £50m and Virgin Media announcing their intention to invest in building a metro WiFi network based around their significant outdoor real estate in the major conurbations.

These can be seen narrowly as competitive reactions to the success of the BT Openzone public WiFi product, which is a clear differentiator for the BT home broadband offer in the eyes of the consumer. The recent resurgence of BT market share in the home broadband market hints that public WiFi is an ingredient valued by consumers, especially when the price is bundled into the home access charges and therefore perceived as “free” by the consumer.

This trend is being accelerated by the new generation of Smartphones sensing whether private and public WiFi access or mobile operator network access offer the best connection for the end-user and then making the authentication process much easier. Furthermore, the case of the mobile operators is not helped by laptops and more importantly tablets and other connected devices such as e-readers offering WiFi as a default means of access with mobile operator 3G requiring extra investment in both equipment and access with a clumsy means of authentication.

In a wider context, the phenomena should be extremely concerning for the UK mobile operators. There has been a two decade trend of voice traffic inside the home moving from fixed to mobile networks with a clear revenue gain for the mobile operators. In the data world, it appears that the bulk of the heavy lifting appears to being served within the home by private WiFi and outside of the home in nomadic spots served by public WiFi.

With most of the public WiFi hotspots in the UK being offered by fixed operators, there is a potential value shift from mobile to fixed networks reversing that two decade trend. As the hotspots grow and critically, once they become interconnected, there is an increasing risk to mobile operators in terms of the value of investment in expensive ‘4G’ / LTE spectrum.

Beyond this, a major problem for mobile operators is that the current trend for multi-mode networking (i.e. combination of WiFi and 3G access) limits the ability of operators to provide VAS services and/or capture 2-sided business model revenues, since so much activity is off-network and outside of the operator’s control plane.

The history of WiFi presents reality lessons for Mobile Operators, namely:

  • With Innovation, it not always the innovators who gain the most;
  • Similarly, with Standards setting, it not always the people who set the standards who gain the most; and
  • WiFi is a classic case of Apple driving mass adoption and reaping the benefits – to this day, Apple still seems to prefer WiFi over 3G.

This analyst note explains the flurry of recent announcements in the context of:

  • The unique UK market structure;
  • Technology Adoption Cycles;
  • How intelligence at the edge of the network will drive both private and public WiFi use;
  • How public WiFi in the UK might evolve;
  • The longer term value threat to the mobile operators;
  • How O2 and Vodafone are taking different strategies to fight back; and
  • Lessons for other markets.

Unique Nature of the UK Market Structure

In May 2002, BT Cellnet, the mobile arm of BT, soon to be renamed O2, demerged from BT leaving the UK market as one of few markets in the world where the incumbent PTT did not have a mobile arm. Ever since BT has tried to get into the mobility game with varying degrees of success:

  • In the summer of 2002, it launched its public WiFi service called OpenZone;
  • In September 2003 it announced plans for WiFi in all public phone boxes ;
  • In May 2004, it launched an MVNO with Vodafone with plans for the doomed BT Fusion UMA (Bluetooth then WiFi ) phone;
  • In May 2006, with Metro WiFi plans in partnership with local authorities in 12 cities; and
  • In Oct 2007, in partnership with FON to put public WiFi in each and every BT home routers.

After trying out different angles in the mobility business for five years, BT finally discovered a workable business model with public WiFi around the FON partnership. BT now effectively bundle free public WiFi to its broadband users in return for establishing a public hotspot within their own home.

Huge Growth in UK Public Wifi Usage

Approximately 2.6m or 47% customers of a total of 5.5m BT broadband connections have taken this option. This creates the image of huge public WiFi coverage and clearly currently differentiates BT from other home broadband providers. And, the public WiFi network is being used much more: 881 million minutes in the current quarter compared to 335 million minutes in the previous year.

The other significant element of the BT public WiFi network is the public hotspots they have built with hotels, restaurants, airports. The hotspots number around 5k, of which 1.2k are wholesale arrangements with other public WiFi hotspot providers. While not significant in number, these provide the real incremental value to the BT home broadband user who can connect for “free” in these high traffic locations.

BT was not alone in trying to build a public WiFi business. The Cloud was launched in the UK in 2003 and tried to build a more traditional public WiFi business building upon a combination of direct end user revenues and wholesale and interconnect arrangements. That Sky are paying “south of £50m” for The Cloud compared to the “€50m invested” over the years by the VC backers implies the traditional public WiFi business model just doesn’t work. A different strategy will be taken by Sky going forward.

Sky is the largest pay-tv provider in the UK currently serving approximately 10m homes by satellite DTH. In 2005, Sky decided upon a change of strategy and decided that in addition to offering its customers video services, they needed to offer broadband and phone services. Sky has subsequently invested approximately £1bn in buying an altnet, Easynet, for £211m, in building a LLU network on top of BT infrastructure and acquiring 3m broadband customers. If the past is anything to go by, Sky will be planning on investing considerable further sums in The Cloud to make it at a minimum a comparable service to BT Openzone for its customers.

Virgin Media is the only cable operator of any significance in the UK with a footprint of around 50% of the UK mainly in the dense conurbations. Virgin Media is the child of many years of cable consolidation and historically suffered from disparate metro cable networks of varying quality and an overleveraged balance sheet. The present management has a done a good job of tidying up the mess and upgrading the networks to DOCSIS 3.0 technology. In the last year, Virgin Media has started to expand its footprint again and investing in new products with plans for building a metro WiFi network based around its large footprint of cabinets in the street.

Virgin Media has a large base of 4.3m home broadband users to protect and an even larger base of potential homes to sell services into. In addition, Virgin Media is the largest MVNO in the UK with around 3m mobile subscribers. In recent years, Virgin Media have focused upon selling mobile services into their current cable customers. Although, Virgin Media’s public WiFi strategy is not in the public domain, it is clear that they plan on investing in 2011.

TalkTalk is the only other significant UK Home Broadband player with 4.2m home broadband users and currently has no declared public WiFi strategies.

The mobile operators which have invested in broadband, namely O2 and Orange, have failed to gain traction in the marketplace.

The key trend here is that the fixed broadband network providers are moving outside of the home and providing more value to their customers on the move.

Technology Adoption Cycles

Figure 1: Geoffrey Moore’s Technology Adoption Cycle

Geoffrey Moore documented technology adoption cycles, originally in the “Crossing the Chasm” book and subsequently in the “Living in the Fault Line” book. These books described the pain in products crossing over from early adopters to the mass market. Since publication, they have established themselves as the bible for a generation of Technology marketers. Moore distinguishes six zones, which are adopted to describe the situation of public WiFi in the UK.

  1. The early market: a time of great excitement when visionaries are looking to get on board. In the public WiFi market this period was clearly established in mid-2005 era when public WiFi networks where promoted as real alternatives to private MNOs.
  2. The chasm: a time of great despair as initial interest wanes and the mainstream is not comfortable with adoption. The UK WiFi market has been stagnating for the previous few years as investment in public WiFi has declined and customer adoption has not accelerated beyond the techno-savvy.
  3. The bowling alley: a period of niche adoption ahead of the general marketplace. The UK market is currently in this period. The two key skittles to fall were the BT FON deal changing the public WiFi business model, and the launch of the iPhone with auto-sensing and easy authentication of public WiFi.
  4. The tornado: a period of mass-market adoption. The UK market is about to enter in this phase as public WiFi investment is reinvigorated deploying providing “bundled” access to most home broadband users.
  5. Main street: Base infrastructure has been deployed and the goal is to flesh out the potential. We are probably a few years away from this and this phase will focus on ease-of-use, interconnect of public WiFi networks, consolidation of smaller players and alternate revenue sources such as advertising.
  6. Total Assimilation: Everyone is using the technology and the market is ripe for another wave of disruption. For UK WiFi, this is probably at least a decade away, but who know what the future holds?

Flashback: How Private WiFi crossed the Chasm

It is worthwhile at this point to revisit the history of WiFi as it provides some perspective and pointers for the future, especially who the winners and losers will be in the public WiFi space.

Back in 1985 when deregulation was still in fashion, the USA FCC opened up some spectrum to provide an innovation spurt to US industry under a license exempt and “free-to-use” regime. This was remarkable in itself given that previously spectrum, whether for radio and television broadcasting or public and private communications, had been exclusively licensed. Any applications in the so-called ISM (Industrial, Scientific and Medical) bands would have to deal with contention from other applications using the spectrum and therefore the primary use was seen as indoor and corporate applications.

Retail department stores, one of the main clients of NCR (National Cash Registers), tended to reconfigure their floor space on a regular basis and the cost of continual rewiring of point-of-sales equipment was a significant expense. NCR saw an opportunity to use the ISM bands to solve this problem and started a R&D project in the Netherlands to create wireless local area networks which required no cabling.

At this time, the IEEE were leading the standardization effort for local area networks and the 802.3 Ethernet specification initially approved in 1987 still forms the basis of the most wired LAN implementations today. NCR decided that the standards road was the route to take and played a leading role in the eventual creation of 802.11 wireless LAN standards in 1997. Wireless LAN was considered too much of a mouthful and was reinvented as WiFi in 1999 with the help of a branding agency.

Ahead of the standards approval, NCR launched products under the WaveLAN brand in 1990 but the cost of the plug-in cards at US$1,400 were very expensive compared to the wired ethernet cards which were priced at around US$400. Product take-up was slow outside of early adopters.

In 1991 an early form of Telco-IT convergence emerged as AT&T bought NCR. An early competitor for the ISM bandwidth emerged with AT&T developing a new generation of digital cordless phones using the 2.4GHz band. To this day, in the majority of UK and worldwide households, DECT handsets in the home compete with WiFi for spectrum. Product development of the cards continued and was made consumer friendly easier with the adoption on the PCMIA card slots in PCs.

By 1997, WiFi technology was firmly stuck in the chasm. The major card vendors (Proxim, Aironet, Xircom and AT&T) all had non-standardized products and the vendors were at best marginally profitable struggling to grow the market.
AT&T had broken up and the WiFi business became part of Lucent Technologies. The eyes and brains of the big communications companies (Alcatel, Ericsson, Lucent, Motorola, Nokia, Nortel and Siemens) were focused on network solutions with 3G holding the promise for the future.

All that was about to change in early 1998 with a meeting between Steve Jobs of Apple and Richard McGinn, CEO of Lucent:

  • Steve Jobs declared “Wireless LANs are the greatest thing on earth, Apple wants a radio card for US$50, which Apple will retail at US$99”;
  • Rich McGinn declared 1999 to be the year of DSL and asked if Apple would be ready; and
  • Steve Jobs retort was revealing to this day “Probably not next, maybe the year after; depends upon whether there is one standard worldwide”.

Figure 2: The Apple Airport

In early 1998 the cost of the cards was still above US$100 and needed a new generation of chips to bring the cost down to the Apple price point. Further, Apple wanted to use the 11Mbit/s standard which had just been developed rather than the current 2Mbit/s. However, despite the challenges the product was launched in July 1999 as the Apple Airport with the PCMCIA card at US$99 and the access point at US$299. Apple was the first skittle to fall as private WiFi crossed the chasm. The Windows based OEMs rushed to follow.

By 2001, Lucent had spun out its chip making arm as Agere Systems which had a market share of 50% of a US$1bn WiFi market, which would have been nothing but a pin prick on either the AT&T or Lucent profit and loss had Agere remained as part of them.

The final piece in the WiFi jigsaw fell into place when Intel acquired Xircom in 1999 and developed the Xircom technology and used their WiFi patents as protection against competitors. In 2003, Intel launched its Centrino chipset with built in WiFi functionality for laptops supported by a US$300m worldwide marketing campaign. Effectively for the consumer WiFi had become part the laptop bundle.

Agere Systems and all its WiFi heritage was finished and they discontinued its WiFi activities in 2004.

There are three clear pointers for the future:

  • The players who take a leading role in the early market will not necessary be the ones to succeed in Main Street;
  • Apple took a leading role in the adoption of WiFi and still seems massively committed to WiFi technology to this day;
  • Technology adoption cycles tend to be longer than expected.

Intelligence at the edge of the Network

As early as 2003, Broadcom and Phillips were launching specialized WiFi chips aimed at mobile phones. Several cellular handsets were launched with WiFi combined with 2G/3G connectivity, but the connectivity software was clunky for the user.

The launch of the iPhone in 2007 began a new era where the device automatically attempts to connect to any WiFi network if the signal strength is better than the 2G/3G network. The era of the home or work WiFi network being the preferred route for data traffic was ushered in.

Apple is trying to make authentication as simple as possible: enter the key for any WiFi network once and it will be remembered for the handset’s lifetime and connect automatically when a user returns in range. However, in dense urban networks with multiple WiFi access points, it is quite annoying to be prompted for key after key. The strength of the federated authentication system in cellular networks is therefore still a critical advantage.

The iPhone also senses that some applications can only be used when WiFi connections are available. The classic example is Apple’s own Facetime (video calling) application. Mobile Operators seem happy in the short run that bandwidth intensive applications are kept off their networks. But, there is a longer term value statement with the users being continually being reminded that WiFi networks are superior to mobile operators’ networks.

Other mobile operating systems, such as Android and Windows Phone 7, have copied the Apple approach and today there is no going back: multi-modal mobile phones are here to stay and the devices themselves decide which network to use unless the user over-rides this choice.

One of underlying rules of the internet is that intelligence moves to the edge of the network. The edges are probably in the eyes of Apple and Google the handsets and their server farms. It is not beyond the realms of possibility that future Smartphones will be supplied with automatic authentication for both WiFi and Cellular networks with least-cost routing software determining the best price for the user. As intelligence moves to the edge so does value.

Public WiFi Hotspots – the Business Model challenges

The JiWire directory estimates that there are c. 414k public WiFi locations across the globe at the end of 2010, and there are WiFi hotspots currently located 26.5k in the UK. Across the globe, there is a shift from a paid-for model to a free-model with the USA being top of the free chart with 54% of public WiFi locations being free.

For a café chain offering free access to WiFi is a good model to follow. The theory is that people will make extra visits to buy a coffee just to check their email or some other light internet visit. Starbucks started the trend by offering free WiFi access, all the rest felt compelled to follow. Nowadays, all the major chains whether Costa Coffee, Café Nero and even McDonalds offer free WiFi access provided by either BT Openzone or Sky’s The Cloud. A partnership with a public WiFi provider is perfect as the café chain doesn’t have to provide complicated networking support or regulatory compliance. The costs for the public WiFi provider are relativity small especially if they are amortized across a large base of broadband users.

For hotels and resorts, the business case is more difficult as most hotels are quite large and multiple access points are required to provide decent coverage to all rooms. Furthermore, hotels traditionally have made additional revenues from most services and therefore complexity is added with billing systems. For most hotels and resorts a revenue share agreement is negotiated with the WiFi service provider.

For public places, such as airports and train stations, the business case is also complicated by the owners knowing these sites are high in footfall and therefore demand a premium for any activity whether retail or service based. It is a similar problem that mobile operators face when trying to provide coverage in major locations: access to prime locations is expensive. In the UK, the entry of Sky into the public WiFi and its long association with Sports brings an intriguing possible partnership with the UK’s major venues.

These three types of locations currently account for 75% of current public WiFi usage according to JiWire.

To read the rest of the article, including:

  • How will UK Public WiFi Evolve?
  • Challenge to Mobile Operators
  • O2 Tries an Alternative
  • Vodafone Goes with Femtos
  • Lessons for Other Markets

Members of the Telco 2.0TM Executive Briefing Subscription Service and Future Networks Stream can access and download a PDF of the full report here. Non-Members, please see here for how to subscribe. Alternatively, please email contact@telco2.net or call +44 (0) 207 247 5003 for further details. ‘Growing the Mobile Internet’ and ‘Lessons from Apple: Fostering vibrant content ecosystems’ are also featured at our AMERICAS and EMEA Executive Brainstorms and Best Practice Live! virtual events.

Net Neutrality 2.0: Don’t Block the Pipe, Lubricate the Market

Summary: ‘Net Neutrality’ has gathered increasing momentum as a market issue, with AT&T, Verizon, major European telcos and Google and others all making their points in advance of the Ofcom, EC, and FCC consultation processes. This is Telco 2.0’s input, analysis and recommendations. (September 2010, Foundation 2.0,, Executive Briefing Service, Future of the Networks Stream).

NB A PDF copy of this 17 page document can be downloaded in full here. We’ll also be discussing this at the Telco 2.0 Executive Brainstorms. Email contact@telco2.net or call +44 (0) 207 247 5003 to find out more.

Overview

In this paper, Telco 2.0 recommends that the appropriate general response to concerns over ‘Net Neutrality’ is to make it easier for customers to understand what they should expect, and what they actually get, from their broadband service, rather than impose strict technical rules or regulation about how ISPs should manage their networks.

In this article we describe in detail why, and provide recommendations for how.

NB We would like to express our thanks to Dean Bubley of Disruptive Analysis, who has worked closely with our team to develop this paper.

Analysis of Net Neutrality Issues

‘Net Neutrality’ = Self-Interest (Poorly Disguised)

‘Net Neutrality’ is an issue manufactured and amplified by lobbyists on the behalf of competing commercial interests. Much of the debate on the issue has become somewhat distracting and artificial as the ‘noise’ of self-interested opinion has become much louder than the ‘signal’ of potential resolutions.

The libertarian ideal that the title implies is a clever piece of PR manipulation of ideas of freedom of access of information, and freedom from interference. For the most part, this is far from the reality of the motives of the players engaged in the debate.

Additionally, the ‘public’ net neutrality debate is being driven by tech-savvy early adopters whose views and ‘use cases’ are not statistically representative of the overall internet population.

This collection of factors has created a strange landscape of idealist and specialised viewpoints congregating around the industry lobbyists’ various positions.

However, behind the scenes, the big commercial players are becoming increasingly tense, and we have recently experienced a marked reluctance from senior telco executives to comment on the issue in public.

Our position is that, beyond the hyperbole, the fair and proper management of contention between Internet Applications and ‘Specialised Services’ is important in the interests of consumers and the potential creation of new business models.

What, exactly, is the ‘problem’ and for whom?

Rapidly increasing use of the Internet and Specialised Services, particularly bandwidth hungry applications like online video, is causing (or, at least, will in theory cause) increasing contention in parts of the network.

The currently expressed primary concerns of net neutrality activists are that some consumers will receive a service whose delivery has been covertly manipulated by an external party, in this case their ISP. Similarly, some application and service providers fear that their services are or will consequently be discriminated against by telcos.

Some telcos think that certain other large and bandwidth-hungry applications are receiving a ‘free ride’ on their networks, and their corporate owners consequently receiving the benefits of expensive network investments without contribution. As a consequence, ISPs argue that they should be entitled to unilaterally constrain certain types of applications unless application providers pay for the additional bandwidth.

It’s a Commercial Issue, not a Moral Issue

One of the areas of obfuscation in the ‘Net Neutrality’ debate is the confusion between two sets of issues in the debate: ‘moral and legal’ and ‘commercial’.

Moral & legal issues include matters such as ‘freedom of expression’ and the right to unfettered internet access, the treatment of pirated content, and censorship of extreme religious or pornographic materials. We regard these as subjects for the law where the service is consumed / produced etc., but that have in some places become entangled in the ‘Net Neutrality’ debate and which should not be its focus.

The commercial issue is whether operators should be regulated in how they prioritise traffic from one commercial application over another without the user’s knowledge.

What causes this problem?

Contention can arise at different points between the service or application and the user, for example:

  • Caused by bulk traffic from users and applications in the ‘core network’ beyond the local exchange, (akin to the general slowing of Internet applications in the evening in Europe due to greater local and U.S. usage at that time);
  • Between applications on a bandwidth restricted local access route (e.g. ADSL over a copper pair, mobile broadband).

As a service may originate from and be delivered to anywhere globally, the first kind of contention can only be truly be managed if there is either a) an Internet-wide standard for prioritising different types of traffic, or b) a specific overlay network for that service which bypasses the internet to a certain ‘outer’ point in the network closer to the consumer such as a local exchange. This latter class of service delivery may be accompanied by a connection between the exchange and the end-user that is not over the internet – and this is the case in most IPTV services.

To alleviate issues of contention, various ‘Traffic Management’ strategies are available to operators, as shown in the following diagram, with increasingly controversial types of intervention to the right.

Figure 1 – Ofcom’s Traffic Management Continuum

Ofcom's Traffic Management Continuum


Source: Ofcom

Is It Really a Problem?

Operators already do apply traffic management techniques, an example of which was given by 3UK’s Director of Network Strategy at the recent Broadband Stakeholder Group (BSG) event in London, who explained that at peak times in the busiest cells, 3 limits SS7 signalling and P2P traffic. He explained that they selected these categories because they are essentially ‘background’ applications that have little impact on the consumer’s experience, and it was important to keep down latency so that more interactive applications like Web browsing functioned well. A major ‘use case’ for 3UK was identifying which cells needed investment.

In 3UK’s case, there was perhaps surprisingly more signalling traffic than there was P2P. Though this is a mobile peculiarity, it illustrates that assumptions about problems in managing traffic management can often be wrong, and it is important that decisions should be taken on the basis of data rather than prejudice.

While there are vociferous campaigners and powerful commercial interests at stake, it is fair to say that the streets are not often full of angry consumers waving banners reading ‘Hands off my YouTube’ and knocking on the doors of telcos’ HQs. While a quick and entirely non-representative survey of Telco 2.0’s non-technical relatives-of-choice revealed complete ignorance and lack of further interest in the subject, this does not necessarily mean that there is not, or could not be, a problem, and it is possible that consumers could unwittingly suffer. On balance though, Telco 2.0 has not yet seen significant evidence of a market failure. We also believe that the mechanisms of the market are the best means of managing potential conflict.

A case of ‘Terminological Inexactitude’

We broadly agree with Alex Blowers of OFCOM, who said that ‘80% of the net neutrality debate is in the definition’ at the recent BSG conference.

First, the term ‘Net Neutrality’ does not actually distinguish which services it refers to – does ‘Net’ mean ‘The Internet’, ‘The Network’, or something else? To most it is taken to mean ‘The Internet’, so what is ‘The Internet’? Despite the initial sense that the answer to this question seems completely obvious, a short conversation within or outside the industry will reveal an enormous range of definitions. The IT Director will give you a different answer from your non-technical relatives and friends.

These ambiguities have the straightforward consequence that the term ‘Net Neutrality’ can be used to mean whatever the user wants, and its use is therefore generally a guarantee for mindless circular arguments and confusion . In other words: perfect conditions for lobbyists with partial views.

For most people, ‘the internet’ is “everything I can get or do when my computer or phone is connected online”. A consumer with such a view probably has a broadband line and an internet service and is among those, in theory at least, most in need of protection from unscrupulous policy management that might favour one form of online traffic over another without their knowledge or control. It is their understanding and expectation of what they have bought against the reality of what they get that we see as the key in this matter.

In this paper, we discuss two classes of services that can be delivered via a broadband access line.

1. Access to ‘The Internet’ (note capitalisation), which means being able to see and interact with the full range of websites, applications and services that are legitimate and publicly available. We set out some guiding principles below on a tighter definition of what services described as ‘The Internet’ should deliver.

2. ‘Specialised Services’ are other services that use a broadband line, that often connect to a device other than a PC (e.g. IPTV via set-top boxes, smart meters, RIM’s Blackberry Exchange Server (BES)) or a service that may be connected to a PC but via a VPN, such as corporate video conferencing, Cloud or Enterprise VOIP solutions.

While ‘Specialised Services’ are not by our definition pure Internet services, they can also have an effect in certain circumstances on the provision of ‘The Internet’ to an end-user where they share parts of the connection that are in contention. Additionally, there can be contention between services on ‘The Internet’ from multiple users or applications connected via a common router.

Additionally, fixed and mobile communications present different contexts for the services, with different potential mechanisms for control and management. Mobile services have the particular difference that, other than signalling, there is no connection between device and the network when data services are not being used.

The Internet: ‘Appellation Controlee’?

One possible mechanism to improve consumer understanding and standards of marketing services is to introduce a framework for defining more tightly services sold as “Internet Access”.
In our view, services sold as ‘The Internet’ should:

  • Provide access to all legitimate online services using the ‘public’ internet;
  • Perform within certain bounds of service performance as marketed (e.g. speed, latency);
  • Be subject to the minimum necessary ‘traffic management’ by the ISP, which should only be permissible in specific instances, such as contention (e.g. peak hour use) ;
  • Aim to maintain consistent delivery of all services in line with reasonable customer expectation and best possible customer experience (as exemplified in a ‘code of best practice’);
  • Provide published and accessible performance measures against ‘best practice’ standards.

Where a customer has paid extra for a Specialised Service, e.g. IPTV, it is reasonable to give that service priority to pre-agreed limits while in use.

The point of defining such an experience would be to give consumers a reference point, or perhaps a ‘Kitemark’, to assure them of the nature of the service they are buying. In instances where the service sold is less than that defined, the service would need to be identified, e.g. a ‘Limited Internet Access Service’.

The Internet isn’t really ‘Neutral’

To understand the limitations and possible advantages of ‘traffic management’, and put this into context, it is worth briefly reviewing some of the other ways in which customer and service experiences vary.

Different Services Work in Different Ways
Many Internet Services use already use complex mechanisms to optimise their delivery to the end-user. For example:

  • Google has built a huge Content Delivery Network, using fibre to speed communications between data centres, dedicated delivery of traffic to international peering points, and equipment at ISPs for expediting caching and content delivery, to ensure that its content is delivered more rapidly to the outer edges of the network;
  • BBC News Player uses an Akamai Content Delivery Network (CDN) similarly;
  • Skype delivers its traffic more effectively by optimising its route through the peer-to-peer network.

Equally, most ISPs are able to ‘tune’ their data services to better match the characteristics of their own network. Although these assets are only available to the services that pay for, own, or create them, none of these techniques actively slows any other service. Indeed, and in theory, by creating or using new non-congested routes, they free capacity for other services so the whole network benefits.

Consumer Experiences are Different too
Today’s consumer experience of ISP services varies widely on local factors. Two neighbours (who happen to be on different nodes) could, in theory get a very different user experience from the same ISP depending on factors such as:

  • Local congestion (service node contention, loading, router and backhaul capacity);
  • Quality and length of local loop (including customer internal wiring);
  • Physical signal interference at the MDF (potentially a big issue where there is lots of ULL);
  • Time of day;
  • Router make and settings (particularly relating to QOS, security).

These factors will, in many cases, massively outweigh performance variation experienced from possible ‘traffic management’ by ISPs.

Internet Protocols try to be ‘Fair’

The Internet runs using a set of data traffic rules or protocols which determine how different pieces of data reach their destinations. These protocols, e.g. TCP/IP, OSPF, BGP, are designed to ensure that traffic from different sources is transmitted with equal priority and efficiency.

Further Technical Fixes Are Possible

Network congestion is not an issue that appeared overnight with the FCC’s 2005 Comcast decision. In fact, the Internet engineering community has been grappling with it with some success since the near-disaster in the late 1980s that led to the introduction of congestion control mechanisms in TCP.

Much more recently, the popular BitTorrent file sharing protocol, frequently criticised for getting around TCP’s congestion control, has been adapted to provide application-level congestion control. The P4P protocol, created at MIT and tested by Verizon and Telefonica, provides means for P2P systems and service provider networks to cooperate better. However, it remains essentially unused.

A further consideration is that it is necessary to be realistic about what can be expected – we have heard the benefits from traffic-shaping cited as an extension of around 10% in the upgrade cycle in the best-case scenario.

It’s Complex, not Neutral

It is therefore simply not the case that all Internet services progress from point of origin somewhere in the cloud of cyberspace to the end-users via a random and polite system. There are assets that are not equally shared, significant local variations, and there are complex rules and standards.

‘The Internet’ is a highly complex structure with many competing mechanisms of delivery, and this is one of its great strengths – the multiplicity of routes and mechanisms creates a resilient and continually evolving and improving system. But it is not ‘neutral’, although many of its core functions (such as congestion control) are explicitly designed to be fair.

Don’t Block the Pipes, Lubricate the Market

In principle, Telco 2.0 endorses developments that support new business models, but also believes that the rights of end-users should be appropriately protected. They have, after all, already paid for the service, and having done so should have the right to access the services they believe they have paid for within the bounds of legality.

In terms of how to achieve this balance, it’s very difficult to measure and police service levels, and we believe that simply mandating traffic management solutions alone is impractical.

Moreover, we think that creating a fair and efficient market is a better mechanism than any form of regulation on the methods that operators use to prioritise services.

Empower the Customer

There are three basic ways of creating and fulfilling expectations fairly, and empowering end-customers to make better decisions on which service they choose.

  1. Improving Transparency – being clear and honest about what the customer can expect from their service in terms of performance, and making sure that any traffic management approaches are clearly communicated.
  2. Enabling DIY Service Management – some customers, particularly corporate clients and advanced users, are able and can be expected to manage significant components of their Internet services. For example, mechanisms already exist to flag classes of traffic as priority, and many types of CPE are capable of doing so. It’s necessary, however, that the service provider’s routers honour the attribute in question and that users are aware of it. Many customers would need support to manage this effectively, and this could be a role for 3rd parties in the market, though it is unlikely that this alone will result in fairness for all users.
  3. Establishing Protection – for many customers, DIY Service Management is neither interesting nor possible, and we argue that a degree of protection is desirable by defining fair rules or ‘best practice’ for traffic management.

Not all customers are alike

‘Net Neutrality’ or any form of management of contention is not an issue for corporate customers, most of whom have the ability to configure their IP services at their will. For example, a financial services trader is likely to prioritise Bloomberg and trading services above all other services. This is not a new concept, as telcos have been offering managed data services (priority etc) to enterprise customers for years over their data connections and private IP infrastructure.

Some more advanced consumer users can also prioritise their own services. Some can alter the traffic management rules in their routers as described above. However, these customers are certainly in the minority of Innovators and Early Adopters. Innovation in user-experience design could change this to a degree, especially if customers have a reason to engage rather than being asked to do their service provider’s bottom line a favour.

The issue of unmanaged contention is therefore likely to affect the mass market, but is only likely to arise in certain circumstances. To illustrate this we have selected a number of specific scenarios or use cases in which we will show how we believe the principles we advocate should be applied. But first, what are our principles?

Lubricate the Market

There are broadly three regulatory market approaches.

  1. Do nothing’ – the argument for this is that there is no evidence of market failure, and that regulating the service is therefore unnecessary and moreover difficult to do. We have some sympathy for this position, but believe that in practice some of direction is needed as recommended below.
  2. Regulate the Market’ – so that telcos can do what they like with the traffic but customers can choose between suppliers on the basis of clear information about their practices and performance. A pure version of this approach would involve the specification of better consumer information at point of sale and published APIs on congestion.
  3. Regulate the Method’ – with hard rules on traffic management rather than how the services are sold and presented. The ‘hard’ approach is potentially best suited to where the ‘market’ is insufficiently competitive / open. This method is difficult to police as services blur and ‘the game’ then becomes to be categorised as one type of service but act as another.

Telco 2.0 advocates a hybrid approach that promotes market transparency and liquidity to empower customers in their choices of ISP and services, including:

  • Guidelines for operators on ‘best practice in traffic management’, which in general would recommend that operators should follow the principle of “minimum intervention”;
  • Published assessments on how each operator meets these guidelines that make understanding operator’s performance on these issues straightforward for customers.

The criteria of the assessment would include the actual performance of the operator against claimed performance (e.g. speed, latency), and whether they adhere to the ‘Code of Best Practice’.

How might it work?

The communication of this assessment could be as simple as a ‘traffic light’ style indicator, where a full Internet service meeting best practice and consistently achieving say 90% of claimed performance would be ‘Green’, while services meeting lower standards / adherence or failing to report adequately would be signalled ‘Amber’ or ‘Red’. The principles used by the operator should also be published, though utilising this step on its own would run the risk of the “Licence Agreement” problem for software – which is that no-one reads them.

We’ll be working on refining our guidelines and thoughts on how an indicator or other system might work by working through some specific ‘Use Cases’ outlined below. In the meantime, we recommend the suggestions made by long-time Telco 2.0 Associate Dean Bubley in his Disruptive Analysis’s ‘Draft Code of Conduct for Policy Management and Net Neutrality’.

It is our view that as long as Telcos are forced to be open, regulator (and consumer bodies) can question or, ultimately, regulate for/against behaviours that could be beneficial/damaging.

The Role of the Regulator

We believe that the roles of the regulator(s) should be to:

  • Develop an agreed code of best practice with industry collaboration;
  • Agree, collect and publish measures of performance against the code;
  • Make it as easy as possible to switch providers by reducing the ‘hassle factor’ of clumsy processes, and by releasing consumers from onerous contractual obligations in instances of non-compliance with the code or performance at a ‘Red’ standard;
  • Monitor, publicise, and police market performance in line with appropriate regulatory compliance procedures.

We draw a parallel with what the UK regulator, Ofcom, used to do for telephony:

  • Force all providers with over a certain market share to report key performance metrics;
  • Publish these (ideally on the web, real time and by postcode);
  • Make it as easy to switch providers as possible;
  • Continuously review the set of performance metrics collected and published.

New ‘Enhanced Service’ Business Models?

Additionally, we see the following possible theoretical service layers within an Internet Service that could be used to create new business models:

  1. Best efforts’ – e.g. ‘We try our best to deliver all of your broadband services to maximum speed and performance, but some services may take priority at certain times of the day in order to cope with network demands. The services will not cease to work but you may experience temporarily degraded performance.’
  2. Protected’ – akin to the ambulance lane (e.g. Health, SmartGrid – packets that are always delivered/could be low or higher bandwidth e.g. a video health app but the principle of priority stands for both).
  3. Enhanced Service’ – e.g. a TV service that the customer has paid for (e.g. IPTV) or that a network will (or might) pay extra to deliver assure a higher degree of quality.

One possibility that we will be exploring is whether it could be possible to create an ‘On-demand Enhanced Service’. For example, to deliver a better video streaming experience the video provider can pays for their traffic to take priority over other services with the express consent of the customer. This may be achieved by adding a message to the Enhanced Service e.g. ‘Click here to use our Enhanced Video Service where we’ll pay to get your video to you quicker. This may cause degradation to the service to other applications currently active on your broadband line while you are using the Enhanced Video Service’.

We have long thought that there is scope for innovation in service design and pricing – for example, rather than offering a (supposed) continuous 8Mbps throughput (which most UK operators can’t actually support and have no intention of supporting), why not offer a lower average rate and the option to “burst” up to high speed when required? ISPs actually sell each other bandwidth on similar terms, so there is no reason why this should be impossible.

Example Scenarios / Use Cases

We’ve identified a number of specific scenarios which we will be researching and developing ‘Use Cases’ to illustrate how these principles would apply. Each of these cases is intended to illustrate different aspects of how a service should be sold to, and managed by / for the customer to ensure that expectations are set and met and that consumers are protected appropriately.
Fixed ‘Use Cases’

  1. Contention between Internet services over an ADSL line on a copper pair, e.g. Dad is editing a website, Daughter is watching YouTube videos, with a SmartGrid meter in operation over a shared wireless router. This is interesting because of the limited bandwidth on the ADSL line, plus consideration of the SmartGrid monitoring as a ‘Specialised Service’, and potentially also as a ‘Protected Service’ in our exploratory classification of potential service classes.
  2. Contention between Internet and Specialised Services over an ADSL line on a copper pair, e.g. Dad is streaming an HD video on the internet, daughter is watching IPTV. This is interesting because of the limited bandwidth on the ADSL line and the additional factor of the IPTV service over the broadband connection. Unlike a DOCSIS 3 cable link, where the CATV service is additional to the Internet service and in fact can be used to offload applications like iPlayer, the DSL environment means that “specialised services” will contend with public Internet service.
  3. Managed Vs Unmanaged Femtocells over an ADSL connection. An Unmanaged Femtocell is e.g. a Sprint Femtocell over an AT&T ADSL connection, where the Femtocell is treated purely as another source of IP traffic. A Managed Femtocell is e.g. a Softbank Femtocell operating on a Softbank ADSL line, using techniques such as improved synchronisation with the network to produce a better service. An examination of alternate approaches to managing Femtocell traffic is interesting: 1) because a Femtocell inherently involves a combination of mobile and fixed traffic over different networks, so draws out fixed/mobile issues, and; 2) it is useful to work through how a Managed Femtocell Use Case might work within the market approach we’ve defined.
  4. A comparison of a home worker using videoconferencing with remote colleagues in two scenarios: one using VPN software and configured router; the second using Skype with no local configuration. The objective here is to explore the relative difference in the quality of user experience as an illustration of what is possible in a advanced user ‘DIY’ management scenario.
  5. The ‘Use Case’ of an ‘On-demand Enhanced Service’ for a professional web video-cast, with the consumer experience as outlined above. The idea here is that the user grants temporary permission to the video provider and the network to temporarily provide an ‘Enhanced Service’. This role of this ‘Use Case’ is to explore how and whether a ‘sender pays’ model could be implemented both technically and commercially in a way that respected consumer concerns.
  6. HDTV to the living room TV. This is interesting because the huge bandwidth requirements needed to deliver HDTV are far beyond those originally envisaged and have a potentially significant impact on network costs. Would user expectations of such a service permit e.g. buffering to deliver it without extra cost, or might this also enable a legitimate ‘two-sided’ sender pays model where the upstream customer (e.g. the media provider) pays?

Mobile ‘Use Case’

  1. VOIP over mobile. Is it right that VOIP over mobile networks should be treated differently from how it is over fixed networks?

Telco 2.0’s Position Vs the Rest

There is reasonably common ground between most analysts and commentators on the need for more transparency in Internet Access service definition and performance and management standards, though there is little clarity yet in the ways in which this clarity might be achieved.

The area which is most contentious is the notion of ‘non-discrimination’ – that is of allowing ISPs to prioritise one form or source of traffic over another. AT&T are firmly in favour of ‘paid prioritisation’ whereas Google/Verizon are not, and says ‘wireline broadband providers would not be able to discriminate against or prioritize lawful Internet content, applications or services in a way that causes harm to users or competition’.

Interestingly, in the Norwegian Government’s Net Neutrality Guidelines issued in 2009, provision is made that allows operators to manage traffic in certain circumstances in order to protect the network and other services.

Free Press are a US activist movement who champion ‘Net Neutrality’. While we have accord with their desire for freedom of speech, and understand the imperative to create a more level-playing field for media in the US, our position is not aligned in terms of enshrining total neutrality globally by regulation.

In terms of the regulators’ positions, the UK’s Ofcom is tentatively against ‘ex-ante’ regulation, whereas the FCC seems to favour non-discrimination as a principle. The FCC is also asking whether mobile and fixed are different – we say they are, although as the example of 3UK shows, the differences may not be the ones you expect. Ofcom is also already looking at how it might make switching easier for customers.

We also note that US-based commentators generally see less competition on fixed internet services than in Europe, and less mobile broadband options for customers. Our position is that local competitive conditions are a relevant consideration in these matters, albeit that the starting point should be to regulate the market as described before considering a stronger stance on intervention in circumstances of low local competition.

Conclusion & Recommendations

‘Net Neutrality’ is largely a clever but distracting lobbyists’ ploy that has gathered enormous momentum on the hype circuit. The debate does create a possible opportunity to market and measure broadband services better, and that’s no bad thing for customers. There may also be opportunities to create new business models, but there’s still work to be done to assess if these are material.

‘Lubricate the Market’

1. “Internet Access” should be more tightly defined to mean a service that:

  • Provides access to all legitimate online services using the ‘public’ internet;
  • Performs within certain bounds of service performance as marketed (e.g. speed, latency);
  • Is subject to the minimum necessary ‘traffic management’ by the ISP, which should only be permissible in specific instances, such as contention (e.g. peak hour use);
  • Maintains consistent delivery of all services in line with reasonable customer expectation and best possible customer experience (as exemplified in a ‘code of best practice’);
  • Provides published and accessible performance measures against ‘best practice’ standards.

2. Where a customer has paid extra for a ‘Specialised Service’, e.g. IPTV, it is reasonable to give that service priority to agreed limits while in use. Services not meeting these criteria should be named, e.g. “Limited Internet Access”.

3. ISPs should be:

  • Able to do ‘what they need’ in terms of traffic management to deliver an effective service but that they must be open and transparent about it;
  • Realistic about the likely limits to possible benefits from traffic-shaping.

4. The roles of the regulator are to:

  • Develop an agreed code of best practice with industry collaboration;
  • Agree, collect and publish measures of performance against the code;
  • Ensure sufficient competition and ease of switching in the market;
  • Monitor, publicise, and police market performance in line with appropriate regulatory compliance procedures.

We have also outlined:

  • Principles for a code of best practice;
  • A simple ‘traffic light’ system that might be used to signal quality and compliance levels;
  • ‘Use Cases’ for further analysis to help refine the recommended ‘Code of Practice’ and its implementation, including exploration of an ‘On-Demand Enhanced Service’ that could potentially enable new business models within the framework outlined.


Optimising Mobile Broadband Economics: Key Issues and Next Steps

Summary: below is the Executive Summary and extract from a report on key issues for operators seeking to optimise mobile broadband network economics which were debated at the recent Telco 2.0 EMEA Brainstorm in London.

(NB: New video presentations exploring these issues in more detail will be broadcast online at Telco 2.0 Best Practice Live! on 28-30 June. Register here – it’s FREE.)

Executive Summary

At the 9th Telco 2.0 Executive Brainstorm, held in London on April 28-30, a dedicated session addressed the technical and business model challenges of mobile broadband, specifically looking at the cost problems and opportunities of the data boom.

The primary points made by the presenters were that:

  • New air interfaces and spectrum will not be enough to on their own to cope with the continued rise in data traffic. Building more cells alone is not a solution, and it will be necessary to address costs and pricing;
  • The challenge needs to be approached both from the network, through policy-based control including tiering and maybe traffic-shaping, backhaul optimisation, and offload through femtocells or WLAN, and from the business side with pricing, potential tiered offers and segmentation;
  • Techniques have to be deployed to manage traffic to deliver customer experiences, particularly for cloud and TV services;
  • The use of DPI for application-based traffic charging isn’t thought to be a practical solution, though device based management may be in some instances;
  • No single method of addressing capacity issues provides a complete solution and therefore a combination of offload, traffic management and segmentation is recommended.

Figure 1 – Key issues in Optimising the Economics of Mobile Broadband Networks

DB%20Conclusion%20slides.png

Source: Telco 2.0, 9th Telco 2.0 Executive Brainstorm, April 2010

Delegates: tiering sounds good but how do we do it?

Charging for providing higher and tiered Quality of Service (QoS) was a major topic of debate, and although this was ultimately voted as the most important potential current strategy, there were also strong disparate views offered by delegates. Other major themes were potential technological approaches, the role of content owners, LTE, and application based pricing.

Figure 2 – Delegate Vote on Near-Term Strategies
Vote%203%20Impact%20of%20business%20models.png

Source: 9th Telco 2.0 Executive Brainstorm, April 2010

[Ratings: 1-5, where 1 = ‘doesn’t move the needle’, and 5 = ‘dramatic positive effect on the economics of mobile broadband provision’]

Telco 2.0 Next Steps: Optimising Mobile Broadband Business Model Economics

Optimising mobile broadband economics is a complex challenge, or might perhaps be more accurately described as a collection of different challenges for different operators. There’s always a temptation to try to solve complex problems with a single ‘silver bullet’ idea, but in this instance this is almost certainly impossible, as there are many different possible solutions and different combinations of solutions will work at different times for different operators.

In our series of Future Broadband Business Models Strategy Reports, Telco 2.0 has previously explored the long term business model and technical architectures in Beyond Bundling: Growth Strategies for Fixed and Mobile Broadband – “Winning the $250Bn delivery game.”, the structure and evolution of the online video distribution market in Online Video Market Study: The impact of video on broadband business models, and most recently updated our analysis on a range of nearer term potential business model strategies in New Mobile, Fixed and Wholesale Broadband Business Models.

We will next create a new report summarizing the main options for optimizing mobile broadband business model economics. In addition, Mobile Broadband will feature in the first Telco 2.0 Best Practice Live! event at the end of June. This will provide a video-based online data bank of some of the most interesting Mobile Broadband case studies from across the world.

– Start of Detailed Report Extract –

Mobile Broadband Network Economics – Invest in Business Models as well as Technology

Moving attention away from the service side of the mobile broadband debate, speakers at the 9th Telco 2.0 Executive Brainstorm concentrated instead on how to move the needle on the cost side of the mobile broadband economics equation.

Stimulated by presentations by Dean Bubley, Senior Associate, Telco 2.0, and Dan Kirk, Director, Value Partners and a panel discussion that also included Johan Wickman, CTO Mobility, TeliaSonera, Eddie Chan, Global Head, Efficiency, NSN Consulting, and Andrew Bud, Chairman, MBlox, delegates came to the conclusion that pricing and segmentation strategies, together with offloading capabilities are more important than LTE in dealing with the data-inspired capacity crunch.

Redefining the Problem

Dean Bubley, Senior Associate, Telco 2.0, laid out the problem facing mobile operators. He displayed the now-iconic chart illustrating the ‘broadband incentive problem’ but argued that this was not a problem in itself – he said it was interesting but not necessarily a problem. It didn’t, for example, follow that the data service was going to be provided at a loss. Indeed, Johan Wickman’s TeliaSonera is one of a number of operators that are experiencing data revenues higher than is commonly believed. The incentive problem also doesn’t say anything about where cost or capacity issues would manifest themselves – in which elements of the network, or indeed what the right strategy would be to deal with them. Indeed, there are complex technology strategy issues present that aren’t addressed by such a statement at all.

Figure 3 – The ‘Broadband Incentive Problem’ Statement

BB%20incentive.png

 
Source: Telco 2.0, 9th Telco 2.0 Executive Brainstorm, April 2010 

Understanding Costs and Technology

Furthermore, he suggested that the industry may be paying more attention to how revenues from mobile broadband might be increased than how its costs could be controlled. Referring to an Agilent Technologies presentation on LTE, he pointed out that the large majority of all current and future wireless capacity was accounted for by the creation of new cells, therefore radio air interface improvements and spectrum release would not be anywhere near enough to support continued traffic growth without much more cell subdivision, with all its associated costs, and more use of “small cells” such as femtocells, WiFi, or pico-cells.

Network Solutions and Limitations

It is inevitable therefore to look at ways to better use the capacity available. However, the options for managing and shaping traffic are not straightforward and, as NSN’s Eddie Chan said, it is necessary to realise that “efficient” is not the same as “cheap” – efficiency is also about service improvements.

Traffic Management Mess

Bubley was particularly critical of traffic management solutions. He pointed to the important subtlety that traffic management could easily become a “mess”, particularly as traffic to and from PCs is difficult to manage. It tends to include many applications and, what is more, many applications and protocols can often be tunnelled within each other. The PC is a powerful open development platform and therefore there is much scope for users to circumvent traffic shaping. The share of PC traffic that consisted of non-voice data is in the order of 90%+ and essentially all of it is going to or from the public Internet, so whatever the operator does would be come at a cost. The complexity of this is illustrated below.

Figure 4 – Traffic Management Options

DB%20traffic%20management.png

Source: Telco 2.0, 9th Telco 2.0 Executive Brainstorm, April 2010

Bubley did point out that smartphone data and featurephone traffic are much more likely to be open to operators “adding value” than PC traffic as they are going to operator-hosted or operator-managed services. The traffic still has to be “managed”, but it’s now “friendly” traffic which is much more predictable. M2M devices, meanwhile, send all their traffic through the operator’s network – which might be a good reason to promote them as a line of business. Given the associated behaviours, it might be wise to segment by device rather than by application, an approach that Bubley feels is even more pertinent given concerns over DPI (Deep Packet Inspection), a technique by which network equipment looks beyond the header used for routing to non-header content (typically the actual payload) for some purpose, in this case to prioritise traffic.

The Doubtful Promise of DPI

Bubley argues that application-layer traffic shaping based on DPI has serious downsides; a major one simply being the definition of an application. For example, which service class would a YouTube video inside a Facebook plug-in have? Users would also adapt to it, use encryption, and tunnel one application in another to get round restrictions. Indeed, much of the file-sharing traffic had already moved to HTTP or HTTPS on ports 80 and 443. This may sound overly ‘techie’ but what it means is that file sharing traffic becomes indistinguishable from, and blends with, generic Web traffic. In addition, there would certainly inaccurate results and ‘false positives’, which could lead to political, regulatory, and reputational issues.

The only uses for deep packet inspection he could see were compliance with law-enforcement demands and gathering data for network optimisation, which might help the industry clear up whether its problems were caused by pirates running P2P, or bad network designs, aggressive data use by smartphones etc., or software updates.

Offload Options

So, if managing and shaping traffic effectively on one network is problematic, does it make more sense to offload it onto another?

The major advantage of the offload concept is that nobody’s data is being de-prioritised – rather than a re-allocation of (supposedly) scarce bandwidth, it represents an actual improvement in the efficiency of the network. It is therefore much less complex from a regulatory, political, and economic standpoint.

Solutions at the Business Layer

There are certainly some valuable options for addressing the data issue from a technical point of view, offload perhaps the most valuable amongst them. However, these are not all the weapons in an operator’s arsenal. They can also look to manage the impact of traffic on their networks and their bottom lines by looking at different business model and pricing options.

On the revenue side, Bubley says the bulk of revenue will be from ‘downstream’ subscription and pre-pay customers, and while helpful, that the near-term growth of new ‘upstream’ or wholesale / carrier services revenues alone would not be enough to cover the costs of capacity increases.

Figure 5 – New Revenue Streams Not Enough to Offset Capacity Requirements

Capacity%20table%20stakes.png

Source: Telco 2.0, 9th Telco 2.0 Executive Brainstorm, April 2010

This view was backed up by a delegate vote (see below) that suggests that while other options are possible, in the short term better tiering and segmentation strategies will be the best answer, followed by device-orientated solutions.

In this vote, the “New device categories” captures M2M (Machine-to-Machine) markets, “device bundled” refers to “comes with data” business models such as the connectivity Sprint provides for the Amazon Kindle, while ‘better tiering and segmentation’ refers to service and tariff packages. ‘Sender party pays’ is where users receive the service free and the sending party, be it an advertiser or other enterprise, pays, and ‘government sponsored’ is the case where the government pays for the connection as a public service.

Figure 6 – Impact of Mobile Broadband Business Models

Vote%201%20MBB%20short%20term%20revenue%20impact.png

Source: 9th Telco 2.0 Executive Brainstorm, April 2010

All Devices Are Not Equal

Returning to Bubley’s earlier claim that device segmentation may be more effective than application management policies, devices are a natural place to start when looking at business segmentation strategies. However, not all devices are created equal.

Smartphones, for example, tend to generate many relatively brief data sessions, they move around constantly and therefore carry out large numbers of register/handoff transactions with the network, and they also generate voice and messaging traffic. Because the signalling overhead for a data call is incurred when setting up and tearing down the session, a given amount of traffic split into 10 brief sessions is dramatically more demanding for the network than the same amount in one continuous session. Also, smartphones often have aggressive power-management routines that cause more signalling as they attempt to migrate to the cell that requires the least transmitter power.

On the other hand, although laptops tend to consume lots of bulk data, they do so in a relatively network-friendly fashion. The cellular dongles are typically operated much like a fixed-line modem, registering with the network and staying on-line throughout the user session. Their use profile tends to be nomadic rather than truly mobile, as the user is typically sitting down to work at the computer for an extended session. And the modems rarely have any serious power management, as they draw power over USB from the computer. These behaviours therefore create natural segments.

To read the rest of the report, covering…

  • Selling QoS/QoE
  • LTE – Build and They Will Come?
  • Four Scenarios for the Future Development of Mobile Broadband Business
  • Concluding Analysis
  • Telco 2.0 Next Steps: Optimising Mobile Broadband Business Model Economics

…and including…

  • Figure 1: Key Options for Cost Management in Mobile Broadband Networks
  • Figure 2: Delegate Vote on Near-Term Strategies
  • Figure 3: The ‘Broadband Incentive Problem’ Statement
  • Figure 4: Traffic Management Options
  • Figure 5: New Revenue Streams Not Enough to Offset Capacity Requirements
  • Figure 6: Impact of Mobile Broadband Business Models
  • Figure 7: More to Customer Experience than the Access Network
  • Figure 8: Upstream Demands for More Bandwidth
  • Figure 9: Predicted Timing of LTE Revenues in Europe
  • Figure 10: Impact of Mobile Broadband Business Models
  • Figure 11: Integrated Traffic and Segmentation Strategies More Important than LTE Alone
  • Figure 12: Key Options for Cost Management in Mobile Broadband Networks

 …Members of the Telco 2.0TM Executive Briefing Subscription Service and Future Networks Stream can download the full 20 page report in PDF format here. Non-Members, please see here for how to subscribe. Please email contact@telco2.net or call
+44 (0) 207 247 5003 for further details.

Mobile & Fixed Broadband Business Models: Four Strategy Scenarios

Summary: an introduction to the four strategy scenarios we see playing out in the market – ‘Telco 2.0 Player’, ‘Happy Piper’, ‘Device Specialist’, and ‘Government Department’ – part of a major new report looking at innovation in mobile and fixed broadband business models. (March 2010, Foundation 2.0, Executive Briefing Service, Future of the Networks Stream).

Introduction

This is an extract from the Overview section of the Telco 2.0 report ‘Mobile and Fixed Broadband Business Models: Best Practice, ‘Telco 2.0′ Opportunities, Forecasts and Future Scenarios‘.

The extract includes:

  • Overview of the three macroscopic broadband market trends
  • The five recurrent themes
  • Defining Telcos and Broadband Service Providers (BSPs) in the future
  • Market adoption of broadband
  • An Introduction to the four scenarios

A PDF version of this page can be downloaded here.

Overview

This section of the report provides a backdrop to the rest of the study. It highlights the key trends and developments in the evolution of broadband, which fundamentally underpin the other aspects of business model innovation discussed in the subsequent chapters. It also introduces Telco 2.0’s main ‘end-game scenarios’ for broadband service providers (BSPs), and gives a round-up of some of the key background statistics.

There are three main macroscopic trends in the broadband market:

1.   A focus on improving the reach and profitability of existing low/mid-speed broadband in developed countries, especially with the advent of inexpensive mobile data, and new methods of monetising the network through wholesale options, value-added services and better segmentation;

2.   Deployment of next-generation very high-speed broadband, and the building of business models and services to support this investment, typically involving video services and/or state backing for nationally-critical infrastructure projects;

3.   Continued steady rollout of broadband in developing markets, balancing theoretical gains in social and economic utility against the practical constraints of affordability, PC/device penetration and the need for substantial investment.

Cutting across all three trends are five recurrent themes:

Maturing products and business models

  • The global broadband market is maturing fast. In developed countries, baseline penetration rates are starting to level off as saturation approaches. Coupled with price erosion and increasing capacity demands, this deceleration is pressuring margins, especially in the recession;
  • The pivotal role of video in driving both costs and revenues, given its huge requirement for bandwidth, especially in high-definition (HD) format.
  • An awareness of the need for retail and wholesale business model evolution, as revenue growth plateaus and current attempts at bundling voice and/or IPTV (fixed) or content (mobile) show only patchy success.

Convergence of fixed and mobile technology and product offerings

  • The impact of mobile broadband, either as a substitute or a complement to fixed broadband. This goes hand-in-hand with the advent of more powerful personal devices such as smartphones and netbooks.

Greater state intervention in deploying and controlling broadband access

  • Intensifying regulation, focusing on areas such as facilities and service-based competition, unbundling and structural separation, Net Neutrality, spectrum policy and consumer advocacy;
  • Increasing government intervention in areas, such as broadband roll-out and strategy, outside the (traditional) scope of the regulatory authorities. This is conducted either through subsidy and stimulus programmes, or broader initiatives relating to national efforts on energy, health, education and the like;
  • A growing belief that broadband networks should also support ‘infrastructure’ services which may not be delivered by the public Internet – for example, remote metering and ‘smart grid’ connectivity, support for healthcare or e-government, or education services. A major battle over the next 10 years will be whether these are delivered as ‘Telco services’, ‘Internet services’ or as distinct and separately-managed network services by providers using wholesale access to a Telco network.

A more complex broadband ecosystem

The increasing role of major equipment vendors in facilitating new business models, either through managed services / outsourcing / transformation, direct engagement with governments on strategic architecture issues, or supply of key ‘platform’ components. However, many vendors are torn between protecting the legacy heavily-centralised models of their existing Telco customers, and exploring new targets within public-sector or Internet domains.

New consumer behaviour and higher expectations

Changing user behaviour as broadband becomes a basic expectation (or a government-mandated right) rather than a premium service, with the mass uptake of new applications and the added benefits of mobility.

Defining Telcos and BSPs in the future

One of the largest challenges in identifying Telco business models for the forthcoming era of next-generation access is the question of what actually defines a Telco, or a Broadband Service Provider (BSP).

In fixed networks, especially with new fibre deployment, the situation is becoming ever more complex because of the number of levels at which wholesaling can take place. If an incumbent ADSL operator buys, packages and rebrands wholesale dark fibre capacity from a municipally-owned fibre network, which one is the BSP? Or are they both BSPs?

The situation is a lot easier in mobile, where there still remains a fairly clear definition of a mobile operator, or a mobile virtual network operator (MVNO) – although in future network-sharing and outsourcing may also blur the boundaries in this market.

It is possible that there isn’t an appropriate strict definition, so a range of proxy definitions will start to apply – membership of bodies like the GSMA, possession of a ‘mobile network code’, access to certain number ranges, ownership of spectrum and so forth. In an era where Google buys dark fibre leases, Ericsson manages cellular networks, investment consortia contract to run a government-sponsored infrastructure and  mobile operators offer ‘over the top’ applications – it all becomes much less clear.

In this report, BSPs are taken as a broad class to include:

  • Owners of physical broadband access network infrastructure – taken as either physical cabling or fibre (wireline) or spectrum and radio cells (mobile). Telco 2.0 does not include rights-of-way owners or third-party cell-tower operators in this definition;
  • Owners of broadband access networks built using wholesale capacity on another provider’s wires or fibres, but with their own active electronics, E.g. basing a network on unbundled loops or dark fibre;
  • Providers of retail broadband access, perhaps bundled with other services, using bitstream, ethernet access or MVNO models based on wholesale from another network operator.

These definitions exclude 2G-only (non-broadband) mobile operators and MVNOs, PSTN or cable TV access provided without broadband connectivity and non-retail access providers, such as microwave backhaul operators and content delivery networks (CDNs) Etc.

Market adoption of broadband


The global broadband access market has grown from fewer than 10 million lines in 1999, to more than half a billion at the end of 2009, predominantly through the growth of DSL-based solutions, as well as cable and other technologies. Although growth has started to slow in percentage terms, there remains significant scope for more homes and businesses to connect, especially in developing economies, such as China. Older fixed broadband services in more industrialised economies will gradually be replaced with fibre.

The other major area of change is in wireless. Since 2007, there has been rapid growth, with the uptake of mobile broadband for ‘personal’ use with either smartphones or laptops, often in addition to users’ existing fixed lines. This category of access will grow faster than fixed connections, reaching more than one billion active individual users and almost two billion devices by 2020 (see Figure 1). Although a strong fixed/mobile overlap will remain, there will also be a growing group of users whose only broadband access is via 3G, 4G or similar technologies.

There are a number of complexities in the data:

  • Almost all fixed broadband connections are ‘actively used’. The statistics do not count copper lines capable of supporting broadband, but where the service is not provisioned;
  • Conversely, many notional ‘mobile broadband’ connections (E.g. 3G SIMs in HSPA-capable devices) are, in fact, not used actively for high-speed data access. The data in this report attempts to estimate ‘real’ users or subscribers, rather than those that are theoretically-capable, but dormant;
  • At present, most broadband usage is based on subscriptions, either through monthly contracts or regular pre-paid plans (mostly on mobile). Going forward, Telco 2.0 expects to see may non-subscription access customers who have either temporary accounts (similar to the WiFi single-use model) or have other forms of subsidised or bundled access as described later in the report;
  • Lastly, the general assumption is that fixed broadband can be shared by multiple people or devices in a home or office, but mobile broadband tends to be personal. This is starting to change with the advent of ‘shared mobile access’ on devices like Novatel’s MiFi, as well as the use of WiMAX and, sometimes, 3G broadband for fixed wireless access.

Figure 1. Global broadband access lines, 2000-2020

personal%20mobile%20growth%20mar%202010.png

Source: Telco 2.0 analysis  

Breaking the data out further shows the recent growth trends by access type (see Figure 2). Mobile use has exploded with the growth of consumer-oriented 3G modems (dongles) and popular smartphones, such as the Apple iPhone and various other manufacturers’ recent devices. DSL growth has continued in some markets, such as Eastern Europe and China. Conversely, cable modem growth, entrenched in North America, has been slow as there has been limited roll out of new cable TV networks.

Figure 2: Global broadband access lines by technology, 2005-10

fbbm%20bar%20chart%20extract%20mar%2024%202010.png

Source: Telco 2.0 analysis  

It is important to note the importance of Asia in the overall numbers (see Figure 3). Although many examples in this report focus on developed markets in Europe and North America, it is also important to consider the differences elsewhere. Fibre is already well-established in several Asian markets, such as Japan and Singapore, while future growth in markets, such as India, may well turn out to be mobile-driven.

An alternative way of looking at the industry dynamics is through levels of data traffic. This metric is critically important in determining future business models, as often data expands to fill capacity available – but without a direct link between revenue and costs. In future, fixed broadband access will start to become dominated by video traffic. Connecting an HDTV display directly to the Internet could consume 5GB of data per hour, orders of magnitude above even comparatively-intense use of PC-based services, such as YouTube or Facebook.

Figure 3: Global fixed broadband by region, mid-2009
 

fbbm%20extract%20pice%20chart%20mar%2024%202010.png

Source: Broadband Forum

The dynamics of mobile traffic growth (see Figure 4) are somewhat different, and likely to be dominated by a sustained rise in the device/user numbers for the next few years, rather than specific applications. Nevertheless, the huge ramp-up in aggregated data consumption will put pressure on networks, especially given probable downward pressure on pricing and the natural constraints of cellular network architectures and spectrum. The report looks in depth at the options for ‘offloading‘ data traffic from cellular devices onto the fixed network.

Figure 4: Global broadband traffic

fbbm%20traffic%20growth%20chart%20extract%2024%20mar%202010.png

Source: Cisco Systems   

Note: EB = Exabyte. 1 Exabyte = 1,000 Petabytes = 1 million Terabytes

The Four Scenarios

Given the broad diversity of national markets in terms of economic development, regulation, competition and technology adoption, it is difficult to create simplistic categories for the BSPs of the future. Clearly, there is a big distance between an open access, city-owned local fibre deployment in Europe versus a start-up WiMAX provider in Africa, or a cable provider in North America.

Nevertheless, it is worth attempting to set out a few scenarios, at least for BSPs in developed markets for which market maturity might at least be in sight (see Figure 5 below). While recognising the diversity in the real world, these archetypes help to anchor the discussion throughout the rest of the report.  The four we have explored (and which are outlined in summary below) are:

  • Telco 2.0 Broadband Player
  • The Happy Piper
  • Government Department
  • Device specialist

There are also a few others categories that could be considered, but which are outside the scope of this report. Most obvious is ‘Marginalised and unprofitable’, which clearly is not so much a business model as a route towards acquisition or withdrawal. The other obvious group is ‘Greenfield BSP in emerging market’, which is likely to focus on basic retail connectivity offers, although perhaps with some innovative pricing and bundling approaches.

It is also important to recognise that a given operator may be a BSP in either or both mobile and fixed domains, and possibly in multiple geographic markets. Hybrid operators may move towards ‘hybrid end-games’ in their various service areas.


Figure 5: Potential scenarios for BSPs

fbbm%20four%20scenarios%20mar%2023%202010.png

Source: Telco 2.0 Mobile and Fixed Future Broadband Business Models

For more details on the scenarios, please see the new Telco 2.0 Strategy Report ‘Mobile and Fixed Broadband Business Models – Best Practice Innovation, ‘Telco 2.0’ Opportunities, Forecasts and Future Scenarios‘, email contact@telco2.net, or call +44 (0) 207 247 5003.

Full Article: New Opportunities in Online Content Distribution

Summary: as part of our new ‘Broadband End-Games’ report, we’ve been defining in detail the opportunities for telcos to distribute 3rd party content and digital goods in new ways.

You can download a full PDF copy of this Note here.

Introduction

Telecoms operators have traditionally retailed their services to consumers, businesses, not-for-profit and public sector organisations. Carriers have also resold services to other operators as wholesale services (including regulated services such as interconnection).

At the Telco 2.0 initiative, we have long argued that there is an opportunity for telecoms operators to develop a new “2-sided” revenue stream, broadly divided into B2B VAS platform revenues and Distribution revenues. These services enable third party organisations in multiple vertical sectors to become much more effective and efficient in their everyday interactions and business processes. We have valued the potential to Telco’s’ at 20% of additional growth on core revenues in ten years’ time…. if they take-up the opportunity.

Figure 1: 2-sided business model framework

distribution%20chart%20one%202-sided.png

As Telco 2.0 concepts gain acceptance, we are being asked by operators to provide greater detail on both the B2B VAS Platform and Distribution opportunities. Operators are looking to quantify these in specific geographies. To this end, we have described the B2B VAS platform opportunity extensively, in particular in the 2-sided Business Model Platform Opportunity strategy report.

Also, we have modelled Distribution revenues for fixed and mobile broadband distribution and provided detailed commentary in our strategy report on Future Broadband Business Models. We have extended this work to cover Distribution using narrowband, voice and messaging. This Analyst Note provides a synthesis of this modelling work and an updated description of the Distribution revenue opportunity. A forthcoming Analyst Note will cover Sizing the 2-sided Distribution Opportunity for Telco.

Defining 2-sided distribution

Telecoms, historically focused on providing interpersonal communications, has increasingly become an electronic transport and delivery business. In defining the “distribution” element of 2-sided business opportunity, we highlight four criteria:

  • The distribution service is essentially concerned with moving electronic data from one location to another. Distribution revenues relate to this alone. The terms ‘upstream’ provider and ‘downstream’ customer relate to the commercial relationship and not to the flow of data. Distribution services can apply to moving data in either or both directions.
  • The service may include an ‘above-standard’ technical specification and quality of service to meet specific performance requirements, generally associated with the nature of the application for which the data is being sent.
  • The service is being paid for by the upstream third-party provider, but is often initiated by the downstream customer.
  • The distribution service is a minor telecoms component of the primary non-telecoms service or goods being accessed by the downstream user. Mostly, the distribution service is enabling interaction between the upstream third-party provider and downstream customer. For example, a Kindle user is paying Amazon for an e-book that is delivered over a network. Amazon pays the telecoms operator (in the US, this was Sprint and is now AT&T) for the delivery of the e-book (the main non-telecoms product).

This last criterion makes a distinction between two-sided distribution and wholesale telecoms (and carrier interconnection). This is a key distinction, as it highlights an underlying industry-level difference in business model and a move away from a closed Telco system to a more open platform. Operators that do not significantly compete in the same retail market as their wholesale customer(s) may not consider this distinction important. This is because they do not consider their wholesale customer(s) to be competition, but rather a channel. However, wholesale customers nearly always compete at some level. Furthermore, this is missing a key point: 2-sided distribution is about “growing the pie” for Telco whereas growing wholesale in a mature market, generally results in “shrinking the pie”.

There is a “grey area” between 2-sided distribution and carrier wholesale. Offloading mobile broadband onto fixed broadband networks is an example of Wholesale2.0, since it is primarily an inter-carrier arrangement intended to reduce mobile network costs. In most cases however, it is still possible to make a clear distinction, as illustrated in the final two examples in Figure 2.

Figure 2: Examples of 2-sided Telco distribution

Example

Description

Comment

Freephone

Callers use freephone services to access goods or services from upstream third-party provider.  Although they could achieve this through a retail call, the upstream third-party provider pays for the freephone call as part of their overall proposition around  their main service or product, which the downstream customer is ultimately accessing.  

The actual freephone call charges (excluding ‘B2B VAS platform’ charges for number provisioning, directory listing, or any inbound call handling features) are Telco distribution revenue because they relate to enabling an interaction (by carrying a voice conversation) that has been initiated by the downstream party, but paid for by the upstream third-party party in order to deliver something else.  This ‘something else’ main service could be booking a flight, ordering a pizza, calling the army recruitment centre or enquiring about installing loft insulation.

Premium SMS (carriage-only)

A premium SMS is a service offered by Telcos to upstream third-party providers that enables them to provide a service or goods to downstream users.  Although the telco may be billing for this, it is not the Telco’s service that the end user is buying. This is therefore not retail (one-sided) revenue, unless the Telco is also the upstream third-party content provider.  

Premium services include a host of B2B VAS services (notably payment and collection).  The charges levied by Telcos therefore include a combination of distribution and B2B VAS.  The distribution element relates to the pure SMS transport (carriage only) at normal bulk rates, not the full or even net SMS revenues.

TwitterPeek

TwitterPeek is a dedicated device offered by Twitter through Amazon, which gives users unlimited access to their Twitter account and the associated functions (Send Tweets, subscribe to others’ Tweets, Retweet, search Tweets, etc..  The service costs $99 for six months followed by $7 a month.  There is also a $199 option for lifetime use.

In this example, the main service is Twitter.  The connectivity service that supports TwitterPeek, is considered to be 2-sided distribution rather than wholesale because it does not directly compete with any core telco communications offering.   

Breaking down the opportunity

At its highest level, we have broken the types of distribution into wired or wireless. This distinction is partly technical (as it reflects the underlying network). It is also related to business model and regulatory regime (eg Net Neutrality, different rules & structures on interconnection and wholesale). Telecoms operators also still tend to be organised along these lines. Below this, we have grouped the main distribution opportunities into Voice, Messaging, Narrowband and Broadband. Again, this reflects typical Telco product line divisions. Below this, there are two broad types of distribution opportunities:

  • Distribution through the same user device as the Telco core services:
  • Distribution through a separate dedicated device (generally part of upstream third-party provider’s offer)
Key:
distribution%20block%20chart%20key%20dec%202009.png
Figure 3: Main Distribution Opportunities Schematic
distribution%20block%20chart%20main%20dec%202009.png

The “opportunity blocks” in more detail:

Wired

  • 0800 & Premium (access element): This is the “call charge” element of any inbound call service. It excludes ‘1-sided’ premium services offered directly by the Telco (no upstream third-party provider)
  • Fixed Broadband ‘slice & dice’: This includes a host of 2-sided business models that extract additional revenues from third parties looking to serve subscribers. Some of these are illustrated in figure 4 below.
  • Fixed Broadband ‘comes with’: Telco’s offer discounted prepaid broadband packages (e.g. 1 year broadband subscription) to hardware distributors who package this with their products (primarily PCs, but could also be a games console or media device).

Wireless

  • 0800 & Premium (access element): As for fixed voice. Although most mobile operators still charge users for accessing 0800 numbers, this is expected to change as mobile interconnection rates converge with fixed line interconnection. This should give freephone a new lease of life.
  • Mobile Broadband ‘slice & dice’: This includes a host of 2-sided business models that extract additional revenues from third parties looking to serve their mobile subscribers. Some of these are illustrated in figure 4 below.
  • Dedicated Broadband Device ‘comes with’: Telco’s’ offer discounted prepaid broadband packages (e.g. 1 year broadband subscription) to device distributors who package this with their products (laptops, dedicated application-specific devices). WIMAX is also expected to support many 2-sided business models, some of which are illustrated in figure 4 below.
  • Narrowband M2M: Machine-to-machine connectivity is expected to grow dramatically. These connections support devices that users do not interact directly with (smart meters, cars, remote sensors).
  • Application-specific narrowband devices: These dedicated devices support consumer services such as Kindle and business applications such as electronic point of sale. Services to upstream third-party providers may be flat rate or usage based.
  • Application-specific messaging devices: Twitterpeek is an example of this (in this case there are “comes with” and “subscription” options.
  • Bulk SMS / MMS, Short codes, Free and Premium SMS: Person-to-application and application-to-person messaging has grown rapidly and is expected to continue growing through the adoption of communications enabled business processes. The falling cost of messaging and its ubiquity make this a powerful tool for businesses to interact with users.

Many potential services within the opportunities shown above do not yet exist and may also be difficult to implement today, given technological and regulatory constraints. For example, the term “slice and dice” includes all sorts of 2-sided business models (see figure 4).

Figure 4: Fixed and mobile broadband ‘Slice and Dice’ examples (not exhaustive)

Application area

Description

Example

Sender pays:
Electronic content distribution
Targeted at users with pre-pay, low-cap or no-cap data plans.  This service essentially provides out-of-plan access to specific content or services.  Service or content provider may adopt a mix of revenue models to achieve a return (ad-funded, user subscription, freemium model).

A pre-pay mobile subscriber wishes to download a free video promoting a new film.  Their device is capable of viewing this but the subscriber does not wish to use their limited credits.  The film promoter therefore pays for delivery.  Note: for the promoter to only use this service for pre-pay customers, they would need to access customer data.  This would be a B2B VAS platform service.

Mobile Offload:
Fixed operator
service to MNOs

Managed service that enables mobile operators to offload high-volume traffic (particularly indoor traffic) onto fixed broadband through managed service over Wifi/Femtocell. This service concept is described in more detail in the Broadband End Games Strategy Report.

Mobile operator Crunchcom is finding that users are exploiting their unlimited data plans on their devices at home.  Network capacity needs and the associated capital investment are growing far too fast.  Fixed broadband operator Loadsapipe offers Crunchcom a managed offload service to move traffic onto the fixed broadband network.

Clever Roaming:
Transitory service
Innovative data-only pre-pay roaming packages targeted to upstream third-party providers of content and services to visitors without a local service.  These include application-specific, location-specific, constrained bit-rate, and time-based services (e.g. 1 week unlimited).

Electronic version of the Rough Guide to Liverpool includes a roaming service that enables any user (regardless of home network) to access free of charge;  local information, videos, music and offers to local attractions.   Restricted roaming service is provided to Rough Guides by UK mobile operator.  Rough guides recovers cost through guide charges, advertising and revenue share.

QoS  bandwidth:
Video Streaming
The broadband provider offers an SLA to the upstream third-party provider for guaranteeing throughput for a streaming service.  The SLA also requires provision of B2B VAS services on performance monitoring and delivery reporting. Variations: Freemium model (HD-only charged, peak congestion times charged).

NewTube experiences peak hour congestion on MNQSNN[1] ISP.  NewTube agrees to pay a one-off annual fee to ISP for a 99% peak hour delivery guarantee. Congestion radically reduces.  Reporting required to monitor SLA is B2B VAS platform service and charged separately.

Low latency: Real-time cloud
apps

SLA offered to upstream third-party provider on minimal latency for applications such as gaming and cloud-based business applications.

Web-based provider of interactive on-line collaborative tools requires low latency connection to multiple external users.  Broadband operator offers SLA for all customers (including wholesale) on its network. Reporting required to monitor SLA is B2B VAS platform service and charged separately.

Volume:
Very large file
transfer (XXGb)

Sending party pays for “special delivery” of very large data files that would normally exceed consumers’ cap/fair use policy.   Also could apply for upstream third-party volumes (legitimate P2P apps, home monitoring).

National Geographic channel is offering pay-per-view HD videos.  However, many customers of Gotcha ISP would breach their 5Gb quota and so National Geographic pays Gotcha a one-off fee for a national “waiver” so that their videos do not count towards the user “cap”. 

[1] Maybe Not Quite So Net Neutral

Guaranteed income?

In theory, Telco’s’ do not need to develop the B2B VAS platforms and associated services in order to secure distribution revenues. The distribution service are extensions of core Telco offerings that could be provided as ‘dumb pipes’. However, as illustrated in the above examples, in practice both B2B VAS platform and distribution often need to come together. It would be complacent for the industry to assume that distribution revenues are inevitable. Many of these distribution services will be of limited interest (and therefore not achieve their potential) if they only cover a small proportion of end users in a given market. Furthermore, the ability of operators to capture the full potential value from distribution will be heavily constrained if they are only able to offer these as a commodity.


Full Article: LTE: Late, Tempting, and Elusive

Summary: To some, LTE is the latest mobile wonder technology – bigger, faster, better. But how do institutional investors see it?

AreteThis is a Guest Briefing from Arete Research, a Telco 2.0™ partner specialising in investment analysis.

The views in this article are not intended to constitute investment advice from Telco 2.0™ or STL Partners. We are reprinting Arete’s Analysis to give our customers some additional insight into how some Investors see the Telecoms Market.

For further information please contact:

Richard Kramer, Analyst
richard.kramer@arete.net
+44 (0)20 7959 1303


NB. This article can be downloaded in PDF format here or browsed on-screen below.

Wireless Infrastructure

[Figure]

LTE is the new HSPA is the new WCDMA: another wave of new air interfaces, network architectures, and enabled services to add mobile data capacity. From 3G to 3.5G to 4G, vendors are pushing technology into a few “pioneer” operators, hoping to boost sales. Yet, like previous “G’s,” LTE will see minimal near-term sales, requires $1bn+ of R&D per vendor, and promises uncertain returns. The LTE hype is adding costs for vendors that saw margins fall for two years.

Despite large projects in China and India, we see wireless infrastructure sales down 5% in ’09, after 10% growth in ’08. As major 2G rollouts near an end, emerging markets 3G pricing should take to new lows. Some 75% of sales are with four vendors (Ericsson, NSN-Nortel, Huawei, and Alcatel-Lucent), but margins have been falling: we do not see consolidation (like the recent NSN-Nortel deal) structurally improving margins. LTE is another chapter in the story of a fundamentally deflationary market, with each successive generation having a shorter lifecycle and yielding lower sales. We expect a period of heightened (and politicised) competition for a few “strategic accounts,” and fresh attempts to “buy” share (as in NSN-Nortel, or by ZTE).

Late Is Great. We think LTE will roll out later, and in a more limited form than is even now being proposed (after delays at Verizon and others). There is little business case for aggressive deployment, even at CDMA operators whose roadmaps are reaching dead ends. HSPA+ further confuses the picture.

Temptations Galore. Like WCDMA, every vendor thinks it can take market share in LTE. And like WCDMA, we think share shifts will prove limited, and the ensuing fight for deals will leave few winners.

Elusive Economics. LTE demands $1bn in R&D spend over three to five years; with extensive testing and sharing of technical data among leading operators, there is little scope to cut corners (or costs).  LTE rollouts will not improve poor industry margins, and at 2.6GHz, may force network sharing.

Reaching for the Grapes

Table 1 shows aggregate sales, EBITDA, and capex for the top global and emerging markets operators. It reflects a minefield of M&A, currencies, private equity deals, and changes in reporting structure. Getting more complete data is nearly impossible: GSA says there are 284 GSM/WCMDA operators, and CDG claims another 280 in CDMA. We have long found only limited correlation between aggregate capex numbers and OEM sales (which often lag shipments due to revenue recognition). Despite rising data traffic volumes and emerging markets capex, we think equipment vendor sales will fall 5%+ in US$. We think LTE adds risk by bringing forward R&D spend to lock down key customers, but committing OEMs to roll out immature technology with uncertain commercial demand.

Table 1: Sales and Capex Growth, ’05-’09E

  ’05 ’06 ’07 ’08 ’09E
Top 20 Global Operators          
Sales Growth 13% 16% 15% 10% 5%
EBITDA Growth 13% 15% 14% 10% 8%
Capex Growth 10% 10% 5% 9% -1%
Top 25 Emerging Market Operators          
Sales Growth 35% 38% 29% 20% 11%
EBITDA Growth 33% 46% 30% 18% 8%
Capex Growth 38% 29% 38% 25% -12%
Global Capex Total 16% 18% 13% 14% -5%

Source: Arete Research

LaTE for Operators

LTE was pushed by the GSM community in a global standards war against CDMA and WiMAX. Since LTE involves new core and radio networks, and raises the prospect of managing three networks (GSM, WCMDA/HSPA, and LTE), it is a major roadmap decision for conservative operators. Added to this are questions about spectrum, IPR, devices, and business cases. These many issues render moot near-term speculation about timing of LTE rollouts.

Verizon and DoCoMo aside, few operators profess an appetite for LTE’s new radio access products, air interfaces, or early-stage handsets and single-mode datacards. We expect plans for “commercial service” in ’10 will be “soft” launches. Reasons for launching early tend to be qualitative: gaining experience with new technology, or a perception of technical superiority. A look at leading operators shows only a few have clear LTE commitments.

  • Verizon already pushed back its Phase I (fixed access in 20-30 markets) to 2H10, with “rapid deployment” in ’11-’12 at 700MHz, 850MHz, and 1.9GHz bands, and national coverage by ’15, easily met by rolling out at 700Mhz. Arguably, Verizon is driven more by concerns over the end of the CDMA roadmap, and management said it would “start out slow and see what we need to do.”
  • TeliaSonera targets a 2010 data-only launch in two cities (Stockholm and Oslo), a high-profile test between Huawei and Ericsson.
  • Vodafone’s MetroZone concept uses low-cost femto- or micro-cells for urban areas; it has no firm commitment on launching LTE.
  • 3 is focussing on HSPA+, with HSPA datacards in the UK offering 15GB traffic for £15, on one-month rolling contracts.
  • TelefónicaO2 is awaiting spectrum auctions in key markets (Germany, UK) before deciding on LTE; it is sceptical about getting datacards for lower frequencies.
  •  Orange says it is investing in backhaul while it “considers LTE network architectures.”
  • T-Mobile is the most aggressive, aiming for an ’11 LTE rollout to make up for its late start in 3G, and seeks to build an eco-system around VoLGA (Voice over LTE via Generic Access).
  • China Mobile is backing a China-specific version (TD-LTE), which limits the role for Western vendors until any harmonising of standards.
  • DoCoMo plans to launch LTE “sometime” in ’10, but was burnt before in launching WCDMA early. LTE business plans submitted to the Japanese regulator expect $11bn of spend in five years, some at unique frequency bands (e.g., 1.5GHz and 1.7GHz).

LTE’s “commercial availability” marks the start of addressing the issue of handling voice, either via fallback to circuit switched networks, or with VoIP over wireless. The lack of LTE voice means operators have to support three networks, or shut down GSM (better coverage than WCDMA) or WCDMA (better data rates than GSM).  This is a major roadblock to mass market adoption: Operators are unlikely to roll out LTE based on data-only business models. The other hope is that LTE sparks fresh investment in core networks: radio is just 35-40% of Vodafone’s capex and 30% of Orange’s. The rest goes to core, transmission, IT, and other platforms. Yet large OEMs may not benefit from backhaul spend, with cheap wireline bandwidth and acceptance for point-to-multipoint microwave.

HSPA+ is a viable medium-term alternative to LTE, offering similar technical performance and spectral efficiency. (LTE needs, 20MHz vs. 10Mhz for HSPA+.)  There have been four “commercial” HSPA+ launches at 21Mbps peak downlink speeds, and 20+ others are pending. Canadian CDMA operators Telus and Bell (like the Koreans) adopted HSPA only recently. HSPA+ is favoured by existing vendors: it lacks enough new hardware to be an entry point for the industry’s second-tier (Motorola, NEC, and to a lesser extent Alcatel-Lucent), but HSPA+ will also require new devices. There are also further proposed extensions of GSM, quadrupling capacity (VAMOS, introducing MIMO antennas, and MUROS for multiplexing re-use); these too need new handsets.

Vendors say successive 3G and 4G variants require “just a software upgrade.”  This is largely a myth.  With both HSPA+ or LTE, the use of 64QAM brings significant throughput degradation with distance, sharply reducing the cell area that can get 21Mbps service to 15%. MIMO antennas and/or multi-carrier solutions with additional power amplifiers are needed to correct this. While products shipping from ’07 onwards can theoretically be upgraded to 21Mbps downlink, both capacity (i.e., extra carriers) and output power (to 60W+) requirements demand extra hardware (and new handsets). Vendors are only now starting to ship newer multi-mode (GSM, WCDMA, and LTE) platforms (e.g., Ericsson’s RBS6000 or Huawei’s Uni-BTS). Reducing the number of sites to run 2G, 3G, and 4G will dampen overall equipment sales.

Tempting for Vendors

There are three reasons LTE holds such irresistible charm for vendors. First, OEMs want to shift otherwise largely stagnant market shares. Second, vendor marketing does not allow for “fast followers” on technology roadmaps. Leading vendors readily admit claims of 100-150Mpbs throughput are “theoretical” but cannot resist the tendency to technical one-upmanship. Third, we think there will be fewer LTE networks built than in WCDMA, especially at 2.6GHz, as network-sharing concepts take root and operators are capital-constrained. Can the US afford to build 4+ nationwide LTE networks? This scarcity makes it even more crucial for vendors to win deals.

Every vendor expected to gain share in WCDMA. NSN briefly did, but Huawei is surging ahead, while ALU struggled to digest Nortel’s WCDMA unit and Motorola lost ground. Figure 1 shows leading radio vendors’ market share. In ’07, Ericsson and Huawei gained share.  In ’08, we again saw Huawei gain, as did ALU (+1ppt), whereas Ericsson was stable and Motorola and NSN lost ground.

Figure 1: Wireless Infrastructure Market Share, ’07E-’09E

[Figure]

Source: Arete Research; others incl. ZTE, Fujitsu, LG, Samsung, and direct sub-systems vendor sales (Powerwave, CommScope, Kathrein, etc.);
excludes data and transmission sales from Cisco, Juniper, Harris, Tellabs, and others.

While the industry evolved into an oligopoly structure where four vendors control 75% of sales, this has not eased pricing pressure or boosted margins. Ericsson remains the industry no. 1, but its margins are half ’07 levels; meanwhile, NSN is losing money and seeking further scale buying Nortel’s CDMA and LTE assets. Huawei’s long-standing aggressiveness is being matched by ZTE (now with 1,000 staff in EU), and both hired senior former EU execs from vendors such as Nortel and Motorola. Alcatel-Lucent and Motorola are battling to sustain critical mass, with a mix of technologies for each, within ~$5bn revenue business units.

We had forecast Nortel’s 5% share would dwindle to 3% in ’09 (despite part purchase by NSN) and Motorola seems unlikely to get LTE wins it badly needs, after abandoning direct 3G sales. ALU won a slice of Verizon’s LTE rollout (though it may be struggling with its EPC core product), and hopes for a role in China Mobile’s TD-LTE rollouts, but lacks WCDMA accounts to migrate. Huawei’s market share gains came from radio access more than core networks, but we hear it recently won Telefónica for LTE. NSN was late on its HSPA roadmap (to 7.2Mpbs and 14.4Mbps), and lacks traction in packet core. It won new customers in Canada and seeks a role in AT&T’s LTE rollout, but is likely to lose share in ’09. Buying Nortel is a final (further) bid for scale, but invites risks around retaining customers and integrating LTE product lines. Finally, Ericsson’s no. 1 market share looks stable, but it has been forced to respond to fresh lows in pricing from its Asian rivals, now equally adept at producing leading-edge technology, even if their delivery capability is still lagging.

Elusive Economics

The same issues that plagued WCDMA also make LTE elusive: coverage, network performance, terminals, and volume production of standard equipment. Operators have given vendors a list of issues to resolve in networks (esp. around EPC) and terminals. Verizon has its own technical specs relating to transmit output power and receive sensitivity, and requires tri-band support. We think commercialising LTE will require vendors to commit $1bn+ in R&D over three to five years, based on teams of 2-3,000 engineers. LTE comes at a time when every major OEM is seeking €1bn cost savings via restructuring, but must match plunging price levels.

Recent bids at a host of operators across a range of markets (i.e., emerging and developed) show no easing of pricing pressure. As a benchmark, if pricing starts out at 100, final prices may be <50, given “market entry” strategies, bundling within deals, or “gaming” bids to reduce incumbents’ profits at “house accounts.”  Competition remains intense. KDDI has eight vendors pitching for LTE business (Ericsson, NSN, ALU, Hitachi, Motorola, Samsung, Huawei, and NEC), with pricing “very important.”  Telefónica just awarded a radio and core network LTE deal to Huawei, which has been joined by ZTE in getting large Chinese orders and accessing ample export credit financing (as has Ericsson, via Sweden’s EKN).

Operators are pressuring vendors to add capacity at low incremental costs, with ever more sophisticated purchasing: Vodafone has a Luxembourg office that has run 3,000+ e-auctions; China Unicom did the same for 3G, squeezing prices. Operators are also hiring third-party benchmarking firms, which help unpack complex “black box” software pricing models.

It is no coincidence that every OEM saw a sharp structural decline in profitability during ’07, and none had recovered margins by 1Q09. (We cannot chart this precisely, since ALU, NSN, and others do not disclose wireless equipment-only profits, but Ericsson’s Networks margins offer a clear proxy.)  Vendors’ ongoing restructuring has not rid the industry of overcapacity, only shifted it down the value chain. Every OEM needs 50%+ of its cost base in low-cost countries by decade’s end. While ALU’s and NSN’s painful experience hardly recommends it, some M&A (or partial closures) has already begun with Nortel, and must spread to Motorola.

It took Ericsson six years of commercial WCMDA shipments before it neared the level of 2G sales: Indeed, WCDMA base station shipments surpassed GSM in 1Q09, driven by China (with APAC now 40% of the WCDMA market). Figure 2 shows our view that each successive wireless infrastructure generation yields a smaller addressable market, thanks in part to pricing. GSM sales peaked in ’08 and could fall 15% in ’09 as unit shipments peak, then drop sharply in ’11/’12. In WCDMA, shipments should rise 25% in ’09, but sales are likely to increase just 8-10%, led by the US and China, peaking in ’13/’14 on low-cost emerging markets deals.

Figure 2: Deflation and Delays in Successive Technology Generations

[Figure]

Source: Arete Research

We thought there were 300-400k Node Bs shipped by mid-’09; this may surpass 1m by YE’09 but seems unlikely to scale to the 3-4m cumulative GSM BTS deployed. The shrinking of addressable markets between generations and the shift to emerging markets invites further cost pressure. Speeding up LTE may leave a “hole” in OEM earnings.

There are no more “easy wins” for OEMs to boost margins from product re-design or squeezing suppliers. Sub-systems vendors like Powerwave and Commscope are struggling and can no longer afford to make product variants for each OEM. Ancillary costs (commodities, transport, energy) remain volatile and OEMs are often contractually obliged to deliver cost savings under managed services deals. Scores of smaller chipmakers have LTE basebands for base stations, but TI still has 80%+ market share. Cost pressures forced OEMs to adopt third-party products for femto-cells and WiMax. LTE aside, all OEMs are seeking project- and services-led deals (a trend we saw back in Managed Services: Gangland Warfare? June ’06). While it “locks in” customers, this people-intensive approach inherently lacks operating leverage.

LTE also awaits spectrum allocations (2.6GHz, digital dividend, or re-farming of 900MHz) that could affect industry economics, or tilt them towards HSPA+. This wide range of frequency bands limits scale economies and adds RF costs to devices. Terminals are a final challenge: Industry R&D staff were gushing about HSPA-enabled tablet devices back in mid-’07, yet they are only coming at YE’09 or by mid-’10. The same applies to “visionary” LTE device strategies: after a year of single-mode datacards (stretching into ’11), multi-mode handsets might come, followed by CE products with slots for SIM cards (or software solutions for this). Adding LTE modems to all CE devices is cost-prohibitive, and would require new business models from operators, with several iterations needed to cut chipset costs.

IPR remains a contentious and unresolved issue in both LTE and WiMax; QCOM and IDCC declarations to ETSI were preliminary filings; some have already expired, some have continuations, and some got re-filed. Many LTE IPR holders have not yet shown their hand, much like WiMax, where numerous key companies are not in Intel’s Open Patent Alliance. A sizable number of handset OEMs are working on their own LTE chipsets to build up IPR and avoid future royalties. NGNM speaks for 14 operators, many of whom also have their own IPR portfolios. Ground rules are unclear: will there be FRAND in LTE?

Coping with Traffic

Operators have numerous low-cost ways to add capacity (coding schemes, offloading traffic, adding carriers, etc.). We hear line cards for second carriers in a Node B cost as little as €2,000, before (controversial) associated software costs, which OEMs hoped would scale with subscribers, traffic, and speeds, but operators sought to contractually “cap.”  Most Node Bs are still not capable of handling 7.2Mbps.  Operators are also shifting investment from radio capacity (now in ample supply) to backhaul (which scales more directly with traffic), and seek to avoid new cells (a.k.a. “densification”), which add costs for rent, power, and maintenance. GSM micro-cells were deployed for coverage, but operators will not build 5,000+ 3G micro-cells. Vodafone said ~10% of its sites generate ~50% of its data traffic. On average, 3G networks are currently 10-20% utilised; only “hotspots” (airports, key metro hubs) are near 50–60%. We think mobile broadband depends in part on use of, and integration with, fixed broadband.  This “offload” makes more sense as 3G network traffic originates from “immobile” PCs using USB modems, near a fixed line connection.

Is There a Role for WiMax?

After three years of hype and delays, WiMax is finally getting deployed, with Clearwire, Yota (a Russian Greenfield operator with 75K subs), and UCOM (backed by KDDI, with 8,000 free trial subs) the highest-profile launches. Efforts to cut chipset costs are ongoing. Intel is moving to 45nm in ’10, and its rivals, e.g., Sequans, Beceem, and GCT, are seeing volumes ramp. WiMax chipsets are now $35-50, and must drop under $20 in ‘10 to match HSPA roadmaps. IOT should get easier as 802.16e networks become common, and more devices emerged at May ’09’s Computex fair. The roster of infrastructure vendors is seeing ALU and NSN retreat, leaving Motorola, Alvarion, Samsung, and possibly Cisco (for enterprise networks). Spectrum allocations remain uneven, with most new projects in emerging markets using WiMax as a DSL substitute. WiMax IPR remains controversial, fragmented, and lacking basic ground rules (i.e., FRAND). Intel has not won over potential heavyweight claimants like Qualcomm or Nokia in its Open Patent Alliance. As a data-only service, WiMax has a narrow window in which to reach critical mass before LTE rollouts subsume it. There remain too many differences between LTE and WiMax (frame structure, uplink transmission format, FDD vs. TDD, etc.) to merge them.

One long-promised solution is femto-cells, as part of so-called patch networks, which shift and intelligently re-route traffic onto fixed networks. Femto-cells have been through seemingly endless trials covering issues of distribution, support, network management, pricing, and customer propositions. As ever, femto-cells sit on the cusp of large-scale rollouts (due in ’10 or later) that depend on pricing and whether operators also have converged offerings. Regional incentives vary: The US needs coverage and to limit use of repeaters, Europe needs to ease congestion for specific users, and Japan might use femto-cells to integrate home devices.

All operators are targeting structurally lower capex/sales ratios. In emerging markets, the “mini-boom” in ’08 spending in Russia and Latin America is over. Attention is shifting to hotly contested 3G rollouts in China and India, both highly fragmented markets. India has six large established operators and half a dozen other projects, while China is split by technologies, provinces, and operators. Without over-engineering for “five nines” reliability, will developing world 3G be as profitable as GSM or CDMA? We already saw pricing fall by 30-50% in successive rounds of bids for China Unicom’s vast 3G rollout deal.

Will Anyone Get the Grapes?

Standing back from the hype, we struggle to see who really wants LTE to come in a hurry: Verizon and others are highly profitable, and have years to harvest cash flows from existing networks. Vendors’ R&D teams cannot resist the siren song of a wholly new technology, despite blindingly obvious drawbacks. None of these groups has excess cash to burn, though some are trying to force an end-game (as seen by NSN’s attempt to increase its relevance to US operators by buying Nortel). There is no doubt that wireless infrastructure is a deflationary industry; its last great success at rebuilding margins came from shifting costs onto a now moribund supply chain. We expect LTE and the NSN-Nortel deal (and another likely move involving Motorola) to usher in a period of highly political competition for “strategic accounts” and fresh attempts to “buy” share.


AreteThis is a Guest Briefing from Arete Research, a Telco 2.0™ partner specialising in investment analysis.

The views in this article are not intended to constitute investment advice from Telco 2.0™ or STL Partners. We are reprinting Arete’s Analysis to give our customers some additional insight into how some Investors see the Telecoms Market.

For further information please contact:

Richard Kramer, Analyst
richard.kramer@arete.net
+44 (0)20 7959 1303


IMPORTANT DISCLOSURES

For important disclosure information regarding the companies in this report, please call +44 (0)207 959 1300, or send an email to michael.pizzi@arete.net.

This publication was produced by Arete Research Services LLP (“Arete”) and is distributed in the US by Arete Research, LLC (“Arete LLC”).

Arete’s Rating System. Long (L), Neutral (N), Short (S). Analysts recommend stocks as Long or Short for inclusion in Arete Best Ideas, a monthly publication consisting of the firm’s highest conviction recommendations. Being assigned a Long or Short rating is determined by a stock’s absolute return potential and other factors, which may include share liquidity, debt refinancing, estimate risk, economic outlook of principal countries of operation, or other company or industry considerations. Any stock not assigned a Long or Short rating for inclusion in Arete Best Ideas is deemed to be Neutral. A stock’s return potential represents the difference between the current stock price and the target price.

Arete’s Recommendation Distribution.  As of 31 March 2009, research analysts at Arete have recommended 20.9% of issuers covered with Long (Buy) ratings, 14.9% with Short (Sell) ratings, with the remaining 64.2% (which are not included in Arete Best Ideas) deemed Neutral. A list of all stocks in each coverage group can be found at www.arete.net.

Required Disclosures. Analyst Certification: the research analyst(s) whose name(s) appear(s) on the front cover of this report certify that: all of the views expressed in this report accurately reflect their personal views about the subject company or companies and its or their securities, and that no part of their compensation was, is, or will be, directly or indirectly, related to the specific recommendations or views expressed in this report.

Research Disclosures. Arete Research Services LLP (“Arete”) provides investment advice for eligible counterparties and professional clients. Arete receives no compensation from the companies its analysts cover, does no investment banking, market making, money management or proprietary trading, derives no compensation from these activities and will not engage in these activities or receive compensation for these activities in the future. Arete’s analysts are based in London, authorized and regulated by the UK’s Financial Services Authority (“FSA”); they are not registered as research analysts with FINRA. Additionally, Arete’s analysts are not associated persons and therefore are not subject to Rule 2711 restrictions on communications with a subject company, public appearances and trading securities held by a research analyst account. Arete restricts the distribution of its research services to approved persons only.

Reports are prepared for non-private customers using sources believed to be wholly reliable and accurate but which cannot be warranted as to accuracy or completeness. Opinions held are subject to change without prior notice. No Arete director, employee or representative accepts liability for any loss arising from the use of any advice provided. Please see www.arete.net for details of any interests held by Arete representatives in securities discussed and for our conflicts of interest policy.

© Arete Research Services LLP 2009. All rights reserved. No part of this report may be reproduced or distributed in any manner without Arete’s written permission. Arete specifically prohibits the re-distribution of this report and accepts no liability for the actions of third parties in this respect.

Arete Research Services LLP, 27 St John’s Lane, London, EC1M 4BU, Tel: +44 (0)20 7959 1300
Registered in England: Number OC303210
Registered Office: Fairfax House, 15 Fulwood Place, London WC1V 6AY
Arete Research Services LLP is authorized and regulated by the Financial Services Authority

US Distribution Disclosures. Distribution in the United States is through Arete Research, LLC (“Arete LLC”), a wholly owned subsidiary of Arete, registered as a broker-dealer with the Securities and Exchange Commission (SEC) and the Financial Industry Regulatory Authority (FINRA). Arete LLC is registered for the purpose of distributing third-party research. It employs no analysts and conducts no equity research. Additionally, Arete LLC conducts no investment banking, market making, money management or proprietary trading, derives no compensation from these activities and will not engage in these activities or receive compensation for these activities in the future. Arete LLC accepts responsibility for the content of this report.

Section 28(e) Safe Harbor.  Arete LLC has entered into commission sharing agreements with a number of broker-dealers pursuant to which Arete LLC is involved in “effecting” trades on behalf of its clients by agreeing with the other broker-dealer that Arete LLC will monitor and respond to customer comments concerning the trading process, which is one of the four minimum functions listed by the Securities and Exchange Commission in its latest guidance on client commission practices under Section 28(e). Arete LLC encourages its clients to contact Anthony W. Graziano, III (+1 617 357 4800 or anthony.graziano@arete.net) with any comments or concerns they may have concerning the trading process.

Arete Research LLC, 3 Post Office Square, 7th Floor, Boston, MA 02109, Tel: +1 617 357 4800

LTE: Late, Tempting, and Elusive

Summary: To some, LTE is the latest mobile wonder technology – bigger, faster, better. But how do institutional investors see it?

AreteThis is a Guest Briefing from Arete Research, a Telco 2.0™ partner specialising in investment analysis.

The views in this article are not intended to constitute investment advice from Telco 2.0™ or STL Partners. We are reprinting Arete’s Analysis to give our customers some additional insight into how some Investors see the Telecoms Market.

[Members of the Telo 2.0TM Executive Briefing Subscription Service and Future Networks Stream, please see here for the full Briefing report. Non-Members, please see here for how to subscribe or email contact@telco2.net or call +44 (0) 207 247 5003.]

Wireless Infrastructure

[Figure]

LTE is the new HSPA is the new WCDMA: another wave of new air interfaces, network architectures, and enabled services to add mobile data capacity. From 3G to 3.5G to 4G, vendors are pushing technology into a few “pioneer” operators, hoping to boost sales. Yet, like previous “G’s,” LTE will see minimal near-term sales, requires $1bn+ of R&D per vendor, and promises uncertain returns. The LTE hype is adding costs for vendors that saw margins fall for two years.

Despite large projects in China and India, we see wireless infrastructure sales down 5% in ’09, after 10% growth in ’08. As major 2G rollouts near an end, emerging markets 3G pricing should take to new lows. Some 75% of sales are with four vendors (Ericsson, NSN-Nortel, Huawei, and Alcatel-Lucent), but margins have been falling: we do not see consolidation (like the recent NSN-Nortel deal) structurally improving margins. LTE is another chapter in the story of a fundamentally deflationary market, with each successive generation having a shorter lifecycle and yielding lower sales. We expect a period of heightened (and politicised) competition for a few “strategic accounts,” and fresh attempts to “buy” share (as in NSN-Nortel, or by ZTE).

Late Is Great. We think LTE will roll out later, and in a more limited form than is even now being proposed (after delays at Verizon and others). There is little business case for aggressive deployment, even at CDMA operators whose roadmaps are reaching dead ends. HSPA+ further confuses the picture.

Temptations Galore. Like WCDMA, every vendor thinks it can take market share in LTE. And like WCDMA, we think share shifts will prove limited, and the ensuing fight for deals will leave few winners.

Elusive Economics. LTE demands $1bn in R&D spend over three to five years; with extensive testing and sharing of technical data among leading operators, there is little scope to cut corners (or costs).  LTE rollouts will not improve poor industry margins, and at 2.6GHz, may force network sharing.

Reaching for the Grapes

Table 1 shows aggregate sales, EBITDA, and capex for the top global and emerging markets operators. It reflects a minefield of M&A, currencies, private equity deals, and changes in reporting structure. Getting more complete data is nearly impossible: GSA says there are 284 GSM/WCMDA operators, and CDG claims another 280 in CDMA. We have long found only limited correlation between aggregate capex numbers and OEM sales (which often lag shipments due to revenue recognition). Despite rising data traffic volumes and emerging markets capex, we think equipment vendor sales will fall 5%+ in US$. We think LTE adds risk by bringing forward R&D spend to lock down key customers, but committing OEMs to roll out immature technology with uncertain commercial demand.

Table 1: Sales and Capex Growth, ’05-’09E

  ’05 ’06 ’07 ’08 ’09E
Top 20 Global Operators          
Sales Growth 13% 16% 15% 10% 5%
EBITDA Growth 13% 15% 14% 10% 8%
Capex Growth 10% 10% 5% 9% -1%
Top 25 Emerging Market Operators          
Sales Growth 35% 38% 29% 20% 11%
EBITDA Growth 33% 46% 30% 18% 8%
Capex Growth 38% 29% 38% 25% -12%
Global Capex Total 16% 18% 13% 14% -5%

Source: Arete Research

LaTE for Operators

LTE was pushed by the GSM community in a global standards war against CDMA and WiMAX. Since LTE involves new core and radio networks, and raises the prospect of managing three networks (GSM, WCMDA/HSPA, and LTE), it is a major roadmap decision for conservative operators. Added to this are questions about spectrum, IPR, devices, and business cases. These many issues render moot near-term speculation about timing of LTE rollouts.

Verizon and DoCoMo aside, few operators profess an appetite for LTE’s new radio access products, air interfaces, or early-stage handsets and single-mode datacards. We expect plans for “commercial service” in ’10 will be “soft” launches. Reasons for launching early tend to be qualitative: gaining experience with new technology, or a perception of technical superiority. A look at leading operators shows only a few have clear LTE commitments.

  • Verizon already pushed back its Phase I (fixed access in 20-30 markets) to 2H10, with “rapid deployment” in ’11-’12 at 700MHz, 850MHz, and 1.9GHz bands, and national coverage by ’15, easily met by rolling out at 700Mhz. Arguably, Verizon is driven more by concerns over the end of the CDMA roadmap, and management said it would “start out slow and see what we need to do.”
  • TeliaSonera targets a 2010 data-only launch in two cities (Stockholm and Oslo), a high-profile test between Huawei and Ericsson.
  • Vodafone’s MetroZone concept uses low-cost femto- or micro-cells for urban areas; it has no firm commitment on launching LTE.
  • 3 is focussing on HSPA+, with HSPA datacards in the UK offering 15GB traffic for £15, on one-month rolling contracts.
  • TelefónicaO2 is awaiting spectrum auctions in key markets (Germany, UK) before deciding on LTE; it is sceptical about getting datacards for lower frequencies.
  •  Orange says it is investing in backhaul while it “considers LTE network architectures.”
  • T-Mobile is the most aggressive, aiming for an ’11 LTE rollout to make up for its late start in 3G, and seeks to build an eco-system around VoLGA (Voice over LTE via Generic Access).
  • China Mobile is backing a China-specific version (TD-LTE), which limits the role for Western vendors until any harmonising of standards.
  • DoCoMo plans to launch LTE “sometime” in ’10, but was burnt before in launching WCDMA early. LTE business plans submitted to the Japanese regulator expect $11bn of spend in five years, some at unique frequency bands (e.g., 1.5GHz and 1.7GHz).

LTE’s “commercial availability” marks the start of addressing the issue of handling voice, either via fallback to circuit switched networks, or with VoIP over wireless. The lack of LTE voice means operators have to support three networks, or shut down GSM (better coverage than WCDMA) or WCDMA (better data rates than GSM).  This is a major roadblock to mass market adoption: Operators are unlikely to roll out LTE based on data-only business models. The other hope is that LTE sparks fresh investment in core networks: radio is just 35-40% of Vodafone’s capex and 30% of Orange’s. The rest goes to core, transmission, IT, and other platforms. Yet large OEMs may not benefit from backhaul spend, with cheap wireline bandwidth and acceptance for point-to-multipoint microwave.

HSPA+ is a viable medium-term alternative to LTE, offering similar technical performance and spectral efficiency. (LTE needs, 20MHz vs. 10Mhz for HSPA+.)  There have been four “commercial” HSPA+ launches at 21Mbps peak downlink speeds, and 20+ others are pending. Canadian CDMA operators Telus and Bell (like the Koreans) adopted HSPA only recently. HSPA+ is favoured by existing vendors: it lacks enough new hardware to be an entry point for the industry’s second-tier (Motorola, NEC, and to a lesser extent Alcatel-Lucent), but HSPA+ will also require new devices. There are also further proposed extensions of GSM, quadrupling capacity (VAMOS, introducing MIMO antennas, and MUROS for multiplexing re-use); these too need new handsets.

Vendors say successive 3G and 4G variants require “just a software upgrade.”  This is largely a myth.  With both HSPA+ or LTE, the use of 64QAM brings significant throughput degradation with distance, sharply reducing the cell area that can get 21Mbps service to 15%. MIMO antennas and/or multi-carrier solutions with additional power amplifiers are needed to correct this. While products shipping from ’07 onwards can theoretically be upgraded to 21Mbps downlink, both capacity (i.e., extra carriers) and output power (to 60W+) requirements demand extra hardware (and new handsets). Vendors are only now starting to ship newer multi-mode (GSM, WCDMA, and LTE) platforms (e.g., Ericsson’s RBS6000 or Huawei’s Uni-BTS). Reducing the number of sites to run 2G, 3G, and 4G will dampen overall equipment sales.

Tempting for Vendors

There are three reasons LTE holds such irresistible charm for vendors. First, OEMs want to shift otherwise largely stagnant market shares. Second, vendor marketing does not allow for “fast followers” on technology roadmaps. Leading vendors readily admit claims of 100-150Mpbs throughput are “theoretical” but cannot resist the tendency to technical one-upmanship. Third, we think there will be fewer LTE networks built than in WCDMA, especially at 2.6GHz, as network-sharing concepts take root and operators are capital-constrained. Can the US afford to build 4+ nationwide LTE networks? This scarcity makes it even more crucial for vendors to win deals.

Every vendor expected to gain share in WCDMA. NSN briefly did, but Huawei is surging ahead, while ALU struggled to digest Nortel’s WCDMA unit and Motorola lost ground. Figure 1 shows leading radio vendors’ market share. In ’07, Ericsson and Huawei gained share.  In ’08, we again saw Huawei gain, as did ALU (+1ppt), whereas Ericsson was stable and Motorola and NSN lost ground.

Figure 1: Wireless Infrastructure Market Share, ’07E-’09E

[Figure]

Source: Arete Research; others incl. ZTE, Fujitsu, LG, Samsung, and direct sub-systems vendor sales (Powerwave, CommScope, Kathrein, etc.);
excludes data and transmission sales from Cisco, Juniper, Harris, Tellabs, and others.

While the industry evolved into an oligopoly structure where four vendors control 75% of sales, this has not eased pricing pressure or boosted margins. Ericsson remains the industry no. 1, but its margins are half ’07 levels; meanwhile, NSN is losing money and seeking further scale buying Nortel’s CDMA and LTE assets. Huawei’s long-standing aggressiveness is being matched by ZTE (now with 1,000 staff in EU), and both hired senior former EU execs from vendors such as Nortel and Motorola. Alcatel-Lucent and Motorola are battling to sustain critical mass, with a mix of technologies for each, within ~$5bn revenue business units.

We had forecast Nortel’s 5% share would dwindle to 3% in ’09 (despite part purchase by NSN) and Motorola seems unlikely to get LTE wins it badly needs, after abandoning direct 3G sales. ALU won a slice of Verizon’s LTE rollout (though it may be struggling with its EPC core product), and hopes for a role in China Mobile’s TD-LTE rollouts, but lacks WCDMA accounts to migrate. Huawei’s market share gains came from radio access more than core networks, but we hear it recently won Telefónica for LTE. NSN was late on its HSPA roadmap (to 7.2Mpbs and 14.4Mbps), and lacks traction in packet core. It won new customers in Canada and seeks a role in AT&T’s LTE rollout, but is likely to lose share in ’09. Buying Nortel is a final (further) bid for scale, but invites risks around retaining customers and integrating LTE product lines. Finally, Ericsson’s no. 1 market share looks stable, but it has been forced to respond to fresh lows in pricing from its Asian rivals, now equally adept at producing leading-edge technology, even if their delivery capability is still lagging.

Elusive Economics

The same issues that plagued WCDMA also make LTE elusive: coverage, network performance, terminals, and volume production of standard equipment. Operators have given vendors a list of issues to resolve in networks (esp. around EPC) and terminals. Verizon has its own technical specs relating to transmit output power and receive sensitivity, and requires tri-band support. We think commercialising LTE will require vendors to commit $1bn+ in R&D over three to five years, based on teams of 2-3,000 engineers. LTE comes at a time when every major OEM is seeking €1bn cost savings via restructuring, but must match plunging price levels.

To read the rest of the article, including:

  • Coping with Traffic
  • Is There a Role for WiMax?
  • Will Anyone Get the Grapes?

…Members of the Telco 2.0™ Executive Briefing Service and Future Networks Stream can read on here. Non-Members please see here to subscribe.


AreteThis is a Guest Briefing from Arete Research, a Telco 2.0™ partner specialising in investment analysis.

The views in this article are not intended to constitute investment advice from Telco 2.0™ or STL Partners. We are reprinting Arete’s Analysis to give our customers some additional insight into how some Investors see the Telecoms Market.