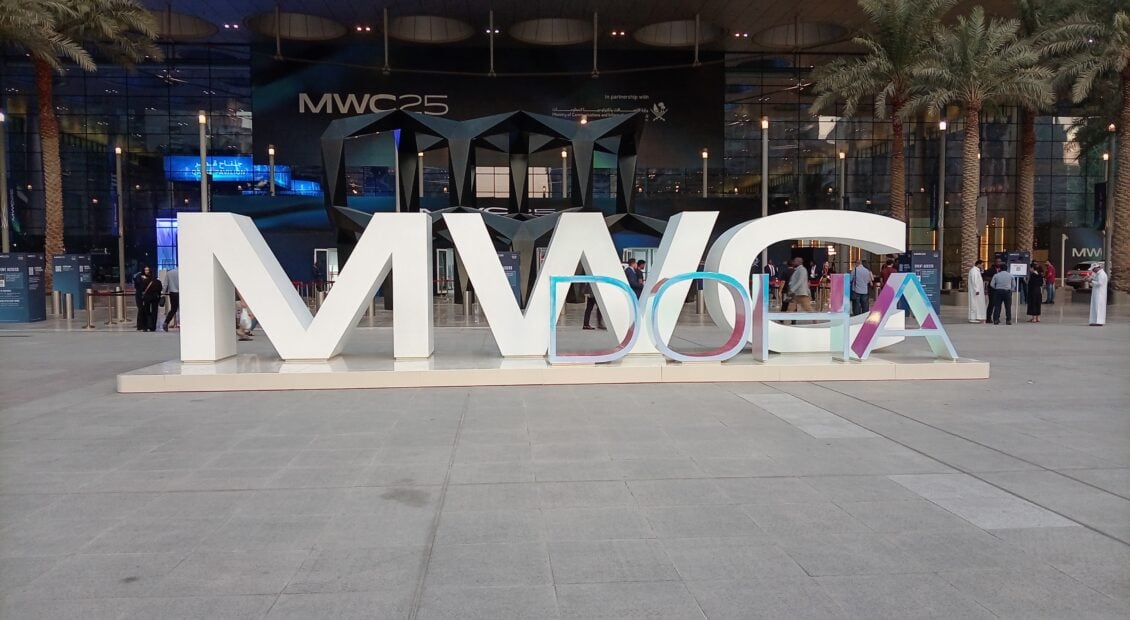
Understanding the unconnected

Introduction

Half the world’s population doesn’t have ready access to the internet. Why not? Surprisingly, it’s not simply a case of not being able to afford it.

In the report, The Coordination Age: A Third Age of Telecoms (November 2018), STL set out the need to make better use of the world’s resources.  These include the necessity and importance of making productive and rewarding use of people, time, health, money, and employment.

Communication is fundamental to co-ordination and cannot be achieved over any distance without effective connectivity, which in the modern world means access to the Internet. Improving connectivity can provide more people with better access to:

  • Useful information and services such as banking, insurance, health, education, and entertainment
  • Person-to-person communication, strengthening ties with families, friends and colleagues.
  • Easier and better access to resources, such as goods and markets, thereby facilitating business and trading, and in turn leading to greater prosperity.

It can also help expand the role of women in society, for example, by providing them with the ability to work or access or provide goods and services from home.

To achieve these aims, and make most efficient use all types of resources, it is important that all of the world’s population should be able to get online, preferably each with their own dedicated connection.

This is the first in a series of reports that looks at the question of how to connect the large part of the world’s population that is not online. This report describes the current situation and the reasons why many remain unconnected, even where there is mobile 3G or 4G coverage.

Enter your details below to request an extract of the report

Economic benefits of broadband

People who are unable to use the Internet are excluded from the range of useful services and activities it provides access to, which include banking, health services, education, information, entertainment, jobs, markets and government services, as well as the benefits of maintaining contact with distant families and friends.  Gaining access to these services by other means is usually more difficult and time consuming, often restricts choice, and is, in some cases, impossible. Exclusion from such services can have a negative effect on people’s ability to earn a living, increase their income or improve their way of life. Although the nature of exclusion and its effects differ between developed and developing economies, the consequences can be remarkably similar.

Moreover, widespread Internet access can support empowerment of women in many societies, not just the most undeveloped and conservative, by allowing them to take a more active part in the economy.

A range of studies has shown that greater access to mobile broadband has a positive impact on GDP as well as on people lives.  Among the most recent, published in 2017, is a study from London’s Imperial College Business School. The results show that a 10 percentage point increase in mobile broadband penetration leads to an increase of between 0.6% and 2.8% in GDP.

A World Bank report from 2009 estimated the relative importance of fixed, mobile, Internet access and broadband in stimulating economies (see Figure 4).

Figure 4: Relative impact on GDP of different communications technologies

Source: World Bank

The GSMA claims that, globally, the mobile telecoms industry accounts for 1.4% of GDP and adds a further 2.5% from productivity gains in the broader economy. In sub-Saharan Africa, mobile broadband contributes 7.1% of GDP, according to the GSMA.

The growth in access to the Internet

Use of the Internet has grown rapidly since the introduction of the World Wide Web and over half the world’s population of 7.6 billion are now users. At the end of 2017, 53% of the world’s population (4 billion people) were Internet users, with 43% (3.3 billion) using mobile networks to gain access to the Internet, according to the GSMA. There are also about one billion fixed broadband connections worldwide, but these mostly duplicate mobile data coverage in advanced developed economies, according to the ITU.  Note, that fixed line connections generally support multiple users in a household. Still, approximately 700 million people get online by using shared connections, including the facilities offered by public libraries or Internet cafes, according to the ITU. That means there are now approximately four billion Internet users worldwide.

The overall level of Internet use and the proportion of people connected by mobile in the major regions of the world are shown in Figure 5, which highlights how most Internet users gain access to the Internet through mobile networks.  As discussed, the remainder either have fixed broadband access to their household, make use of Internet cafes, libraries and other public points of access, or share with members of their family or friends.  Figure 5 highlights how the majority of people in the populous regions of sub-Saharan Africa and South Asia remain offline.

Figure 5: Total and mobile Internet users by world region

Source: ITU, UNESCO, GSMA, Hootsuite, STL Partners

In total, 47% of the world’s population (approximately 3.6 billion people) do not use the Internet.  Lack of coverage is one reason for this: Approximately 10% of the world’s people live beyond the reach of a mobile network, according to the GSMA. About 87% of the world’s people are covered by 3G networks and, 72% covered by 4G, while the remaining 3% have access to 2G data connections using GPRS or EDGE, with speeds inadequate for all but the most basic applications. The GSMA defines mobile broadband as over 256kbps.  GPRS cannot reach these speeds and EDGE rarely does.  In practice, there are about one billion people not served by a data network that provides adequate throughput speeds.

According to the GSMA, at the end of 2017, there were five billion unique mobile subscribers worldwide, a penetration of 66%. Some 29% of all mobile connections (excluding IoT) were 4G, 31% were 3G and 40% 2G.

Figure 6 shows the proportion of the populations in the major regions that are connected, covered and not connected and not covered or connected. Even in advanced economies in North America and Europe, more than one quarter of the population remains unconnected.

The proportion of the global population covered by mobile broadband networks, but not online, remained largely unchanged for the three years between 2014 and 2017 at about 44% of the world’s population. However, as Figure 6 shows, this proportion varies considerably across regions, ranging from 26% in North America to 57% in South Asia (Bangladesh, India, and Pakistan).  The percentage in sub-Saharan Africa is lower at 38%, but this is partly due to the lower level of mobile broadband coverage, with 40% of the population having no coverage. By comparison, only 16% of the population in South Asia has no mobile broadband coverage. In other words, lack of coverage is not the biggest obstacle in most of the world.

Figure 6: Mobile connected and unconnected population by region

Source: GSMA, STL Partners

Contents:

  • Executive Summary
  • Introduction
  • Economic benefits of broadband
  • The growth in Internet usage
  • Counting the addressable unconnected
  • The reasons why people aren’t online
  • Social and economic drivers of Internet access
  • Regional Internet usage patterns
  • Structural, social and economic differences
  • Reasons why people are not connected
  • Why do people not use mobile broadband?
  • Infrastructure; mobile broadband coverage and electricity
  • Cost of smartphones and mobile data
  • Local content and services
  • Social and cultural factors and education
  • Conclusions and areas for action
  • The connected and the unconnected
  • Infrastructure
  • Connecting the covered
  • Are governments prepared to act?
  • Annex: Regional and country data
  • Asia Pacific
  • Eastern Europe
  • Latin America
  • Middle East and North Africa (MENA)
  • North America
  • Sub-Saharan Africa
  • Western Europe

Figures:

  • Figure 1: Less than half the world’s people have a dedicated Internet connection
  • Figure 2: About 2.8 billion people aged over 11 not using the Internet
  • Figure 3: The growth in the population covered by 3G/4G
  • Figure 4: Relative impact on GDP of different communications technologies
  • Figure 5: Total and mobile Internet users by world region
  • Figure 6: Mobile connected and unconnected population by region
  • Figure 7: Internet penetration of total population by world sub-region
  • Figure 8: HDI and its constituents
  • Figure 9: Global variations in human development
  • Figure 10: Average household sizes by country
  • Figure 11: Key factors influencing broadband take up
  • Figure 12: Global GSMA Mobile Connectivity Index
  • Figure 13: Mobile network coverage by major region
  • Figure 14: Fixed broadband penetration
  • Figure 15: Electricity – percentage access by region
  • Figure 16: Availability of electricity supply in Sub-Saharan Africa (% pop)
  • Figure 17: African countries with largest populations; those with no electricity
  • Figure 18: Smartphone and mobile penetration
  • Figure 19: Examples of cheapest smartphones
  • Figure 20: Affordability index for cheapest Internet-enabled handsets
  • Figure 21: Relative cost of mobile data plans (on a 100-point index) vs. penetration
  • Figure 22: Availability of local services on a 100-point index vs. Internet penetration
  • Figure 23: Literacy and Internet and social media use by sub-region
  • Figure 24: Female access to mobile phone and Internet
  • Figure 25: Proportion of women with access to the Internet in selected MENA states
  • Figure 26: Proportion of women with access to the Internet in Sub-Saharan Africa
  • Figure 27: Asia Pacific overview
  • Figure 28: Asia Pacific country data
  • Figure 29: Eastern Europe overview
  • Figure 30: Eastern Europe country data
  • Figure 31: Latin America overview
  • Figure 32: Latin America country data
  • Figure 33: MENA overview
  • Figure 34: MENA country data
  • Figure 35: North America overview
  • Figure 36: North America country data
  • Figure 37: Sub-Saharan Africa overview
  • Figure 38: Sub-Saharan Africa country data
  • Figure 39: Western Europe overview
  • Figure 40: Western Europe country data

Enter your details below to request an extract of the report

Growing the Digital Economy: Lessons from Brazil, Mexico, and Iran

Introduction

Recent data on the growth of the Internet shows that different public policies have dramatically different impacts. In Latin America, two nations following very similar policies are achieving spectacular success, both in terms of raw quantity and in terms of deeper qualitative improvement, while other countries, sometimes with higher per-capita GDP, pursue different policies and see radically worse results.

In the Middle East, there is evidence of a similar breakout to development in some surprising countries, which turn out to be adopting key elements of the policy mix that has been successful in Latin America.

Renesys, a US company which provides software tools to monitor Border Gateway Protocol BGP routing activity, also collects large amounts of data on the structure of the Internet as a by-product of this activity. In May 2013, they issued a fascinating blog post, which drew attention to the dramatic development gap emerging between – for example – Brazil and Argentina on one hand, and Mexico on the other.

AS numbers: a key metric for Internet participation

What Renesys was looking at was the count of ASNs (Autonomous System Numbers) over time, a measure that we believe gives an excellent and profound indication of the development of the internet.

ASNs identify networks that control their own routing policy and IP address block. The voluntary interconnection of autonomous systems through BGP routing, which is based on AS numbers, makes up the fundamental structure of the Internet. In this sense, counting ASNs is a better metric than counting subscribers, domain names, Web sites, or IP addresses, because it is a measurement of participation in the Internet, not just consumption of cat videos and Google adverts. The creation of new ASNs is evidence that new businesses, organisations, content providers, hosting and cloud computing providers, and ISPs are emerging. It is evidence that technical competence is diffusing through society.

Because an ASN is the entry ticket to Internet peering, it’s also evidence of growing direct interconnection between networks, the fundamental purpose of the Internet, and the source of reliable, resilient, and high-performance service. In important ways, more AS numbers shows not just quantitative growth, but also qualitative improvement.

So how does the scoreboard look?

Figure 1: Brazil & Argentina Lead The Way
Latin America: New ASNs Feb 2014

Source: Renesys data, STL Partners visualisation

Argentina is doing well; Brazil is doing incredibly well; Mexico is either stable, or stagnant. We’ve labelled the chart selectively, so you can also see that among the poorer and smaller Latin American nations, Costa Rica is doing very well while Venezuela is doing poorly.

Mexico’s per-capita GDP at purchasing-power parity was calculated at $15,312 in 2012 dollars by the IMF, whereas Argentina’s was $18,112. But this gap doesn’t explain what’s going on here. Brazil’s was $11,875, and the Brazilian Internet is doing even better. Clearly, money is not enough. Every year, Brazil adds as many ASNs as there are in the whole of Mexico. This is a reflection of vastly different government policy and market structure. Similarly, there doesn’t seem to be any reliable link between population, ASN growth, or how many citizens there are for each ASN, as the following chart shows. Even GDP is a very weak predictor.

Figure 2: Policy, not population or GDP, drives Internet growth
It's not population nor GDP Feb 2014

Source: STL, IMF data, ANATEL


  • Executive Summary
  • What did Brazil get right?
  • A More Democratic Internet: Understanding the Problem from a Latin American Viewpoint
  • A Policy Mix That Supports Innovators
  • What did Mexico and others do wrong?
  • Monopolies lead to inertia
  • State Telecoms: not a great strategy either
  • Taking A Similar View On The Middle East
  • Censorship and Internet Development
  • Wholesale Transit as a Weapon
  • Conclusions
  • About STL Partners


  • Figure 1: Brazil & Argentina Lead The Way
  • Figure 2: Policy, not population or GDP, drives Internet growth
  • Figure 3: Brazil has been adding 700+ new local ISPs a year
  • Figure 4: The Middle East by ASN count
  • Figure 5: Iran’s Internet Flourishes Behind the Firewall
  • Figure 6: In the Middle East, it’s policy that matters too