MobiNEX: The Mobile Network Experience Index, H1 2016

Executive Summary

In response to customers’ growing usage of mobile data and applications, in April 2016 STL Partners developed MobiNEX: The Mobile Network Experience Index, which ranks mobile network operators by key measures relating to customer experience. To do this, we benchmark mobile operators’ network speed and reliability, allowing individual operators to see how they are performing in relation to the competition in an objective and quantitative manner.

Operators are assigned an individual MobiNEX score out of 100 based on their performance across four measures that STL Partners believes to be core drivers of customer app experience: download speed, average latency, error rate and latency consistency (the proportion of app requests that take longer than 500ms to fulfil).

Our partner Apteligent has provided us with the raw data for three out of the four measures, based on billions of requests made from tens of thousands of applications used by hundreds of millions of users in H1 2016. While our April report focused on the top three or four operators in just seven Western markets, this report covers 80 operators drawn from 25 markets spread across the globe in the first six months of this year.

The top ten operators were from Japan, France, the UK and Canada:

  • Softbank JP scores highest on the MobiNEX for H1 2016, with high scores across all measures and a total score of 85 out of 100.
  • Close behind are Bouygues FR (80) and Free FR (79), which came first and second respectively in the Q4 2015 rankings. Both achieve high scores for error rate, latency consistency and average latency, but are slightly let down by download speed.
  • The top six is completed by NTT DoCoMo JP (78), Orange FR (75) and au (KDDI) JP (71).
  • Slightly behind are Vodafone UK (65), EE UK (64), SFR FR (63), O2 UK (62) and Rogers CA (62). Except in the case of Rogers, who score similarly on all measures, these operators are let down by substantially worse download speeds.

The bottom ten operators all score a total of 16 or lower out of 100, suggesting a materially worse customer app experience.

  • Trailing the pack with scores of 1 or 2 across all four measures were Etisalat EG (4), Vodafone EG (4), Smart PH (5) and Globe PH (5).
  • Beeline RU (11) and Malaysian operators U Mobile MY (9) and Digi MY (9) also fare poorly, but benefit from slightly higher latency consistency scores. Slightly better overall, but still achieving minimum scores of 1 for download speed and average latency, are Maxis MY (14) and MTN ZA (12).

Overall, the extreme difference between the top and bottom of the table highlights a vast inequality in network quality customer experience across the planet. Customer app experience depends to a large degree on where one lives. However, our analysis shows that while economic prosperity does in general lead to a more advanced mobile experience as you might expect, it does not guarantee it. Norway, Sweden, Singapore and the US market are examples of high income countries with lower MobiNEX scores than might be expected against the global picture. STL Partners will do further analysis to uncover more on the drivers of differentiation between markets and players within them.


MobiNEX H1 2016 – included markets

MobiNEX H1 2016 – operator scores

 Source: Apteligent, OpenSignal, STL Partners analysis


  • About MobiNEX
  • Changes for H1 2016
  • MobiNEX H1 2016: results
  • The winners: top ten operators
  • The losers: bottom ten operators
  • The surprises: operators where you wouldn’t expect them
  • MobiNEX by market
  • MobiNEX H1 2016: segmentation
  • MobiNEX H1 2016: Raw data
  • Error rate
  • Latency consistency
  • Download speed
  • Average latency
  • Appendix 1: Methodology and source data
  • Latency, latency consistency and error rate: Apteligent
  • Download speed: OpenSignal
  • Converting raw data into MobiNEX scores
  • Setting the benchmarks
  • Why measure customer experience through app performance?
  • Appendix 2: Country profiles
  • Country profile: Australia
  • Country profile: Brazil
  • Country profile: Canada
  • Country profile: China
  • Country profile: Colombia
  • Country profile: Egypt
  • Country profile: France
  • Country profile: Germany
  • Country profile: Italy
  • Country profile: Japan
  • Country profile: Malaysia
  • Country profile: Mexico
  • Country profile: New Zealand
  • Country profile: Norway
  • Country profile: Philippines
  • Country profile: Russia
  • Country profile: Saudi Arabia
  • Country profile: Singapore
  • Country profile: South Africa
  • Country profile: Spain
  • Country profile: United Arab Emirates
  • Country profile: United Kingdom
  • Country profile: United States
  • Country profile: Vietnam


  • Figure 1: MobiNEX scoring breakdown, benchmarks and raw data used
  • Figure 2: MobiNEX H1 2016 – included markets
  • Figure 3: MobiNEX H1 2016 – operator scores breakdown (top half)
  • Figure 4: MobiNEX H1 2016 – operator scores breakdown (bottom half)
  • Figure 5: MobiNEX H1 2016 – average scores by country
  • Figure 6: MobiNEX segmentation dimensions
  • Figure 7: MobiNEX segmentation – network speed vs reliability
  • Figure 8: MobiNEX segmentation – network speed vs reliability – average by market
  • Figure 9: MobiNEX vs GDP per capita – H1 2016
  • Figure 10: MobiNEX vs smartphone penetration – H1 2016
  • Figure 11: Error rate per 10,000 requests, H1 2016 – average by country
  • Figure 12: Error rate per 10,000 requests, H1 2016 (top half)
  • Figure 13: Error rate per 10,000 requests, H1 2016 (bottom half)
  • Figure 14: Requests with total roundtrip latency > 500ms (%), H1 2016 – average by country
  • Figure 15: Requests with total roundtrip latency > 500ms (%), H1 2016 (top half)
  • Figure 16: Requests with total roundtrip latency > 500ms (%), H1 2016 (bottom half)
  • Figure 17: Average weighted download speed (Mbps), H1 2016 – average by country
  • Figure 18: Average weighted download speed (Mbps), H1 2016 (top half)
  • Figure 19: Average weighted download speed (Mbps), H1 2016 (bottom half)
  • Figure 20: Average total roundtrip latency (ms), H1 2016 – average by country
  • Figure 21: Average total roundtrip latency (ms), H1 2016 (top half)
  • Figure 22: Average total roundtrip latency (ms), H1 2016 (bottom half)
  • Figure 23: Benchmarks and raw data used

MobiNEX: The Mobile Network Experience Index, Q4 2015

Executive Summary

In response to customers’ growing usage of mobile data and applications, STL Partners has developed MobiNEX: The Mobile Network Customer Experience Index, which benchmarks mobile operators’ network speed and reliability by measuring the consumer app experience, and allows individual players to see how they are performing in relation to competition in an objective and quantitative manner.

We assign operators an individual MobiNEX score based on their performance across four measures that are core drivers of customer app experience: download speed; average latency; error rate; latency consistency (the percentage of app requests that take longer than 500ms to fulfil). Apteligent has provided us with the raw data for three out of four of the measures based on billions of requests made from tens of thousands of applications used by hundreds of millions of users in Q4 2015. We plan to expand the index to cover other operators and to track performance over time with twice-yearly updates.

Encouragingly, MobiNEX scores are positively correlated with customer satisfaction in the UK and the US suggesting that a better mobile app experience contributes to customer satisfaction.

The top five performers across twenty-seven operators in seven countries in Europe and North America (Canada, France, Germany, Italy, Spain, UK, US) were all from France and the UK suggesting a high degree of competition in these markets as operators strive to improve relative to peers:

  • Bouygues Telecom in France scores highest on the MobiNEX for Q4 2015 with consistently high scores across all four measures and a total score of 76 out of 100.
  • It is closely followed by two other French operators. Free, the late entrant to the market, which started operations in 2012, scores 73. Orange, the former national incumbent, is slightly let down by the number of app errors experienced by users but achieves a healthy overall score of 70.
  • The top five is completed by two UK operators: EE (65) and O2 (61) with similar scores to the three French operators for everything except download speed which was substantially worse.

The bottom five operators have scores suggesting a materially worse customer app experience and we suggest that management focuses on improvements across all four measures to strengthen their customer relationships and competitive position. This applies particularly to:

  • E-Plus in Germany (now part of Telefónica’s O2 network but identified separately by Apteligent).
  • Wind in Italy, which is particularly let down by latency consistency and download speed.
  • Telefónica’s Movistar, the Spanish market share leader.
  • Sprint in the US with middle-ranking average latency and latency consistency but, like other US operators, poor scores on error rate and download speed.
  • 3 Italy, principally a result of its low latency consistency score.

Surprisingly, given the extensive deployment of 4G networks there, the US operators perform poorly and are providing an underwhelming customer app experience:

  • The best-performing US operator, T-Mobile, scores only 45 – a full 31 points below Bouygues Telecom and 4 points below the median operator.
  • All the US operators perform very poorly on error rate and, although 74% of app requests in the US were made on LTE in Q4 2015, no US player scores highly on download speed.

MobiNEX scores – Q4 2015

 Source: Apteligent, OpenSignal, STL Partners analysis

MobiNEX vs Customer Satisfaction

Source: ACSI, NCSI-UK, STL Partners


  • Introduction
  • Mobile app performance is dependent on more than network speed
  • App performance as a measure of customer experience
  • MobiNEX: The Mobile Network Experience Index
  • Methodology and key terms
  • MobiNEX Q4 2015 Results: Top 5, bottom 5, surprises
  • MobiNEX is correlated with customer satisfaction
  • Segmenting operators by network customer experience
  • Error rate
  • Quantitative analysis
  • Key findings
  • Latency consistency: Requests with latency over 500ms
  • Quantitative analysis
  • Key findings
  • Download speed
  • Quantitative analysis
  • Key findings
  • Average latency
  • Quantitative analysis
  • Key findings
  • Appendix: Source data and methodology
  • STL Partners and Telco 2.0: Change the Game
  • About Apteligent


  • MobiNEX scores – Q4 2015
  • MobiNEX vs Customer Satisfaction
  • Figure 1: MobiNEX – scoring methodology
  • Figure 2: MobiNEX scores – Q4 2015
  • Figure 3: Customer Satisfaction vs MobiNEX, 2015
  • Figure 4: MobiNEX operator segmentation – network speed vs network reliability
  • Figure 5: MobiNEX operator segmentation – with total scores
  • Figure 6: Major Western markets – error rate per 10,000 requests
  • Figure 7: Major Western markets – average error rate per 10,000 requests
  • Figure 8: Major Western operators – percentage of requests with total roundtrip latency greater than 500ms
  • Figure 9: Major Western markets – average percentage of requests with total roundtrip latency greater than 500ms
  • Figure 10: Major Western operators – average weighted download speed across 3G and 4G networks (Mbps)
  • Figure 11: Major European markets – average weighted download speed (Mbps)
  • Figure 12: Major Western markets – percentage of requests made on 3G and LTE
  • Figure 13: Download speed vs Percentage of LTE requests
  • Figure 14: Major Western operators – average total roundtrip latency (ms)
  • Figure 15: Major Western markets – average total roundtrip latency (ms)
  • Figure 16: MobiNEX benchmarks

Telco 2.0 Transformation Index: Technology Survey

Summary: 150 senior execs from Vodafone, Telefonica, Etisalat, Ooredoo (formerly Qtel), Axiata and Singtel supported our technology survey for the Telco 2.0 Transformation Index. This analysis of the results includes findings on prioritisation, alignment, accountability, speed of change, skills, partners, projects and approaches to transformation. It shows that there are common issues around urgency, accountability and skills, and interesting differences in priorities and overall approach to technology as an enabler of transformation. (November 2013, Executive Briefing Service, Transformation Stream.) Telco 2.0 Transformation Index Tech Survey Cover Small
  Read in Full (Members only)   To Subscribe click here

Below are a brief extract and detailed contents from a 29 page Telco 2.0 Briefing Report that can be downloaded in full in Powerpoint slideshow format by members of the Premium Telco 2.0 Executive Briefing service and the Telco 2.0 Transformation stream here.

This report is an extract from the overall analysis for the Telco 2.0 Transformation Index, a new service from Telco 2.0 Research. Non-members can find out more about subscribing to the Briefing Service here and the Transformation Index here. There will be a world first preview of the Telco 2.0 Transformation Index at our Digital Arabia Executive Brainstorm in Dubai on 11-13th November 2013. To find out more about any of these services please email contact@telco2.net or call +44 (0) 207 247 5003.

To share this article easily, please click:


Introduction


Details of the objectives and key benefits of the overall Telco 2.0 Transformation Index can be found here, and the methodology and approach here. There’s also an example of Telefonica’s market position here.

One component of our analysis has been a survey of 150 senior execs on the reality of developing and implementing technology strategy in their organisations, and the results are now available to download to members of the Telco 2.0 Executive Briefing Service.

Key Benefits

  • The report’s highly graphical and interactive Powerpoint show format makes it extremely easy to digest and reach valuable insights quickly
  • The structure of the analysis allows the reader to rapidly and concisely assimilate the complex similarities and differences between players
  • It is underpinned with detailed and sourced numerical and qualitative data


Example charts from the report

The report analyses similarities and differences in priorities across the six players.Telco 2.0 Transformation Index - Tech Prioritisation Differences - Singtel, Axiata, Vodafone, Telefonica, Etisalat, Ooredoo


It also assesses the skills profiles of the players against different strategic areas.

Telco 2.0 Transformation Index - Technology Skills analysis, Telefonica, Vodafone, Etisalat, Ooredoo, Axiata, Singtel
Contents

To access the contents of the report, including…

  • Introduction and Methodology
  • Background – the Telco 2.0 Transformation Index
  • Executive Summary
  • Survey respondents
  • Drivers of network and IT projects
  • Degree of challenge of ‘Transformation’ by operator
  • Priority areas for Transformation by operator
  • What are the preferred project approaches for transformation?
  • Alignment of techology and commercial priorities
  • Accountability for leveraging and generating value from technology projects
  • IT Skills – ‘Telco 1.0’ Vs ‘Telco 2.0’
  • Nature of strategic partnerships by operator
  • Technology project life-cycles by operator
  • Groupings by attitude to technology as a driver of success
  • Priority areas for technological improvement or transformation

Members of the Telco 2.0 Executive Briefing Subscription Service and the Telco 2.0 Transformation stream can download the full 29 page report in interactive Powerpoint slideshow format hereNon-Members, please subscribe here. For other enquiries, please email contact@telco2.net / call +44 (0) 207 247 5003.

Telco 2.0 Transformation Index: Understanding Telefonica’s Markets and Market Position

Summary: This extract from the Telco 2.0 Transformation Index shows our analysis of Telefonica’s markets and market position, including economic and digital market maturity, regulation, customers, competition and pricing. It is one part of our overall analysis of Telefonica’s progress towards transformation to the Telco 2.0 business model. The other parts of the Telefonica analysis are: Service Proposition, Finances, Technology, Value Network, and an overall summary. Telefonica is one of the companies analysed and compared in the first tranche of analysis that also addresses Vodafone, AT&T, Verizon, Axiata, SingTel, Etisalat and Ooredoo (formerly Qtel). (August 2013, Executive Briefing Service, Transformation Stream.) Telefonica Telco 2.0 Transformation Index Small

Introduction


Details of the objectives and key benefits of the overall Telco 2.0 Transformation Index can be found here, and the methodology and approach here.

Telefonica is one of the first companies featured in our Transformation Index, and one that is viewed with great interest by others. With operating companies facing very different conditions in Europe and South America, Telefonica faces some interesting strategic challenges, and has attempted to stimulate growth through innovation with the development of Telefonica Digital.

The ‘Markets and Position’ section of the analysis puts Telefonica’s current global position, risks and opportunities in context, and is now available to download to members of the Telco 2.0 Executive Briefing Service. The rest of the analysis (covering Service Proposition, Value Network, Technology and Finances), and the analyses of the other seven companies initially covered (Vodafone, AT&T, Verizon, Etisalat, Ooredoo [formerly Qtel], Singtel and Axiata) will be published from September 2013.

Key Benefits

  • The report’s highly graphical format makes it extremely easy to digest and reach valuable insights quickly into both Telefonica’s current position and future strategic needs
  • The structure of the analysis allows the reader to rapidly and concisely assimilate the complex picture of Telefonica’s international businesses, risks and opportunities
  • It is underpinned with detailed and sourced numerical and qualitative data


Example charts from the report

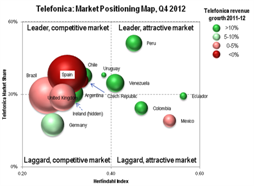
The report analyses Telefonica’s market share position across markets against their regulatory strength.
Telco 2.0 Transformation Index - Market Positioning Detail


It also assesses the economic and demographic make-up of Telefonica’s markets.

Telco 2.0 Transformation Index - Market Analysis Detail Example, Telefonica

The market analyses are consolidated into an overall summary of market positioning by Operating Company, which is further refined into an assessment of strategic approach and operational performance.

Telco 2.0 Transformation Index - Market Share and Profitability Detail


Contents

To access the contents of the report, including…

  • Introduction and Methodology
  • Market Position Summary: Economic, Regulatory, Competitive and Customers
  • Summary analysis of growth, GDP, prices and economics of key markets
  • Comparison and contrasts between European and Latin American markets
  • Regulation vs EBITDA margins
  • Mobile revenue growth by market
  • Subscribers and revenues by region
  • Mari-Meko of Subscribers and Shares in key markets
  • Market Share Vs. Regulation
  • Market Vs. Telefonica Growth by national market
  • Telefonica’s commercial strategy
  • Strength of OTT entrants in Telefonica’s markets
  • Pre-Pay, Post-Pay and Churn by Market
  • Telefonica’s relative brand strength