Lessons from AT&T’s bruising entertainment experience

How AT&T entered and exited the media business

AT&T enters the satellite market at its peak

In 2014, AT&T announced it was buying DirecTV. By that time, AT&T was already bundling DirecTV with its phone and internet service and had approximately 5.9 million linear pay-TV (U-Verse) video subscribers. However, this pay-TV business was already experiencing decline, to the extent that when the DirecTV merger completed in mid-2015, U-Verse subscribers had fallen to 5.6 million by the end of that year.

With the acquisition of DirecTV, AT&T went from a small player in the media and entertainment industry to one of the largest media players in the world adding 39.1 million (US and Latin American) subscribers and paying $48.5bn ($67bn including debt) to acquire the business. The rationale for this acquisition (the satellite business) was to compete with cable operators by being able to offer broadband, increasing AT&T’s addressable market beyond its fibre-based U-Verse proposition which was only available in certain locations/states.

AT&T and DirecTV enjoyed an initial honeymoon, period recording growth up until the end of 2016 when DirecTV subscribers peaked at just over 21 million in the US.

From this point onwards however, AT&T’s satellite subscribers went into decline as customers switched to cheaper competitor offers as well as online streaming services. The popularity of streaming services was reflected by moves among traditional media players to develop their own streaming services such as Time Warner’s HBO GO and HBO NOW. In 2015, DirectTV’s satellite competitor Dish TV likewise launched its own streaming service Sling TV.

Even though it was one of the largest TV distributors on a satellite platform, AT&T also believed online streaming was its ultimate destination. Prior to the launch of its streaming service in late 2016, Bloomberg reported that AT&T envisioned DirecTV NOW as its primary video platform by 2020.

A softwarised platform delivered lowered costs as the service could be self-installed by customers and didn’t rely on expensive truck roll installation or launching satellites. The improved margins would enable AT&T to promote TV packages at attractive price points which would balance inflation demands from broadcasters for the cost of TV programming. AT&T could also more easily bundle the softwarised TV service with its broadband, fibre and wireless propositions and earn more lucrative advertising revenue based on its own network and viewer insights.

Enter your details below to request an extract of the report

The beginnings of a bumpy journey in TV

AT&T’s foray into satellite and streaming TV can be characterised by a series of confusing service propositions for both consumers and AT&T staff, expensive promotional activity and overall pricing/product design misjudgements as well as troubled relations with TV broadcasters resulting in channel blackouts and ultimately churn.

Promotion, pull back and decline of DirecTV NOW

DirectTV NOW launched in November 2016, as AT&T’s first over the top (OTT) low cost online streaming service. Starting at $35 per month for 60+ channels with no contract period, analysts called the skinny TV package as a loss leader given the cost of programming rights and high subscriber acquisition costs (SACs). The loss leader strategy was aimed at acquiring wireless and broadband customers and included initiatives such as:

  • Promotional discounts to its monthly $60 mid-tier 100+ channel package reduced to $35 per month for life (subject to programming costs).
  • Device promotions and monthly waivers. The service eventually became available on popular streaming devices (Roku, Xbox and PlayStation) and included promotions such as an Apple TV 4K with a four month subscription waiver, a Roku Streaming Stick with a one month waiver or a $25 discount on the first month.
  • Customers could also add HBO or Cinemax for an additional $5 per month, which again was seen as a costly subsidy for AT&T to offer.

The service didn’t include DirecTV satellite’s popular NFL Sunday Ticket programming as Verizon held the smartphone rights to live NFL games, nor did it come with other popular shows from programme channels such as CBS. Features such as cloud DVR (digital video recording) functionality were also initially missing, but would follow as AT&T’s TV propositions and functionalities iterated and improved over time.

The DirecTV NOW streaming service enjoyed continuous quarterly growth through 2017 but peaked in Q3 2018 with net additions turning immediately negative in the final quarter of 2018 as management pulled back on costly promotions and discounted pricing.

The proposition became unsustainable financially in terms of its ability to cover rising programming costs and was positioned comparatively as a much less expensive service to its larger DirecTV satellite pay-TV propositions.

The DirecTV satellite service sold some of the most expensive TV propositions on the market and reported higher pay-TV ARPU ($131) than peers such as Dish ($89) and Comcast ($86) in Q4 2019.

  • The launch of a $35 DirecTV NOW streaming service with no contract and with a similar sounding name to the full linear service confused both new and existing DirecTV satellite customers and some would have viewed their satellite package as expensive compared to the cheaper steaming option.

Rising programming costs

AT&T’s low-cost skinny TV packages brought them into direct confrontation with TV programmers in terms of negotiating fees for content. When the streaming service launched, analysts highlighted the channels within AT&T’s base package were expected to rise in price annually by around 10% each year and this would eventually require AT&T to eventually balance programming costs with rising monthly package pricing.

Confrontations with programmers included a three-week dispute with CBS and an eight week dispute with Nexstar in 2019, which resulted in a blackout of both CBS and Nexstar channels across AT&T’s TV platforms such as Direct TV, U-Verse, DirectTV NOW. Commenting on the blackouts in Q3 2019, Randall Stephenson noted there were “a couple of significant blackouts in terms of content, and those blackouts drove some sizable subscriber losses”.

AT&T’s confrontation with content owners may have been a contributory reason to consider acquiring a content creation platform of its own in the form of Time Warner.

In mid-2018, as AT&T withdrew promotions and discounts for DirecTV NOW (later rebranded it to AT&T TV NOW), customers began to drop the OTT TV service.

  • AT&T TV NOW went from a peak of 1.86 million subscribers in Q3 2018 to 656,000 at the end of 2020.

DirecTV NOW subscriptions

DirecTV-subs-AT-T-stlpartners

Source: STL Partners, AT&T Q2 Earnings 2021

Name changes and new propositions create more confusion

In 2019, DirecTV NOW was re-branded to AT&T TV NOW , and continued to be promoted as a skinny bundle operating alongside AT&T TV, a new full fat live TV streaming version of the DirecTV satellite TV proposition. AT&T TV  was first piloted in August 2019 and soft launched in November 2019. The AT&T TV service included an Android set-top box with cloud DVR functionality and supported other apps such as Netflix.
AT&T TV required a contract period and offered pricing (once promotional discount periods ended) resembling a linear pay-TV service, i.e. $90+. This was, in effect, the very type of pay-TV proposition customers were abandoning.
AT&T TV was seen as an ultimate replacement for the satellite business based on the advantages a softwarised platform provided and the ability to bundle it with AT&T broadband, fibre and wireless services.

Confusion amongst staff and customers

The new AT&T TV proposition confused not only customers but also AT&T staff, as they were found mixing up the AT&T TV proposition with the skinny AT&T TV NOW proposition. By 2019 the company diverted its attention away from AT&T TV NOW  pulling back on promotional activity in order to focus on its core AT&T TV live TV service.

According to Cord Cutters News, both services used the same app but remained separate services. AT&T’s app store marketing incorrectly communicated the DirectTV NOW service was now AT&T TV when in fact it was AT&T TV NOW. Similarly, technical support was also incorrectly labelled with online navigation sending customers to the wrong support channels.

AT&T’s own customer facing teams misunderstood the new propositions

DirecTV-Cordcutter-news

Source: Cord Cutters News

Withdrawal of AT&T TV NOW

By January 2021, AT&T TV NOW was no longer available to new customers but continued to be available to existing customers. The AT&T TV proposition, which was supposed to offer “more value and simplicity” was updated to include some features of the skinny bundle such as the option to go without an annual contract requirement. Customers were also not required to own the set-top box but could instead stream over Amazon Fire TV or Apple TV.  In terms of pricing, AT&T TV was twice the price of the originally launched DirecTV NOW proposition costing $70 to $95 per month.

The short life of AT&T Watch TV

In April 2018, while giving testimony for AT&T’s merger with Time Warner, AT&T’s then CEO Randall Stephenson positioned AT&T Watch TV as a potential new low-cost service that would benefit consumers if the merger was successful. Days following AT&T’s merger approval in the courts, the low cost $15 per month, ultra-skinny bundle launched as a suitable low-cost cord-cutter/cord-never option for cable, broadband and mobile customers from any network. The service was also free to select AT&T Unlimited mobile customers.

By the end of 2018, the operator claimed it had 500,000 AT&T Watch TV“established accounts”. By the end of 2019 the operator had updated its mobile tariffs removing Watch TV for new customers subscribing to its updated Unlimited mobile tariffs. Some believed the company didn’t fully commit to the service, referring to the lack of roll out support for streaming devices such as Roku. The operator was now committed to rolling out its new service HBO Max in 2020. AT&T has informed Watch TV subscribers the service will close 30 November 2021.

Timeline of AT&T entertainment propositions

AT-T-Timeline-Entertainment

Source: STL Partners

The decline of DirecTV

As the graphic belowshows, in June 2021 there were 74.3 million pay-TV households in the US, reflecting continued contraction of the traditional pay-TV market supplied by multichannel video programming distributor (MVPD) players such as cable, satellite, and telco operators. According to nScreenMedia, traditional pay-TV or MVPD market lost 6.3 and 6.2 million customers over 2019 and 2020, but not all were cord-cutters. Cord-shifters dropped their pay-TV but shifted across to virtual MVPD (vMVPD) propositions such as Hulu Live, Sling TV, YouTube TV, AT&T TV NOW, Fubo TV and Philo. Based on current 2021 cord-cutting levels, nScreenMedia predicts 2021 will be the highest year of cord-cutting yet.

Decline in traditional pay-TV households

pay-tv-decline-nscreenmedia

Source: nScreenMedia, STL Partners

Satellite subscribers to Dish and DirecTV 2015-2020

Satellite-pay-tvdish-nscreenmedia

Source: nScreenMedia, STL Partners

When considering AT&T’s management of DirecTV, nScreenMedia research shows the market number of MVPD subscribers declined by over 20 million between 2016 and 2020. In that time, DirecTV lost eight million subscribers. While it represented 20% of the MVPD market in 2016, DirecTV accounted for 40% of the pay-TV losses in the market (40% of 20 million equals ~8 million). AT&T’s satellite rival Dish weathered the decline in pay-TV slightly better over the period.

  • In Q4 2020 the operator wrote down $15.5bn on its premium TV business, which included DirecTV decline, to reflect the cord cutting trend as customers found cheaper streaming alternatives online. The graphic (below) shows a loss of 8.76 million Premium TV subscribers between 2017 and 2020 with large losses of 3.4 million and 2.9 million subscribers in 2019 and 2020.

AT&T’s communications business has also been enduring losses in legacy voice and data (DSL) subscriptions in recent years. AT&T has used a bundling strategy for both products. As customers switched to AT&T fibre or competitor broadband offerings this also impacted the video subscription.

Table of contents

  • Executive Summary
    • What can others learn from AT&T’s experience?
  • How AT&T entered and exited the media business
    • AT&T enters the satellite market at its peak
    • The beginnings of a bumpy journey in TV
    • Vertical integration strategy: The culture clash
    • AT&T’s telco mindset drives its video strategy
    • HBO MAX performance
  • The financial impact of AT&T’s investments
    • Reversing six years of strategic change in three months
  • Lessons from AT&T’s foray into media

Related Reports

Enter your details below to request an extract of the report


Why fibre is on fire again

Introduction

Fibre to the home is growing at a near-explosive rate

Every company faces the problems of mature markets, disappointing revenues and tough decisions on investment. Everyone agrees that fibre delivers the best network experience, but until recently most companies rejected fibre as too costly.

Now, 15 of the world’s largest phone companies have decided fibre to the home is a solution. Why are so many now investing so heavily?

Here are some highlight statistics:

  • On 26th July 2018, AT&T announced it will pass 5 million locations with fibre to the home in the next 12 months, after reaching 3 million new locations in the last year.[1] Fibre is now a proven money-maker for the US giant, bringing new customers every quarter.
  • Telefónica Spain has passed 20 million premises – over 70% of the addressable population – and continues at 2 million a year.
  • Telefónica Brazil is going from 7 million in 2018 to 10 million in 2020.
  • China’s three giants have 344 million locations connected.[2]
  • Worldwide FTTH connections grew 23% between Q1 2017 and Q1 2018.[3]
  • In June 2018, China Mobile added 4.63 million broadband customers, nearly all FTTH.[4]
  • European FTTH growth in 2017 was 20%.[5]
  • In India, Mukesh Ambani intends to connect 50 million homes at Reliance Jio.[6]

Enter your details below to request an extract of the report

var MostRecentReportExtractAccess = “Most_Recent_Report_Extract_Access”;
var AllReportExtractAccess = “All_Report_Extract_Access”;
var formUrl = “https://go.stlpartners.com/l/859343/2022-02-16/dg485”;
var title = encodeURI(document.title);
var pageURL = encodeURI(document.location.href);
document.write(‘‘);

Even the most reluctant carriers are now building, including Deutsche Telekom and British Telecom. In 2015, BT Openreach CTO Peter Bell said FTTH was “impossible” for Britain because it was too expensive.[7] Now, BT is hiring 3,500 engineers to connect 3 million premises, with 10 million more homes under consideration.[8]

Credit Suisse believes that for an incumbent, “The cost of building fibre is less than the cost of not building fibre.”

Contents:

  • Executive Summary
  • Introduction
  • Fibre to the home is growing at a near-explosive rate
  • Why the change?
  • Strategies of leading companies
  • Frontrunners
  • Moving toward rapid growth
  • Relative newcomer
  • The newly converted
  • Alternate carriers
  • Naysayers
  • U.S. regionals: CenturyLink, Frontier and Windstream
  • The Asian pioneers
  • Two technologies to consider
  • Ten-gigabit equipment
  • G.fast
  • The hard question: How many will decide to go wireless only?

Figures:

  • Figure 1: Paris area fibre coverage – Orange has covered most of the capital
  • Figure 2: European fibre growth
  • Figure 3: Top five European incumbents, stock price July 2016 – July 2018
  • Figure 4: DT CEO Tim Höttges and Bavarian Prime Minister Dr. Markus Söder announce a deal to fibre nearly all of Bavaria, part financed by the government

[1] https://www.fastnet.news/index.php/11-fib/715-at-t-fiber-run-rate-going-from-3m-to-5m-year

[2] https://www.fastnet.news/index.php/8-fnn/713-china-1-1b-4g-400m-broadband-328m-fibre-home-rapid-growth

[3] http://point-topic.com/free-analysis/world-broadband-statistics-q1-2018/

[4] https://www.chinamobileltd.com/en/ir/operation_m.php

[5] http://www.ftthcouncil.eu/documents/PressReleases/2018/PR%20Market%20Panorama%20-%2015-02-2018-%20FINAL.pdf

[6] https://www.fastnet.news/index.php/11-fib/703-india-unreal-jio-wants-50m-ftth-in-1100-cities

[7] G.fast Summit May 2015

[8] https://www.theguardian.com/business/2018/feb/01/bt-openreach-hire-3000-engineers-drive-to-fill-broadband-not-spots

Enter your details below to request an extract of the report

var MostRecentReportExtractAccess = “Most_Recent_Report_Extract_Access”;
var AllReportExtractAccess = “All_Report_Extract_Access”;
var formUrl = “https://go.stlpartners.com/l/859343/2022-02-16/dg485”;
var title = encodeURI(document.title);
var pageURL = encodeURI(document.location.href);
document.write(‘‘);

Telco economics: The price of loyalty

The Cost of Churn for Mobile Operators

Customer churn continues to present a significant and costly challenge to the mobile industry. Churn rates for MNOs can range from less than 0.75% per month (c. 9% pa) to over 5% per month (80% pa). Postpay rates of churn are usually lower and typically lie between 0.75% and 3% per month (c. 9–43% pa), whereas prepay churn typically lies between 3% and 5% (30–80%pa), although it can be as low as 1% in some circumstances, for example when number portability is not permitted.

The costs of churn are felt in several ways. The major costs come from lost revenues from customers churning away and the costs of acquiring new customers to replace them. During periods of high growth operators can also lose significant market share, and hence revenues and profit, if much of their expenditure on acquiring new customers is devoted to replacing customers that have churned away, rather than on growing their subscriber base.

Analysis of data published by operators shows that average costs of acquisition (CoA) are about four times average monthly ARPU, and it will therefore typically take over four months’ revenue to repay the SAC incurred. The figure is slightly higher on average for postpay customers at about 4½, whereas prepay CoA is on average between 1½ and 1¾ times ARPU.

We estimate that the industry average EBITDA is around 25%, so for an individual postpay subscriber it will take on average 17 months to repay the investment from EBITDA. With typical contract lengths of 24 months, this does not leave much time to generate a positive margin.

These costs mean that it is important for operators to find ways of minimising churn and of maintaining it at a low level.

Some level of churn is inevitable, since customers may move to a new region or country, die, or perhaps acquire a new phone and subscription from their employers as part of their job. Other forms of churn are largely voluntary, and operators have to focus their efforts on these if they are to contain their costs of doing business.

In doing so, operators can find it worthwhile to take into account the different characteristics of their customers. Some people show a much greater propensity to churn and are always seeking improved tariffs or a better deal, but many others remain loyal. If the latter churn, they are more likely to do so for other reasons, such as poor quality of service.

Enter your details below to request an extract of the report

Mobile Operators Strategies for Reducing Churn

In an attempt to find an effective means of reducing churn, mobile operators have adopted a variety of churn reduction strategies. These include:

  • Offering financial or other incentives to customers who are about to churn, such as discounted handsets or tariff bundles.
  • Monitoring usage and using data analytics to predict which customers are likely to churn in the near future and offering them incentives and improved service bundles.
  • Using more flexible contracts to allow early upgrades or other changes.
  • Giving bonuses (e.g. extra minutes or increased data allowances) or other rewards for loyalty.
  • Offering multiple services, such as quad play, to increase the stickiness of their service.
  • Offering additional and popular services, such as Spotify or Netflix, at attractive rates or bundled with basic services, or discounted entry to events.
  • Improving overall customer experience and service quality to reduce the triggers for churn. This can include significant organisational and cultural changes and efficiency improvements including increased automation. Changes include transfer of customer support functions to marketing, and the introduction of chatbots and apps to speed up and improve handling of routine customer enquiries.

Causes of Customer Churn

This report reviews the causes of churn and the characteristics of customers that are most likely to churn. It draws on examples from operators’ experiences to illustrate different strategies used by operators to reduce churn and to establish which approaches have proved most successful in delivering reductions in the level of churn or in maintaining low levels that have already been achieved. It also looks at the costs associated with churn and their impact on revenues and profitability. Operators discussed include TELUS, O2 and Telstra, which provide examples of MNOs that have achieved low levels of churn, and Globe, which provides useful insight into the different customer behaviours found in a predominately prepay and multi-SIM market and an example of the relationship between churn and SAC.

Contents:

  • Executive Summary
  • Actions of successful operators
  • Financial implications of churn
  • Benchmarks
  • Introduction
  • Causes and costs of churn and remedies
  • Customer behaviours
  • Costs of churn
  • Common approaches to reducing churn
  • Case studies and results
  • TELUS: churn fell over five years
  • O2 outsourcing: changing approach to customer experience
  • Telstra: analytics and customer experience
  • Globe Telecom: costs of churn
  • Cricket: reducing churn in low-cost prepay
  • Adjacent and complementary services
  • Conclusions
  • Customer behaviours
  • Costs of churn
  • Actions of successful operators
  • Benchmarks
  • Resulting organisational and financial issues faced by operators
  • Recommendations

Figures:

  • Figure 1: Share of TELUS revenues taken by SAC and SRC
  • Figure 2: Costs of churn when CoA = 50% annual ARPU
  • Figure 3: Examples of reasons/triggers for customer churn
  • Figure 4: Mobile customer characteristics
  • Figure 5: Customer average lifetime versus lifetime value
  • Figure 6: Relative proportions of customer types in mature markets
  • Figure 7: Costs of churn when CoA = 50% annual ARPU
  • Figure 8: Costs of churn when CoA = 80% annual ARPU
  • Figure 9: Costs of churn when CoA = 10% annual ARPU
  • Figure 10: TELUS monthly churn
  • Figure 11: TELUS EBITDA
  • Figure 12: TELUS monthly ARPU 2007–2016
  • Figure 13: TELUS SAC and SRC % of revenues
  • Figure 14: TELUS costs of acquisition and ARPU
  • Figure 15: TELUS SAC, SRC and EBITDA
  • Figure 16: UK MNOs blended churn
  • Figure 17: O2 customer satisfaction
  • Figure 18: Telstra annual postpay churn 2012–2017
  • Figure 19: Telstra revenues by service
  • Figure 20: Telstra ARPU
  • Figure 21: Telstra EBITDA
  • Figure 22: Globe prepay customers 2011–2017
  • Figure 23: Globe postpay customers 2012–2017
  • Figure 24: Globe revenues 2012–2017
  • Figure 25: Globe and TM prepay and postpay monthly churn
  • Figure 26: Inverse relationship between Globe’s postpay SAC and churn
  • Figure 27: Examples of costs of churn and CoA

Enter your details below to request an extract of the report

Great customer experience: What’s the secret?

Introduction: How important is customer centricity for telecoms operators?

The need for improvement

Many network operators appreciate the need to improve their customers’ overall experience if their businesses are to prosper. Their executives understand the effect customer experience has on churn and customer lifetime value, and in turn on market share, operating costs, and revenues. This relationship is illustrated in Figures 2 and 3 for mobile telecoms, pay TV and internet. Using ‘Net Promoter Scores’ (NPS), the most widely accepted measure of customer satisfaction, it shows the relationship between NPS promoters (those more positive than negative and willing to promote the brand), passives (neither positive nor negative) and detractors (those who actively dissuade others), and churn and lifetime value.

Figure 2: NPS Promoters, Passives & Detractors vs Churn and Lifetime Value

Source: Bain & Co

Figure 3: Lifetime Value of Promoters, Passives and Detractors

Source: Bain & Co

While most appreciate in general terms what customer centricity means, it is not always well understood what good customer centric service should look like in practice, or how it can be achieved. Many would say that a service where all systems worked properly, customer queries were answered correctly, problems resolved quickly and few if any complaints were made to the national regulator, was providing a fully satisfactory service to its customers, and therefore providing a good customer experience. Given the complexities of delivering a mobile telecoms service, for many operators, delivering those would be an achievement.

However, that may not be what a customer regards as a good experience, and operators need to bear in mind that their customers compare them with other service providers, and not just other telecoms providers. They need to ask themselves if they should therefore aspire to something better than the satisfactory operation of their networks and services. To decide if that is the case, operators need to determine what a good customer experience is from a user’s standpoint, and establish means of assessing whether they have delivered that or not.

Contents:

  • Executive Summary
  • Introduction
  • How important is customer centricity for telecoms operators?
  • The need for improvement
  • What does customer centricity mean for operators?
  • Customer centric networks
  • Network performance to meet user needs
  • Customer premises networks
  • Customer centric services in a digital world
  • Improving service
  • Systems integration & AI
  • All channels to look and behave the same
  • Using AI to improve customer experience
  • Customer centric service enhancements
  • Customer centric service
  • Lessons from Ritz-Carlton, a premium service
  • Cricket: US MVNO increasing NPS, cutting churn
  • TELUS: Creating, recognising and measuring success
  • TELUS performance: Measuring success
  • Conclusions

Figures:

  • Figure 1: Key Steps to Deliver Satisfactory and Exceptional Service
  • Figure 2: NPS Promoters, Passives & Detractors vs Churn and Lifetime Value
  • Figure 3: Lifetime Value of Promoters, Passives and Detractors
  • Figure 4: US Consumer NPS Scores for Different Industries
  • Figure 5: Average NPS for Telecommunications Operators in 9 Developed Countries
  • Figure 6: Highest Scoring Companies in US for Their Sector 11Highest Scoring Companies in US for Their Sector
  • Figure 7: Importance of criteria for choosing a mobile internet provider
  • Figure 8: MobiNEX segmentation dimensions
  • Figure 9:  Mobinex H2 2016 – Average scores by country
  • Figure 10: Operator and Country Scores for Reliability and Speed
  • Figure 11: Cricket wireless tariff structure
  • Figure 12: Single customer view and omni-channel insights of CMOs
  • Figure 13: TOBi, Vodafone’s AI chatbot
  • Figure 14: Amelia functions and applications
  • Figure 15: Impact of AI on media company call handling
  • Figure 16: Change in cricket NPS score from Q3 2014 to Q3 2015
  • Figure 17: TELUS monthly churn
  • Figure 18: TELUS employee engagement
  • Figure 19: Number of complaints made to the CCTS by year
  • Figure 20: TELUS ARPU 2007 – 2016
  • Figure 21: TELUS EBITDA

Valuing Digital: A Contentious Yet Vital Business

Introduction

Tech VC in 2014: New heights, billion-dollar valuations

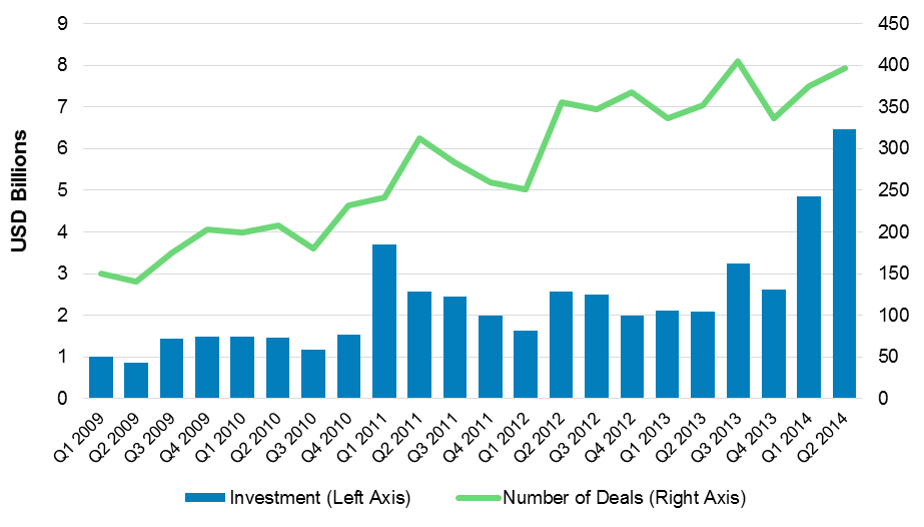
Venture capital investment across the mobile, digital and broader technology sectors is soaring. Although it stumbled during the 2008/9 financial crisis, the ecosystem has since recovered with 2013 and 2014 proving to be record-breaking years. Looking at Silicon Valley, for example, 2013 saw deals and funding more than double compared to 2009, and 2014 had already surpassed 2013 by the half-year mark:

Figure 1: Silicon Valley Tech Financing History, 2009-14


Source: CB Insights Venture Capital Database

As Figure 1 shows, growth in funding has outstripped growth in the number of deals: consequently, the average deal size has more than doubled since 2009. In part, this has been driven by a small number of large deals attracting very high valuations, with some of the highest valuations seen by Uber ($41bn), SpaceX ($12bn), Dropbox ($10bn), Snapchat ($10-20bn) and Airbnb ($13bn). Similarly high valuations have been seen in Silicon Valley tech exits, with Facebook’s $19bn acquisition of WhatsApp and Google’s $3.2bn acquisition of Nest two high-profile examples. These billion-dollar valuations are leading many to claim that a dotcom-esque bubble is forming: what can possibly justify such valuations?

In some cases, these concerns are driven by a lack of publicly available information on financial performance: for example, Uber’s leaked dashboard showed its financials to be considerably stronger than analysts’ expectations at the time. In other cases, they appear to be driven by a lack of understanding of the true rationale behind the deal. See, for example, the Connected Home: Telcos vs Google (Nest, Apple, Samsung, +…) and Facebook + WhatsApp + Voice: So What? Executive Briefings.

The Telco Dilemma: What is it all worth?

Against this uncertain backdrop, telecoms operators are expanding into such new mobile and digital services as a means to fill the ‘hunger gap’ left by falling revenues from core services. They are doing so through a mixture of organic and inorganic investment, in different verticals and with varying levels of ambition and success:

Figure 2: % of Revenue from ‘New’ Telco 2.0 Services*, 2013


Source: Telco 2.0 Transformation Index
* Disclaimer: Scope of what is included/excluded varies slightly by operator and depends upon the ability to source reliable data
Note: Vodafone data from 2012/13 financial year 

However, this is a comparatively new area for telcos and many are now asking what is the real ‘value’ of their individual digital initiatives. For example, to what extent are Telefonica’s digital activities leading to a material uplift in enterprise value?

This question is further complicated by the potential for a new service to generate ‘synergy value’ for the acquirer or parent company: just as Google’s $3.2bn+ valuation of Nest was in part driven by the synergy Nest’s sensor data provides to Google’s core advertising business, digital services have also been shown to provide synergy benefits to telcos’ core communications businesses. For example, MTN Mobile Money in Uganda is estimated to have seen up to 48% of its gross profit contribution generated by synergies, such as core churn reduction and airtime distribution savings, as opposed to standard transaction commissions.

Ultimately, without understanding the value of their digital businesses and how this changes over time (capital gain), telcos cannot effectively govern their digital activities. Prioritisation, budget allocation and knowing when to close initiatives (‘fast failure’) within digital is challenging without a clear idea of the return on investment different verticals and initiatives are generating. Understanding valuation was therefore identified as the joint most important success factor for delivering digital services in STL Partners’ recent survey of telco executives:

Figure 3: Importance of factors in successfully delivering digital services (out of 4)


Source: Digital Transformation and Ambition Survey Results, 2014, n=55

Crucially, however, survey respondents also identified developing this understanding as more than two years away from being resolved. In order to accelerate this process, there are three key questions which need to be addressed:

  1. What are the pitfalls to avoid when valuing digital businesses within telecoms operators?
  2. How should telcos model the spin-off value of their digital businesses?
  3. How should telcos think about the ‘synergy value’ generated by their digital businesses?

This Executive Briefing (Part 1) focuses on question 1; questions 2 and 3 will be addressed by future research (Part 2).


  • Executive Summary
  • Introduction
  • Tech VC in 2014: New heights, billion-dollar valuations
  • The Telco Dilemma: What is it all worth?
  • Challenges in Valuing Any Business (Analog or Digital)
  • DCF: Theoretically sound, but less reliable in practice
  • All models are wrong, but some are more useful than others
  • DCF’s shortcomings are magnified with digital businesses
  • Practical Issues: Lessons from Uber, Google, Skype and Spotify
  • A Conceptual Issue: Lessons from Facebook
  • Proxy Models: An improvement on DCF?
  • The Synergy Problem: A challenge for any valuation technique
  • Synergies are Real: Case studies from mobile money, cloud services and the connected home
  • Synergies are Problematic: Challenges for valuation in four areas
  • Conclusions
  • STL Partners and Telco 2.0: Change the Game


  • Figure 1: Silicon Valley Tech Financing History, 2009-14
  • Figure 2: % of Revenue from ‘New’ Telco 2.0 Services, 2013
  • Figure 3: Importance of factors in successfully delivering digital services (out of 4)
  • Figure 4: Sensitivity of DCF valuation to assumptions on free cash flow growth
  • Figure 5: Different buyer/seller valuations support a range of potential sales prices
  • Figure 6: Impact of addressable market and market share on Uber’s DCF valuation
  • Figure 7: Facebook vs. yield businesses, EV/revenue multiple, 2014
  • Figure 8: Facebook monthly active users vs. valuation, Q1 2010-Present
  • Figure 9: Three potential investor approaches to modelling Facebook’s value
  • Figure 10: MTN Mobile Money Uganda, Gross Profit Contribution, 2009-12
  • Figure 11: Monthly churn rates for MTN Mobile Money Uganda users (three months)
  • Figure 12: Conceptual and practical challenges caused by synergy value