Facebook: Telcos’ New Best Friend?

How Facebook is changing

A history of adaptation

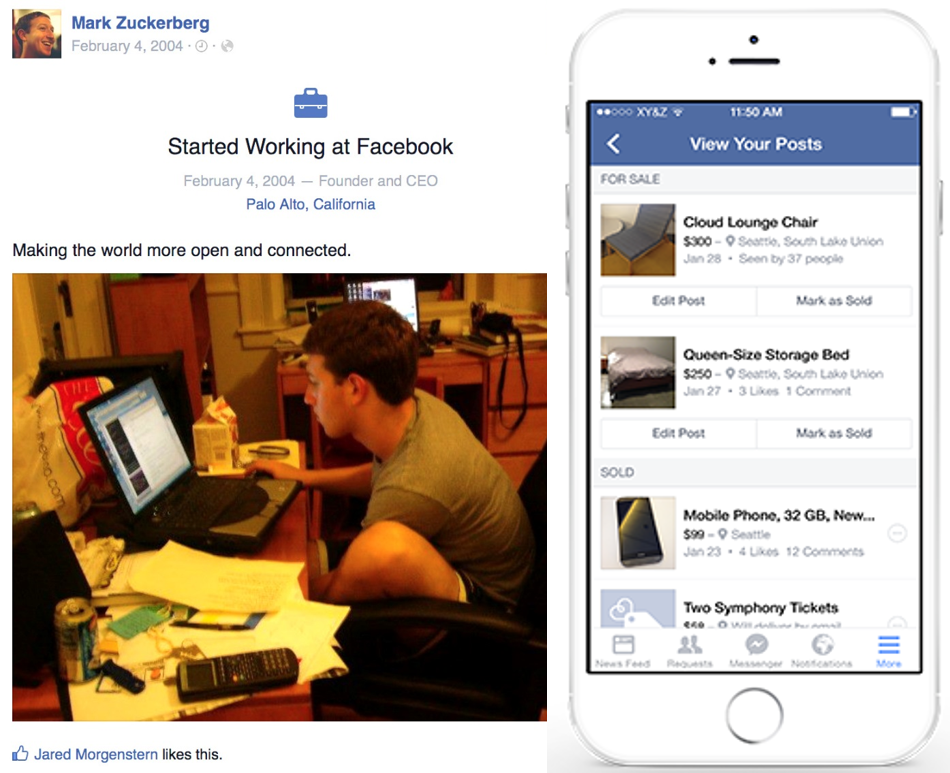
One of the things that sets Facebook apart from its largely defunct predecessors, such as MySpace, Geocities and Friends Reunited, is its ability to adapt to the evolution of the Internet and consumer behaviour. In its decade-long history, Facebook has evolved from a text-heavy, PC-based experience used by American students into a world-leading digital communications and commerce platform used by people of all ages. The basic student matchmaking service Zuckerberg and his fellow Harvard students created in 2004 now matches buyers and sellers in competition with Google, Amazon and eBay (see Figure 1).

Figure 1: From student matchmaking service to a leading digital commerce platform

Source: Zuckerberg’s Facebook page and Facebook investor relations

Launched in early 2004, Facebook initially served as a relatively basic directory with photos and limited communications functionality for Harvard students only. In the spring of 2004, it began to expand to other universities, supported by seed funding from Peter Thiel (co-founder of Paypal). In September 2005, Facebook was opened up to the employees of some technology companies, including Apple and Microsoft. By the end of 2005, it had reached five million users.

Accel Partners invested US$12.7 million in the company in May 2005 and Greylock Partners and others followed this up with another US$27.5 million in March 2006. The additional investment enabled Facebook to expand rapidly. During 2006, it added the hugely popular newsfeed and the share functions and opened up the registration process to anyone. By December 2006, Facebook had 12 million users.

The Facebook Platform was launched in 2007, enabling affiliate sites and developers to interact and create applications for the social network. In a far-sighted move, Microsoft invested US$240 million in October 2007, taking a 1.6% stake and valuing Facebook at US$15 billion. By August 2008, Facebook had 100 million users.

Achieving the 100 million user milestone appears to have given Facebook ‘critical mass’ because at that point growth accelerated dramatically. The company doubled its user base to 200 million in nine months (May 2009) and has continued to grow at a similar rate since then.

As usage continue to grow rapidly, it was increasingly clear that Facebook could erode Google’s dominant position in the Internet advertising market. In June 2011, Google launched the Google + social network – the latest move in a series of efforts by the search giant to weaken Facebook’s dominance of the social networking market. But, like its predecessors, Google+ has had little impact on Facebook.

2012-2013 – the paranoid years

Although Facebook shrugged off the challenge from Google+, the rapid rise of the mobile Internet did cause the social network to wobble in 2012. The service, which had been designed for use on desktop PCs, didn’t work so well on mobile devices, both in terms of providing a compelling user experience and achieving monetisation. Realising Facebook could be disrupted by the rise of the mobile Internet, Zuckerberg belatedly called a mass staff meeting and announced a “mobile first” strategy in early 2012.

In an IPO filing in February 2012, Facebook acknowledged it wasn’t sure it could effectively monetize mobile usage without alienating users. “Growth in use of Facebook through our mobile products, where we do not currently display ads, as a substitute for use on personal computers may negatively affect our revenue and financial results,” it duly noted in the filing.

Although usage of Facebook continued to rise on both the desktop and the mobile, there was increasing speculation that it could be superseded by a more mobile-friendly service, such as fast-growing photo-sharing service Instagram. Zuckerberg’s reaction was to buy Instagram for US$1 billion in April 2012 (a bargain compared with the $21 billion plus Facebook paid for WhatsApp less than two years later).

Moreover, Facebook did figure out how to monetise its mobile usage. Cautiously at first, it began embedding adverts into consumers’ newsfeeds, so that they were difficult to ignore. Although Facebook and some commentators worried that consumers would find these adverts annoying, the newsfeed ads have proven to be highly effective and Facebook continued to grow. In October 2012, now a public company, Facebook triumphantly announced it had one billion active users, with 604 million of them using the mobile site.

Even so, Facebook spent much of 2013 tinkering and experimenting with changes to the user experience. For example, it altered the design of the newsfeed making the images bigger and adding in new features. But some commentators complained that the changes made the site more complicated and confusing, rather than simplifying it for mobile users equipped with a relatively small screen. In April 2013, Facebook tried a different tack, launching Facebook Home, a user interface layer for Android-compatible phones that provides a replacement home screen.

And Zuckerberg continued to worry about upstart mobile-orientated competitors. In November 2013, a number of news outlets reported that Facebook offered to buy Snapchat, which enables users to send messages that disappear after a set period, for US$3 billion. But the offer was turned down.

A few months later, Facebook announced it was acquiring the popular mobile messaging app WhatsApp for what amounted to more than US$21 billion at the time of completion.

In 2014 – going on the offensive

By acquiring WhatsApp at great expense, Facebook alleviated immediate concerns that the social network could be dislodged by another disruptor, freeing up Zuckerberg to turn his attention to new technologies and new markets. The acquisition also put to rest investors’ immediate fears that Facebook could be superseded by a more fashionable, dedicated mobile service, pushing up the share price (see the section on Facebook’s valuation). In May 2014, Facebook wrong-footed many industry watchers and some of its rivals by announcing it had agreed to acquire Oculus VR, Inc., a leading virtual reality company, for US$2 billion in cash and stock.

Zuckerberg has since described the WhatsApp and Oculus acquisitions as “big bets on the next generation of communication and computing platforms.” And Facebook is also investing heavily in organic expansion, increasing its headcount by 45% in 2014, while opening another data center in Altoona, Iowa.

Zuckerberg also continues to devote time and attention to Internet.org, a multi-company initiative to bring free basic Internet services to people who aren’t connected. Announced in August 2013, Internet.org has since launched free basic internet services in six developing countries. For example, in February 2015, Facebook and Reliance Communications launched Internet.org in India. As a result, Reliance customers in six Indian states (Tamil Nadu, Mahararashtra, Andhra Pradesh, Gujarat, Kerala, and Telangana) now have access to about 40 services ranging from news, maternal health, travel, local jobs, sports, communication, and local government information.

Zuckerberg said that more than 150 million people now have the option to connect to the internet using Internet.org, and the initiative had, so far, succeeded in connecting seven million people to the internet who didn’t before have access. “2015 is going to be an important year for our long term plans,” he noted.

The Facebook exception – no fear, more freedom

Although it is now listed, Facebook is clearly not a typical public company. Its massive lead in the social networking market has given it an unusual degree of freedom. Zuckerberg has a controlling stake in the social network (he is able to exercise voting rights with respect to a majority of the voting power of the outstanding capital stock) and the self-confidence to ignore any grumblings on Wall Street. Facebook is able to make acquisitions most other companies couldn’t contemplate and can continue to put Zuckerberg’s long-term objectives ahead of those of short-term shareholders. Like Amazon, Facebook frequently reminds investors that it isn’t trying to maximise short-term profitability. And unlike Amazon, Facebook may not even be trying to maximize long-term profitability.

On Facebook’s quarterly earning calls, Zuckerberg likes to talk about Facebook’s broad, long-term aims, without explaining clearly how fulfilling these objectives will make the company money. “In the next decade, Facebook is focused on our mission to connect the entire world, welcoming billions of people to our community and connecting many more people to the internet through Internet.org (see Figure 2),” he said in the January 2015 earnings call. “Similar to our transition to mobile over the last couple of years, now we want to really focus on serving everyone in the world.”

Figure 2: Zuckerberg is pushing hard for the provision of basic Internet services


Source: Facebook.com

Not all of the company’s investors are entirely comfortable with this mission. On that earnings call, one analyst asked Zuckerberg: “Mark, I think during your remarks in every earnings call, you talk to your investors for a considerable amount of time about Facebook’s efforts to connect the world, and specifically about Internet.org which suggest you think this is important to investors. Can you clarify why you think this matters to investors?”

Zuckerberg’s response: “It matters to the kind of investors that we want to have, because we are really a mission-focused company. We wake up every day and make decisions because we want to help connect the world. That’s what we’re doing here.

“Part of the subtext of your question is that, yes, if we were only focused on making money, we might put all of our energy on just increasing ads to people in the US and the other most developed countries. But that’s not the only thing that we care about here.

“I do think that over the long term, that focusing on helping connect everyone will be a good business opportunity for us, as well. We may not be able to tell you exactly how many years that’s going to happen in. But as these countries get more connected, the economies grow, the ad markets grow, and if Facebook and the other services in our community, or the number one, and number two, three, four, five services that people are using, then over time we will be compensated for some of the value that we’ve provided. This is why we’re here. We’re here because our mission is to connect the world. I just think it’s really important that investors know that.”

Takeaways

Facebook may be a public company, but it doesn’t worry much about shareholders’ short-term aspirations. It often behaves like a private company that is focused first and foremost on fulfilling the goals of its founder. It is clear Zuckerberg is playing the long game. But it isn’t clear what yardsticks he is using to measure success. Although Zuckerberg knows Facebook needs to be profitable enough to ensure investors’ continued support, his primary goal may be to bring hundreds of millions more people online and secure his place in posterity. There is a danger that Zuckerberg’s focus on connecting people in Africa and developing Asia means that there won’t be sufficient top management attention on the multi-faceted digital commerce struggle with Google in North America and Western Europe.

Financials and business model

Network effects still strong

Within that wider mission to connect the world, Facebook continues to do a great job of connecting people to Facebook. Fuelled by network effects, Facebook says that 1.39 billion people now use Facebook each month (see Figure 3) and 890 million people use the service daily, an increase of 165 million monthly active users and 133 million daily active users in 2014. In developed markets, many consumers use Facebook as a primary medium for communications, relying on it to send messages, organize events and relay their news. As a result, in parts of Europe and North America, adults without a Facebook account are increasingly considered eccentric.

Figure 3: Facebook’s user base continues to grow rapidly

Source: Facebook and STL Partners analysis

Having said that, some active users are clearly more active and valuable than others. In a regulatory filing, Facebook admits that some active users may, in fact, be bots: “Some of our metrics have also been affected by applications on certain mobile devices that automatically contact our servers for regular updates with no user action involved, and this activity can cause our system to count the user associated with such a device as an active user on the day such contact occurs. The impact of this automatic activity on our metrics varied by geography because mobile usage varies in different regions of the world.”

This automatic polling of Facebook’s servers by mobile devices makes it difficult to judge the true value of the social network’s user base. Anecdotal evidence suggests many people with Facebook profiles are kept active on Facebook primarily by their smartphone apps, rather than because they are actively choosing to use the service. Still, Facebook would argue that these people are seeing the notifications on their mobile devices and are, therefore, at least partially engaged.


  • Executive Summary
  • How Facebook is changing
  • A history of adaptation
  • The Facebook exception – no fear, more freedom
  • Financials and business model
  • Growth prospects for the core business
  • User growth
  • Monetisation – better targeting, higher prices
  • Mobile advertising spend lags behind usage
  • The Facebook Platform – Beyond the Walled Garden
  • Multimedia – taking on YouTube
  • Search – challenging Google’s core business
  • Enabling transactions – moving beyond advertising
  • Virtual reality – a long-term game
  • Takeaways
  • Threats and risks
  • Facebook fatigue
  • Google – Facebook enemy number one
  • Privacy concerns
  • Wearables and the Internet of Things
  • Local commerce – in need of a map
  • Facebook and communication services
  • Conclusions
  • Facebook is spread too thin
  • Partnering with Facebook – why and how
  • Competing with Facebook – why and how


  • Figure 1: From student matchmaking service to a leading digital commerce platform
  • Figure 2: Zuckerberg is pushing hard for the provision of basic Internet services
  • Figure 3: Facebook’s user base continues to grow rapidly
  • Figure 4: Facebook’s revenue growth has accelerated in the past two years
  • Figure 5: Facebook’s ARPU has risen sharply in the past two years
  • Figure 6: After wobbling in 2012, investors’ belief in Facebook has strengthened
  • Figure 7: Despite a rebound, Facebook’s valuation per user is still below its peak
  • Figure 8: Facebook could be serving 2.3 billion people by 2020
  • Figure 9: Share of digital advertising – Facebook is starting to close the gap on Google but remains a long way behind
  • Figure 10: The gap between click through rates for search and social remains substantial
  • Figure 11: Social networks’ revenue per click is rising but remains 40% of search
  • Figure 12: Facebook’s advertising has moved from the right column to centre stage
  • Figure 13: Facebook’s startling mobile advertising growth
  • Figure 14: Zynga’s share price reflects decline of Facebook.com as an app platform
  • Figure 15 – Facebook Connect – an integral part of the Facebook Platform
  • Figure 16: Leading Internet players’ share of social log-ins over time
  • Figure 17: Facebook’s personalised search proposition
  • Figure 18: Facebook’s new buy button – embedded in a newsfeed post
  • Figure 19: The rise and rise of Android – not good for Facebook
  • Figure 21: Facebook and Google are both heavily associated with privacy issues
  • Figure 22: Facebook wants to conquer the Wheel of Digital Commerce
  • Figure 23: Facebook’s cash flow is far behind that of Google and Apple
  • Figure 24: Facebook’s capital expenditure is relatively modest compared with peers
  • Figure 25: Facebook’s capex/revenue ratio has been high but is falling


Strategy 2.0: Google’s Strategic Identity Crisis

Summary: Google’s shares have made little headway recently despite its dominance in search and advertising, and it faces increasing regulatory threats in this area. It either needs to find new sources of value growth or start paying out dividends, like Microsoft, Apple (or indeed, a telco). Overall, this is resulting in something of a strategic identity crisis. A review of Google’s strategy and implications for Telcos. (March 2012, Executive Briefing Service, Dealing with Disruption Stream).

Google's Advertising Revenues Cascade

  Read in Full (Members only)  Buy a single user license online  To Subscribe click here

Below is an extract from this 24 page Telco 2.0 Report that can be downloaded in full in PDF format by members of the Telco 2.0 Executive Briefing service and the Telco 2.0 Dealing with Disruption Stream here. Non-members can subscribe here, buy a Single User license for this report online here for £595 (+VAT for UK buyers), or for multi-user licenses or other enquiries, please email contact@telco2.net / call +44 (0) 207 247 5003. We’ll also be discussing our findings and more on Google at the Silicon Valley (27-28 March) and London (12-13 June) New Digital Economics Brainstorms.

To share this article easily, please click:


Executive Summary

Google appears to be suffering from a strategic identity crisis. It is the giant of search advertising but it also now owns a handset maker, fibre projects, an increasingly fragmented mobile operating system, a social network of questionable success, and a driverless car programme (among other things). It has a great reputation for innovation and creativity, but risks losing direction and value by trying to focus on too many strategies and initiatives.

We believe that Google needs to stop trying to copy what Apple and Facebook are doing, de-prioritise its ‘Hail Mary’ hunt for a strategy (e.g. driverless cars), and continue to build new solutions that serve better the customers who are already willing to pay – namely, advertisers.

It is our view that the companies who have created most value in the market have done so by solving a customer problem really well. Apple’s recent success derives from creating a simpler and more beautiful way (platform + products) for people to manage their digital lives. People pay because it’s appealing and it works.

Google initially solved how people could find relevant information online and then, critically, how to use this to help advertisers get more customers. They do this so well that Google’s $37bn revenues continue to grow at double digit pace, and there’s plenty of headroom in the market for now. While the TV strategy may not yet be paying off, it would seem sensible to keep working at it to try to keep extending the reach of Google’s platform. 

While Android keeps Google in the mobile game to a degree, and has certainly helped to constrain certain rivals, we think Google should cast a hard eye over its other competing and distracting activities: Motorola, Payments, Google +, Driverless Cars etc. Its management team should look at the size of the opportunity, the strength of the competition, and their ability to execute in each. 

Pruning the projects might also lose Google an adversary or two, and it might also afford some reward to shareholders too. After all, even Apple has recently decided to pay back some cash to investors.

This may be very difficult for Google’s current leadership. Larry Page seems to have the restless instincts of the stereotypical Valley venture capitalist, hunting the latest ideas, and constantly trying to create the next big beautiful thing. The trouble is that this is Google in 2012, not 1995, and it looks to us at least that a degree of ‘sticking to the knitting’ within Google’s huge, profitable and growing search advertising business may be a better bet than the highly speculative (and expensive) ‘Hail Mary’ strategy route. 

This may sound surprising coming from us, the inveterate fans of innovation at Telco 2.0, so we’d like to point out some important differences between the situations that Google and the telcos are in:

  • Google’s core markets are growing, not flat or shrinking, and are at a different life-stage to the telecoms market;
  • Google is global, rather than being confined to any given geography. There are many opportunities still out there.
  • We are not saying that Google should stop innovating, but we are saying it should focus its innovative energy more clearly on activities that grow the core business.

Introduction

In January this year, Google achieved a first – it missed the consensus forecast for its quarterly earnings. There is of course no magic in the consensus, which is an average of highly conventionalised guesses from a bunch of City analysts, but it is as good a moment as ever to review Google’s strategic position. If you bought Google stock at the beginning, you may not need to read this, as you’re probably very rich (the return since then is of the order of 400%). The entirety of this return, however, is accounted for by the 2004-2007 bull run. On a five-year basis, Google stock is ahead 30%, which sounds pretty impressive (a 6% annual return), but again, all the growth is accounted for by the last surge upwards over the summer of 2007. The peak was achieved on the 2nd of November, 2007. 

As this chart shows, Google stock is still down about 9% from the peak, and perhaps more importantly, its path tracks Microsoft very closely indeed. Plus Microsoft investors get a dividend, whereas Google investors do not.

Figure 1: Google, Microsoft 2.0?

Google, Microsoft 2.0?
Source: Google Finance

Larry Page is reported to have said that “Google is no longer a “search company.” He says its model is now 

“invent wild things that will help humanity, get them adopted by users, profit, and then use the corporate structure to keep inventing new things.”

No longer a search company? Take a look at the revenues. Out of Google’s $37.9bn in revenues in 2011, $36bn came from advertising, aka the flip side of Google Search. Despite a whole string of mammoth product launches since 2007, Google’s business is essentially what it was in 2007 – a massive search-based advertising machine.

Google’s Challenges

Our last Google coverage – Android: An Anti-Apple Virus ? and the Dealing with the Disruptors Strategy Report   suggested that the search giant was suffering from a lack of direction, although some of this was accounted for by a deliberate policy of experimenting and shutting down failed initiatives.

Since then, Google has launched Google +, closed Google Buzz, and closed Google Wave while releasing it into a second life as an open-source project. It has been involved in major litigation over patents and in regulatory inquiries. It has seen an enormous boom in Android shipments but not necessarily much revenue. It is about to become a major hardware manufacturer by acquiring Motorola. And it has embarked on extensive changes to the core search product and to company-wide UI design.

In this note, we will explore Google’s activities since our last note, summarise key threats to the business and strategies to counter them, and consider if a bearish view of the company is appropriate.

We’ve found it convenient to organise Google’s business  into several themed groups as follows:

1: Questionable Victories

Pyrrhic victory is defined as a victory so costly it is indistinguishable from defeat. Although there is nothing so bad at Google, it seems to have a knack of creating products that are hugely successful without necessarily generating cash. Android is exhibit A. 

The obvious point here is surging, soaring growth – forecasts for Android shipments have repeatedly been made, beaten on the upside, adjusted upwards, and then beaten again. Android has hugely expanded the market for smartphones overall, caused seismic change in the vendor industry, and triggered an intellectual property war. It has found its way into an awe-inspiring variety of devices and device classes.

But questions are still hanging over how much actual money is involved. During the Q4 results call, a figure for “mobile” revenues of $2.5bn was quoted. This turns out to consist of advertising served to browsers that present a mobile device user-agent string. However, Google lawyer Susan Creighton is on record as saying  that 66% of Google mobile web traffic originates from Apple iOS devices. It is hard to see how this can be accounted for as Android revenue.

Further, the much-trailed “fragmentation” began in 2011 with a vengeance. “Forkdroids”, devices using an operating system based on Android but extensively adapted (“forked” from the main development line), appeared in China and elsewhere. Amazon’s Kindle Fire tablet is an example closer to home.

And the intellectual property fights with Oracle, Apple, and others are a constant source of disruption and a potentially sizable leakage of revenue. In so far as Google’s motivation in acquiring Motorola Mobility was to get hold of its patent portfolio, this has already involved very large sums of money. Another counter-strategy is the partnership with Intel and Lenovo to produce x86-based Android devices, which cannot be cheap either and will probably mean even more fragmentation.

This is not the only example, though – think of Google Books, an extremely expensive product which caused a great deal of litigation, eventually got its way (although not all the issues are resolved), and is now an excellent free tool for searching in old books but no kind of profit centre. Further, Google’s patented automatic scanning has the unfortunate feature of pulling in marginalia, etc. from the original text that its rivals (such as Amazon Kindle) don’t.
Further, Google has recently been trying to monetise one of its classic products, the Google Maps API that essentially started the Web 2.0 phenomenon, with the result that several heavy users (notably Apple and Foursquare)  have migrated to the free OpenStreetMap project and its OpenLayers API.

2: Telco-isation

Like a telco, Google is dependent on one key source of revenue that cross-subsidises the rest of the company – search-based advertising. 

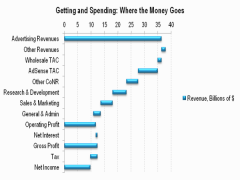
Figure 2: Google’s advertising revenues cascade into all other divisions

Google's Advertising Revenues Cascade

[NB TAC = Traffic Acquisition Cost, CoNR = Cost of Net Revenues]

Having proven to be a category killer for search and advertising across the  whole of the Internet, the twins (search and ads) are hugely critical for Google and also for millions of web sites, content creators, and applications developers. As a result, just like a telco, they are increasingly subject to regulation and political risk. 

Google search rankings have always been subject to an arms race between the black art of search-engine optimisation and Google engineers’ efforts to ensure the integrity of their results, but the whole issue has taken a more serious twist with the arrival of a Federal Trade Commission inquiry into Google’s business practices. The potential problems were dramatised by the so-called “white lady from Google”  incident at Google Kenya, where Google employees scraped a rival directory website’s customers and cold-called them, misrepresenting their competitors’ services, and further by the $500 million online pharmacy settlement. Similarly, the case of the Spanish camp site that wants to be disassociated from horrific photographs of a disaster demonstrates both that there is a demand for regulation and that sooner or later, a regulator or legislator will be tempted to supply it.

The decision to stream Google search quality meetings online should be seen in this light, as an effort to cover this political flank.

As well as the FTC, there is also substantial regulatory risk in the EU. The European Commission, in giving permission for the Motorola acquisition, also stated that it would consider further transactions involving Google and Motorola’s intellectual property on a case-by-case basis. To put it another way, after the Motorola deal, the Commission has set up a Google Alert for M&A activity involving Google.

3: Look & Feel Problems

Google is in the process of a far-reaching refresh of its user interfaces, graphic design, and core search product. The new look affects Search, GMail, and Google + so far, but is presumably going to roll out across the entire company. At the same time, they have begun to integrate Google + content into the search results.

This is, unsurprisingly, controversial and has attracted much criticism, so far only from the early adopter crowd. There is a need for real data to evaluate it. However, there are some reasons to think that Search is looking in the wrong place.

Since the major release codenamed Caffeine in 2008, Google Search engineers have been optimising the system for speed and for first-hit relevance, while also indexing rapidly-changing content faster by redesigning the process of “spidering” web sites to work in parallel. Since then, Google Instant has further concentrated on speed to the first result. In the Q4 results, it was suggested that mobile users are less valuable to Google than desktop ones. One reason for this may be that “obvious” search – Wikipedia in the first two hits – is well served by mobile apps. Some users find that Google’s “deep web” search has suffered.

Under “Google and your world”, recommendations drawn from Google + are being injected into search results. This is especially controversial for a mixture of privacy and user-experience reasons. Danny Sullivan’s SearchEngineLand, for example, argues that it harms relevance without adding enough private results to be of value. Further, doubt has been cast on Google’s numbers regarding the new policy of integrating Google accounts into G+ and G+ content into search.

Another, cogent criticism is that it introduces an element of personality that will render regulatory issues more troublesome. When Google’s results were visibly the output of an algorithm, it was easier for Google to claim that they were the work of impartial machines. If they are given agency and associated with individuals, it may be harder to deny that there is an element of editorial judgment and hence the possibility of bias involved.

Social search has been repeatedly mooted since the mid-2000s as the next-big-thing, but it seems hard to implement. Yahoo!, Facebook, and several others have tried and failed.

Figure 3: Google + on Google Trends: fading into the noise?

 Google + on Google Trends: Fading Into the Noise?
Source: Google Trends

It is possible that Google may have a structural weakness in design as opposed to engineering (which is as excellent as ever). This may explain why a succession of design-focused initiatives have failed – Wave and Buzz have been shut down, Google TV hasn’t gained traction (there are less than one million active devices), and feedback on the developer APIs is poor.

4: Palpable Project Proliferation

Google’s tendency to launch new products is as intimidating as ever. However, there is a strong argument that its tireless creativity lacks focus, and the hit-rate is worrying low. Does Google really need two cut-down OSs for ultra-mobile devices? It has both Android, and ChromeOS, and if the first was intended for mobile phones and the second for netbooks, you can now buy a netbook-like (but rather more powerful) Asus PC that runs Android. Further, Google supports a third operating system for its own internal purposes – the highly customised version of Linux that powers the Google Platform – and could be said to support a fourth, as it pays the Mozilla Foundation substantial amounts of money under the terms of their distribution agreement and their Boot to Gecko project is essentially a mobile OS. IBM also supported four operating systems at its historic peak in the 1980s.  

Also, does Google really need to operate an FTTH network, or own a smartphone vendor? The Larry Page quote we opened with tends to suggest that Google’s historical tendency to do experiments is at work, but both Google’s revenue raisers (Ads and YouTube, which from an economic point of view is part of the advertising business) date from the first three years as a public company. The only real hit Google has had for some time is Android, and as we have seen, it’s not clear that it makes serious money.

Google Wallet, for example, was launched with a blaze of publicity, but failed to attract support from either the financial or the telecoms industry, rather like its predecessor Google Checkout. It also failed to gain user adoption, but it has this in common with all NFC-based payments initiatives. Recently, a major security bug was discovered, and key staff have been leaving steadily, including the head of consumer payments. Another shutdown is probably on the cards. 

Meanwhile, a whole range of minor applications have been shuttered

Another heavily hyped project which does not seem to be gaining traction is the Chromebook, the hardware-as-a-service IT offering aimed at enterprises. This has been criticised on the basis that its $28/seat/month pricing is actually rather high. Over a typical 3 year depreciation cycle for IT equipment, it’s on a par with Apple laptops, and has the restriction that all the applications must work in a Web browser on netbook-class hardware. Google management has been promoting small contract wins in US school districts . Meanwhile, it is frequently observed that Google’s own PC fleet consists mostly of Apple hardware. If Google won’t use them itself, why should any other enterprise IT shop do so? The Google Search meeting linked above contains 2 Lenovo ThinkPads and 13 Apple MacBooks of various models and zero Chromebooks, while none other than Eric Schmidt used a Mac for his MWC 2012 keynote. Traditionally, Google insisted on “dogfooding” its products by using them internally.

The Google Fibre project in Kansas City, for its part, has been struggling with regulatory problems related to its access to city-owned civil infrastructure. Kansas City’s utility poles have reserved areas for different services, for example telecoms and electrical power. Google was given the concession to string the fibre in the more spacious electrical section – however, this requires high voltage electricians rather than telecoms installers to do the job and costs substantially more. Google has been trying to change the terms, and use the telecoms section, but (unsurprisingly) local cable and Bell operators are objecting. As with the muni-WLAN projects of the mid-2000s, the abortive attempt to market the Nexus One without the carriers, and Google Voice, Google has had to learn the hard way that telecoms is difficult.

And while all this has been going on, you might wonder where Google Enterprise 2.0 or Google Ads 2.0 are.

5. Google Play – a Collection of Challenges?

Google recently announced its “new ecosystem”, Google Play. This consists of what was historically known as the Android Market, plus Google Books, Google Music, and the web-based elements of Google Wallet (aka Google Checkout). All of these products are more or less challenged. Although the Android Market has been a success in distributing apps to the growing fleets of Android devices, it continues to contain an unusually high percentage of free apps, developer payouts tend to be lower than on its rivals, and it has had repeated problems with malware. Google Books has been an expensive hobby, involving substantial engineering work and litigation, and seems unlikely to be a profit centre. Google Music – as opposed to YouTube – is also no great success, and it is worth asking why both projects continue.

However, it will be the existing manager of Google Music who takes charge, with Android Market management moving out. It is worth noting that in fact there were two heads of the Android Market – Eric Chu for developer relations and David Conway for product management. This is not ideal in itself.

Further, an effort is being made to force app developers to use the ex-Google Checkout system for in-app billing. This obviously reflects an increased concern for monetisation, but it also suggests a degree of “arguing with the customers”.

To read the note in full, including the following additional analysis…

  • On the Other Hand…
  • Strengths of the Core Business
  • “Apple vs. Google”
  • Content acquisition
  • Summary Key Product Review
  • Search & Advertising
  • YouTube and Google TV
  • Communications Products
  • Android
  • Enterprise
  • Developer Products
  • Summary: Google Dashboard
  • Conclusion
  • Recommendations for Operators
  • The Telco 2.0™ Initiative
  • Index

…and the following figures…

  • Figure 1: Google, Microsoft 2.0?
  • Figure 2: Google’s advertising revenues cascade into all other divisions
  • Figure 3: Google + on Google Trends: fading into the noise?
  • Figure 4: Google’s Diverse Advertiser Base
  • Figure 5: Google’s Content Acquisition. 2008-2009, the missing data point
  • Figure 6: Google Product Dashboard

Members of the Telco 2.0 Executive Briefing Subscription Service and the Telco 2.0 Dealing with Disruption Stream can download the full 24 page report in PDF format hereNon-Members, please subscribe here, buy a Single User license for this report online here for £595 (+VAT for UK buyers), or for multi-user licenses or other enquiries, please email contact@telco2.net / call +44 (0) 207 247 5003.

Organisations, geographies, people and products referenced: AdSense, AdWords, Amazon, Android, Apple, Asus, AT&T, Australia, BBVA, Bell Labs, Boot to Gecko, Caffeine, CES, China, Chromebook, ChromeOS, ContentID, David Conway, Eric Chu, Eric Schmidt, European Commission, Facebook, Federal Trade Commission, GMail, Google, Google +, Google Books, Google Buzz, Google Checkout, Google Maps, Google Music, Google Play, Google TV, Google Voice, Google Wave, GSM, IBM, Intel, Kenya, Keyhole Software, Kindle Fire, Larry Page, Lenovo, Linux, MacBooks, Microsoft, Motorola, Mozilla Foundation, Netflix, Nexus, Office 365, OneNet, OpenLayers API, OpenStreetMap, Oracle, Susan Creighton, ThinkPads, VMWare, Vodafone, Western Electric, Wikipedia, Yahoo!, Your World, YouTube, Zynga

Technologies and industry terms referenced: advertisers, API, content acquisition costs, driverless car, Fibre, Forkdroids, M&A, mobile apps, muni-WLAN, NFC, Search, smart TV, spectrum, UI, VoIP, Wallet

Connected TV: Forecasts and Winners/Losers (UK Case Study)

Summary: our in-depth look at the UK’s highly competitive digital TV market which reflects many global trends, such as competition between different types of content distributor (LoveFilm, YouTube, Virgin Media, BBC, BSkyB, BT, etc.), channel proliferation, new devices used for viewing,  and the increasing prevalence of connected TVs. What are the key trends and who will be the winners and losers? (August 2011, Executive Briefing Service) Chart from Connected TV Figure 2 telco 2.0


  Read in Full (Members only)    Buy This Report    To Subscribe

Below is an extract from this 23 page Telco 2.0 Report that can be downloaded in full in PDF format by members of the Telco 2.0 Executive Briefing service here. Non-members can buy a Single User license for this report online here for £595 (+VAT) or subscribe here. For multiple user licenses, or to book a place at our Digital Entertainment 2.0 workshop on New Business Models for the Home Video Entertainment market in Europe – Lessons from America at our London Executive Brainstorm on 8th November, please email contact@telco2.net or call +44 (0) 207 247 5003.

To share this article easily, please click:

Introduction and Background

With every wave of innovation, there are always winners and losers. In this note we examine who are likely to be the winners and losers in the UK as increasingly, TVs become connected to the internet.

While it is difficult to generalise with TV markets across the globe as the markets are fundamentally different in structure, especially with key variables such as PayTV penetration, state broadcaster involvement and fast broadband penetration varying widely, the comprehensive range of players and highly competitive nature of the UK market makes it a useful benchmark for many key global trends.

The UK TV Market

According to OFCOM’s latest research, there are 26.6m TV households in the UK with 60m TV sets or an average of 2.25 TV sets per household.

TV Viewing

Figure 1 – Average UK TV Viewing Per Day

Chart of average UK TV viewing to 2010 Fig 1 Connected TV Article Telco 2.0

Source: BARB.

TV viewing over the last few years has been remarkably resilient despite the internet and other platforms competing hard for attention. Where the TV market differs is that average consumption is very strongly proportional to age. In typical technology adoption cycles, adoption is indirectly proportional to age. This presents a real challenge to the connected TV market: the main TV consumers are more than likely to be adverse to technological change.

TV Device Manufacturers

Figure 2 – Annual UK TV Set Sales by Type 2002-2010

Chart of annual UK TV Set Sales to 2010 Fig 2 Connected TV Telco 2.0

The long term volume trend for TV manufacturers has been healthy. This has mainly been due to the innovation in device form and screen quality, with flat screen and HD features becoming the norm. TV manufacturers are now hoping that internet connected TV’s will generate another spurt in growth. Samsung and Sony are the UK market leaders.

But the challenge is the replacement cycles. With a 60m installed base of TV’s in the UK, and assuming that all the 9.5m TV’s sold in 2010 are replacements and not simply increasing the number of sets per household, the implication is that the replacement cycle is currently roughly every six years at a minimum. This is relatively slow when compared to two years for mobile phones and three years for laptops, and this in turn suggests that the adoption rate for standalone connected TVs will be much slower than the technology cycles for these devices.

While we expect internet connectivity to become a pretty standard feature with TV over the next couple of years we are sceptical about their active use for viewing video. The content offering is currently too limited. We would be surprised if within a couple of years, there are more than 1m homes regularly using TVs to watch video over the internet.

Set Top Boxes

The Set Top Box market in the UK falls into two categories: a subsidised segment which the consumer generally gets either for free or heavily discounted by their PayTV provider; and a retail segment where the consumer generally pays a full price and gives the consumer access to a limited set of free to air (FTA) channels and quite often DVR features.

In the subsidised segment, the market leader is Sky which currently manufacturers its own boxes. All the current models contain internet connectivity but require a subscription to Sky Broadband service to access Sky’s closed pull VOD service, Sky Anytime+. Sky has seeded the market for quite a few years with its Sky+ HD boxes which are currently in a minimum of 3,822k UK homes. We say a minimum because the figure is for homes with a HD subscription and Sky also installs a HD box for homes who do not subscribe to HD. This market seeding strategy accounts for the high initial take-up of the Sky Anytime+ service of 800k in the first quarter of launch. Since the service is effectively free, or rather bundled into the Sky TV and Broadband prices, we expect a rapid take up and within a couple of years Sky will have over 4m homes with their main TV connected to the internet.

Virgin Media has chosen TiVo as its exclusive connected set top box provider. The TiVo box is more open than the Sky box with the future promise of allowing independent Flash developers to deploy applications. TiVo is off to a steady start with around 50k homes in the first quarter of 2011. We expect TiVo adoption to be slower than Sky because the need for a new box which is priced at £50 with an ongoing service fee of £3/month. We expect these prices to reduce over time, but still can envisage an uptake of over 2m homes within two to three years assuming effective promotion by Virgin Media.

Another interesting opportunity is the launch of YouView. YouView is expected to come in two flavours, subsidised by CSPs and retail. BT and TalkTalk are shareholders, and are committed to launching YouView boxes by Pace and Huawei respectively in time for the London Olympics in 2012. Humax is committed to launching retail boxes. It is too early to properly forecast demand for YouView as neither the pricing or applications have yet been revealed. However, we struggle to see an installed base of over 1m homes even with the large base of broadband connections that BT and TalkTalk can market the product to.
All the original BT Vision set top boxes were manufactured by Pace (through their purchase of Philips) and need to be connected to BT broadband and therefore the whole of 575k subscribers count as connected TVs. We expect over time for BT to replace these BT Vision boxes with YouView boxes.

The major problem for YouView is that it is a proprietary UK standard whereas other European countries are committing to the hbbTV standard. This places other set top box makers in something of a quandary – will the UK market be large enough to support product development costs? Sony, Technicolour and Cisco have already publically stated that they have no current plans to develop a YouView box.

Other commentators express confidence in the Bluray players to provide the TV connectivity. We are bears of Bluray players and think the market will be niche at best.

Games Consoles

Figure 3 – Gaming Console Household Penetration

Chart of Gaming Consoles per UK Household Fig 3 Telco 2.0

Source: Ofcom residential tracker, w1 2011. Base: All adults 16+ (3,474)

Around half of UK homes contain a games console. The market is dominated by Microsoft, Sony and Nintendo and a growing number of consoles are connected to the internet. Primarily, for online gaming, but also for watching video content either via the internet or through playback of physical media such as DVD or Bluray.

Figure 4 – What UK Consumers use games consoles for

Chart of uses of gaming consoles 2010 Fig 4 Telco 2.0

Source: Ofcom residential tracker, w1 2011. Base: all adults 16+ with access to a games console at home (1,793).

We expect Gaming Consoles to become the most important method for secondary TV sets to connect to the internet, especially in children’s bedrooms. As more and more gaming moves online, we can easily see 75% of gaming consoles regularly connecting to the internet (c. 10m). However, the proportion using the console for regularly viewing video will remain small, perhaps as low as 20%. This will mean that although important Gaming Consoles will be secondary to STB’s for watching video over the internet.

To read the note in full, including additional analysis on…

  • Communications Service Providers (CSPs)
  • BT
  • Sky
  • Virgin Media
  • TalkTalk
  • Others
  • ‘Mainstream’ TV Channels
  • The BBC
  • New Entrants and Online Players
  • LoveFilm
  • Google – YouTube
  • Apple
  • Conclusions

…and the following charts…

  • Figure 1 – Average UK TV Viewing Per Day
  • Figure 2 – Annual UK TV Set Sales by Type 2002-2010
  • Figure 3 – Gaming Console Household Penetration
  • Figure 4 – What UK Consumers use games consoles for
  • Figure 5 – Main UK CSPs – Broadband and TV reach
  • Figure 6 – Take-up of multichannel TV on main sets
  • Figure 7 – Video on demand use in Virgin Media Homes
  • Figure 8 – Total UK TV Revenue by Sector
  • Figure 9 – UK TV Channel shares in all homes 1983-2010
  • Figure 10 – UK Online TV revenues by type of service
  • Figure 11 – Unique audiences to selected online film and TV sites
  • Figure 12 – Unique audiences to selected video-sharing sites
  • Figure 13 – Forecast of Connected TV market by device in 2013
  • Figure 14 – Table summarising strategy and winners/losers by type 19

Members of the Telco 2.0 Executive Briefing Subscription Service can download the full 23 page report in PDF format here. Non-Members, please see here for how to subscribe, here to buy a single user license for £595 (+VAT), or for multi-user licenses and any other enquiries please email contact@telco2.net or call +44 (0) 207 247 5003.

Organisations and products referenced: Amazon, Apple, AppleTV, BBC, BSkyB, BT, BT Vision, Cisco, Flash, Google, Huawei, Humax, ITV, LoveFilm, Microsoft, Motorola, Nintendo, O2, OFCOM, Orange, Pace, Philips, Samsung, Sky, Sky Anytime+, Sky Go, Sony, TalkTalk, Technicolour, TiVo, TV manufacturers, Virgin Media, YouTube, YouView .

Technologies and industry terms referenced: Bluray, catch-up TV, Connected TV, Digital Terrestrial, DVD, DVR, flat screen, free to air, Games Consoles, hbbTV, HD, IPTV, online, PayTV, regulatory relief, replacement cycles, Set Top Box, Tablets, Video, Video on demand (VOD).

Strategy 2.0: The Six Key Telco 2.0 Opportunities

A summary of the six Telco 2.0 opportunities to transform telco’s business models for success in an IP-based, post PSTN world: Core Services, Vertical Solutions, Infrastructure Services, Embedded Communications, 3rd Party Enablers, and Own Brand OTT Services. It includes an extract from the Roadmap to New Telco 2.0 Business Models, updates on latest developments, and feedback from over 500 senior TMT industry execs. (July 2011, Executive Briefing Service, Transformation Stream). Telco 2.0 Six Key Opportunity Types Chart July 2011
  Read in Full (Members only)    Buy This Report    To Subscribe

Below is an extract from this 50 page Telco 2.0 Report that can be downloaded in full in PDF format by members of the Telco 2.0 Executive Briefing service and the Telco 2.0 Transformation Stream here. Non-members can buy a Single User license for this report online here for £795 (+VAT) or subscribe here. For multiple user licenses, package deals to buy this report and the Roadmap report together, or to find out about interactive strategy workshops on this topic, please email contact@telco2.net or call +44 (0) 207 247 5003.

To share this article easily, please click:

//

Background – The Roadmap to New Telco 2.0 Business Models

The Telco 2.0 Strategy Report ’The Roadmap to New Telco 2.0 Business Models’ published in April 2011 examines ways in which operators can extend and solidify their roles in the future ecosystem, making themselves a cornerstone of a new structure. This Executive Briefing contains extracts from the full Strategy Report, and updates and validates it with feedback from recent Telco 2.0 and New Digital Economics Executive Brainstorms in EMEA and the Americas.

Updating the Telecoms Business Model

For the past four years, STL Partners has been using an iconic diagram (see Figure 1, below) to illustrate our views about the role of ‘two-sided’ business models in the telecoms industry. It highlights the critical role of a telecom operator in enabling interactions between its traditional end-user (“downstream”) customers and a variety of new “upstream” parties, such as application developers and media companies. In 2007, we also introduced the concept of “distribution” of Telcos’ core services through these upstream channels, with the addition of a range of value-added B2B services based around the inherent capabilities of the network and service platform.

This concept of two-sided business models originally introduced in the Telco 2.0 Strategy Report The $125Bn ‘Two-Sided’ Telecoms Market Opportunity has to a degree become synonymous with Telco 2.0, and has been widely embraced by the industry. We have now decided it is time to update our definition of “Telco 2.0” to reflect both business model evolution and fundamental changes in the telecoms industry structure itself. While these trends are indeed driving adoption of multi-sided business models, we have also observed that that are redefining the landscape for ‘traditional’ one-sided telecom model as well.

Figure 1: The high-level Telco 2.0 Business Model diagram

Telco 2.0 Roadmap Two-Sided Business Model Schematic Chart

Source: STL Partners / Telco 2.0

Pressure on All Sides

In particular, it is critical to understand the increasing pressure on Telcos’ traditional markets and value propositions, on all sides – not just by Internet/media companies (so-called “over-the-top” players), but also by third-party infrastructure operators and wholesalers, network and device vendors, governments, and even end-users themselves. In addition, there have been delays and organisational complexities in exploiting the true potential of some “upstream” opportunities.

Newcomers such as Apple have developed their own communications/content ecosystems, regulators have pushed for structural separation, Governments have funded wholesale networks and application developers have cherry-picked lucrative domains such as social networking. Network equipment vendors are helping operators convert capex to opex – but in the process are themselves capturing more industry value through outsourcing. End-users have developed work-arounds to reduce their expenditure on telco services (e.g. “missed calls”).

Figure 2 – Telcos squeezed from all sides

Telco 2.0 Roadmap Report Telecoms Industry Squeeze Competitve Forces Chart

Source: Telco 2.0, The Roadmap to New Telco 2.0 Business Models

Taken together, the impact of these trends has led Telco 2.0 to expand its framework to embrace and refine its target market domains for telcos, especially in terms of innovation around advanced new “retail” services. We feel that it is becoming even more difficult for operators to navigate through this minefield – and if they are to succeed, they will need to develop and sell more appropriate, integrated and well-designed offerings. While defensive moves have their place, there is also an urgent need to innovate – but with well-focused efforts and resources.

Originally, we spoke of three business model elements for telcos: Improved retail telecoms services; ‘Distribution’ of core telecom products and services through alternate upstream channels; and delivery to upstream customers of value-added enablers. (In the past, we did not explicitly address wholesale telco-telco services, as they were essentially “internal machinery” of the day-to-day retail business).

Figure 3 – The three opportunity areas in the original Telco 2.0 business model

Telco 2.0 3 Original Business Model Opportunities Chart

Source: Telco 2.0, The $125Bn ‘Two-Sided’ Telecoms Market Opportunity

Introducing the New Telco 2.0 Framework

A long-term, strategic framework for is needed for telcos, both in fixed and mobile sectors. While the industry has strong cash flows, it needs to redefine its own space, exploit its strengths, and seek out areas of revenue growth and strong differentiation. Telcos also need to look for sources of their own profit in areas such as managed services, rather than just exploiting the cost savings offered by vendors and outsourcers.

Figure 4 – The New Telco 2.0 Industry Framework

Telco 2.0 Roadmap Report Telecoms Industry New Industry Framework Chart

Source: Telco 2.0, The Roadmap to New Telco 2.0 Business Models

Our new framework is an evolution of the old, incorporating the two-sided model, and defining six opportunity types, comprising three existing types previously defined by Telco 2.0:

  • Core services (previously ‘Enhanced retail’), which encompasses structural and strategic improvements to existing wholesale and retail services;
  • Embedded Communications (previously ‘Distribution platform’);
  • Third-party business enablers (previously ‘B2B VAS platform’);

and extending it in three main directions:

  • A separated and richer tier of Infrastructure services;
  • Explicitly identifying the integration of telecoms, IT and networking being undertaken by operators in the corporate space – Vertical industry solutions (SI)
  • Own-brand OTT services.

The Six Telco 2.0 Opportunity Types

We have grouped the opportunities into six types shown in the following diagram and discussed further in the rest of this report.

Figure 5 – the Six Telco 2.0 Opportunity Types

Telco 2.0 Roadmap Report Telecoms Industry Six Opportunities Chart

Source: Telco 2.0, The Roadmap to New Telco 2.0 Business Models

1. Core services (previously Retail Services), which encompasses transformational structural and strategic improvements to existing mainstream “Telco 1.0” offerings such as subscriptions, telephony and broadband access. These will remain at the core of telco revenues irrespective of other shifts, enhanced by the smart and targeted delivery of improved offers, manifesting in benefits via revenue addition, up-sell, and customer satisfaction. Our research identifies a portfolio of approaches here, such as:

  • Incremental improvements to basic products’ quality or speed;
  • Exploitation of new device categories driving service adoption and usage;
  • Supply of added-value content and services;
  • Better segmentation and customisation;
  • More targeted, personalised and granular pricing;
  • Better channels to market;
  • Efforts to gain improved (and genuine) loyalty and value perception;
  • Innovative ways to drive incremental usage and spending, for example through incentives and promotions.

In parallel with the revenue drivers, operators are also focusing on cost savings, throughout network operations and other areas such as retail channel costs and commissions, device subsidies and so forth.

2. Vertical industry solutions have been developed by fixed operators over the last decade and now starting to be demanded by customers for mobile solutions too. They comprise telephony services (voice and data) being integrated with IT with the operator acting in a systems integrator role to provide a complete solution. These solutions are tailored and packaged for specific vertical industries – transport, logistics, banking, government, manufacturing, utilities, etc. Companies such as BT (with BT Global Services), Orange (with Business Services) and Deutsche Telekom (with T-Systems) are examples of companies that have moved aggressively into this area.

3. A separated and richer tier of Infrastructure services, which includes telecom capacity “bulk” wholesale, as well as more granular “distribution” two-sided business models and aspects of hosting/cloud services. Some of these offerings have been around for a long time – bitstream ADSL, unbundled local loop sales and so forth. Others (data MVNOs, wholesale wireless networks) are relatively new. At the same time, operators are cutting new deals with each other for network sharing, backhaul provision, national roaming and so forth. We are splitting the new services out in this category, as a reflection of their impact on the cost side of operators’ business models, and new regulatory regimes (such as open access) that are redefining industry structure in many markets.

4. Embedded communications (previously Distribution Platform) – essentially the delivery to consumers of basic telecom services, primarily voice telephony, SMS and broadband data access, through new routes such as application-embedded functions or devices which “come with data” pre-provisioned.

5. Third-party Enablers (previously B2B VAS Platform) – the provision of extra capabilities derived from the operator’s ’platform’ rather than just network transport. This includes functions such as billing-on-behalf, location, authentication and call-control, provided as basic building blocks to developers and businesses, or abstracted to more complex and full-featured enablers (for example, a location-enabled appointment reminder service). Another class of third-party enablers originates in the huge customer databases that Telcos maintain – in theory, it should be possible to monetise these through advertising or provision of aggregated data to 3rd parties – subject to privacy constraints.

6. Own-brand OTT services. Many operators are starting to exploit the scale of the wider Internet or smartphone universe, by offering content, communications and connectivity services outside the perimeter of their own access subscriber base. With a target market of 1-2bn people, it is (in theory) much easier to lower per-unit production costs for new offerings and gain “viral” adoption. It avoids the politics and bureaucracy of partnerships and industry-wide consortia – and potentially has the ‘pot-of-gold’ of creating huge value from minimal capital investment. On the downside, the execution risks are significant – as is the potential for self-cannibalisation of existing services.

Figure 6 – The Six Opportunity Areas – Strategy, Typical Services and Examples

Telco 2.0 Roadmap Six Opportunities Examples Table

Source: Telco 2.0, The Six Opportunity Types Executive Briefing

To read the report in full, including the following contents…

  • Introduction & Background
  • The Roadmap to New Telco 2.0 Business Models
  • Updating the Telecoms Business Model
  • Executive Summary
  • Introducing the New Telco 2.0 Framework
  • Summary: The Six Telco 2.0 Opportunity Types
  • New Developments and Feedback from Telco 2.0 and New Digital Economics Brainstorms
  • Relative Attractiveness of Opportunity Areas
  • Different Opportunities need Different Business Models
  • The Unwelcome Need to Increase Investment in Innovation
  • New Metrics to Unlock New Investment
  • A Common Theme: Time is Short
  • Next Steps – M-Commerce 2.0: how Personal Data will Revolutionise Customer Engagement
  • The Six Opportunity Types Described
  • Opportunity Type 1: Core services
  • Opportunity Type 2: Vertical industry solutions (SI)
  • Opportunity Type 3: Infrastructure services
  • Opportunity Type 4: Embedded communications
  • Opportunity Type 5: Third-party business enablers
  • Opportunity Type 6: Own-brand “OTT”
  • Index

…with the following figures, charts and tables…

  • Figure 1 – The high-level Telco 2.0 Business Model diagram
  • Figure 2 – Telcos squeezed from all sides
  • Figure 3 – The three opportunity areas in the original Telco 2.0 business model
  • Figure 4 – The New Telco 2.0 Industry Framework
  • Figure 5 – the Six Telco 2.0 Opportunity Types
  • Figure 6 – The Six Opportunity Areas – Strategy, Typical Services and Examples
  • Figure 7 – Americas 2011: What will be the impact of Telco 2.0 Growth Opportunities?
  • Figure 8 – EMEA Nov 2010: B2B Enabling Services and Distribution Platform Need Investment
  • Figure 9 – Each Opportunity Area will have Different Revenue Splits
  • Figure 10 – Operators must invest more in services
  • Figure 11 – Different Business Models Need Different Metrics
  • Figure 12 – Impact of New Business Models on CROIC
  • Figure 13 – Other than “being a pipe”, Telcos have the most time and Opportunity to address Identity & Authentication Control Points
  • Figure 14 – Customer Data and Mobile Money are CSP’s most under exploited Assets?
  • Figure 15 – 100% campaign gain from personalisation
  • Figure 16 – Closed-loop of customer relationships & loyalty
  • Figure 17 – Ericsson’s Mobile Broadband ‘Fuel Gauge’
  • Figure 18 – BT Global Services vertical industry approach
  • Figure 19 – Many regulators see wholesale as key to NGA success
  • Figure 20 – Three Different Types of Embedded Communications
  • Figure 21 – Broadband access market forecast 2005-2015
  • Figure 22 – ‘Comes with Connectivity’
  • Figure 23 – Distribution and Enablers Vs Ontology of Telco wholesale and VAS offerings
  • Figure 24 – What is the best revenue model for Telco API programmes?
  • Figure 25 – Skype is a good fit for many Microsoft products
  • Figure 26 – Telco strategy options for co-opetition with Skype
  • Figure 27 – The Seven ‘VAS Platform’ Applications / 3rd Party Business Enabler Areas
  • Figure 28 – 5 Strategic Options for Developing OTT Services

……Members of the Telco 2.0 Executive Briefing Subscription Service and the Telco 2.0 Transformation Stream can download the full 50 page report in PDF format here. Non-Members, please see here for how to subscribe, here to buy a single user license for £795 (+VAT), or for multi-user licenses and any other enquiries please email contact@telco2.net or call +44 (0) 207 247 5003.

Organisations and products referenced: 3UK, Alcatel-Lucent, Amazon, Amazon Kindle, Android, Apple, AT&T, BlackBerry, BT, BT Global Services, Carphone Warehouse, Cisco, Clearwire, Deutsche Telekom, Equant, Facebook, FCC, Gamesload, Google, Harbinger/SkyTerra network, iPad, iPhone, Jajah, KDDI, LightSquared, LinkedIn, Microsoft, Musicload, O2, Ofcom, Openzone, Optism, Orange, ProgrammableWeb, Qualcomm, Revoo, Scout24 family, Skype, smartphones, SMS, Softwareload, Telefonica, T-Mobile, UQ, Verizon, Videoparty, Vodafone, W3C, Xiam, YouTube.

Technologies and industry terms referenced: 3G, 4G, ADSL, API, appstore, authentication, B2B VAS platform, backhaul, billing-on-behalf, bitstream ADSL, broadband data access, Bulk wholesale, cable, cloud, Comes with data, Core services, CRM, data centres, Embedded Communications, femtocells, fibre, freemium, GSM, healthcare, Identity, Infrastructure services, location, LTE, M2M, managed services, messaging, MiFi, MVNO, MVNOs, Net Neutrality, NGA, NGN, own-brand OTT, Own-brand OTT, pipe, platforms, QoS, R&D, Retail, Sender pays, SIM, slice and dice, smart grids, Third-party business enablers, two-sided, unbundled local loop, Vertical industry solutions, voice telephony, VoIP, wholesale wireless networks, WiFi, WiMAX.

Full Article: Online Video Usage – YouTube thrashes iPlayer, but for how long?

Online Video consumption is booming. The good news is that clearer demand patterns are beginning to emerge which should help in capacity planning and improving the user experience; the bad news is that an overall economic model which works for all players in the value chain is about as clear as mud.

We previously analysed the leffect of the launch of the BBC iPlayer on the ISP business model, but the truth is that, even in the UK, YouTube traffic still far outweighs the BBC iPlayer in the all important peak hour slot – even though the bitrate is far lower.

Looking at current usage data at a UK ISP we can see that the number of concurrent people using YouTube is roughly seven times that of the iPlayer. However, our analysis suggests that this situation is set to change quite dramatically as traditional broadcasters increase their presence online, with significant impact for all players. Here’s why:

Streaming Traffic Patterns

Our friends at Plusnet, a small UK ISP, have provided Telco 2.0 with their latest data on traffic patterns. The important measurement for ISPs is peak hour load as this determines variable-cost capacity requirements.

iplayer_7_days.PNG

iPlayer accounts for around 7% of total bandwidth at peak hour. The peaks are quite variable and follows the hit shows: the availability of Dr Who episodes or the latest in a long string of British losers at Wimbledon increase traffics.

Included within the iPlayer 7% is the Flash-based streaming traffic. The Kontiki-P2P based free-rental-download iPlayer traffic is included within general streaming volumes. This accounts for 5% of total peak-hour traffic and includes such applications as Real Audio, iChat, Google Video, Joost, Squeezebox, Slingbox, Google Earth, Multicast, DAAP, Kontiki (4OD, SkyPlayer, iPlayer downloads), Quicktime, MS Streaming, Shoutcast, Coral Video, H.323 and IGMP.

The BBC are planning to introduce a “bookmarking��? feature to the iPlayer which will allow pre-ordering of content and hopefully time-of-day based delivery options. This is a win-win-win enhancement and we can’t see any serious objections to the implementation: for the consumers it is great because they can view higher-quality video and allow the download when traffic is not counted towards their allowance; for ISPs it is great because it encourages non-peak hour downloads; and for the BBC it is great as it will potentially reduce their CDN costs.

youtube_7_days.PNG

YouTube traffic accounts for 17% of peak-hour usage – this is despite YouTube streaming at around 200kbps compared to the iPlayer 500kbps. There are about seven times the amount of concurrent users using YouTube compared to the iPlayer at peak hour. Concurrent is important here: YouTubers watch short-length clips whereas iPlayers watch longer shows of broadcast length.

P2P is declining in importance

The real interesting part of the PlusNet data is that peak-hour streaming at around 30% far outweighs p2p and usenet traffic at around 10%. Admittedly the peakhour p2p/usenet traffic at Plusnet is probably far lower than at other ISPs, but it goes to show how ISPs can control their destiny and manage consumption through the use of open and transparent traffic shaping policies. Overall, p2p consumption is 26% of Plusnet traffic across a 24-hour window – the policies are obviously working and people are p2p and usenet downloading when the network is not busy.

Quality and therefore bandwidth bound to increase

Both YouTube and the iPlayer are relatively low-bandwidth solutions compared to broadcast quality shows either in SD (standard definition) or HD (high-definition), however applications are emerging which are real headache material for the ISPs.

The most interesting emerging application is the Move Networks media player. This player is already in use by Fox, ABC, ESPN, Discovery and Televisa — amongst others. In the UK, it is currently only used by ChannelBee, which is a new online channel launched by Tim Lovejoy of Soccer AM fame.

The interesting part of the Move Networks technology is dynamic adjustment of the bit-rate according to the quality of the connection. Also, it does not seem to suffer from the buffering “feature��? that unfortunately seems to be part of the YouTube experience. Move Networks achieve this by installing a client in the form of a browser plug-in which switches the video stream according to the connection much in the same way as the TCP protocol works. We have regularly streamed content at 1.5Mbps which is good enough to view on a big widescreen TV and is indistinguishable to the naked eye from broadcast TV.

Unlike Akamai there is no secret sauce in the Move Networks technology and we expect other Media Players to start to use similar features — after all every content owner wants the best possible experience for viewers.

Clearing the rights

The amount of iPlayer content is also increasing: Wimbledon coverage was available for the first time and upcoming is the Beijing Olympics and the British Golf Open. We also expect that the BBC will eventually get permission to make available content outside of the iPlayer 7-day window. The clearing of rights for the BBC’s vast archive will take many years, but slowly but surely more and more content will be available. This is true for all major broadcasters in the UK and the rest of the world.

YouTube to shrink in importance

It will be extremely interesting to see how YouTube responds to the challenge of the traditional broadcasters — personally we can’t see a future where YouTube market share is anywhere near its current level. We believe watching User Generated Content, free of copyright, will always be a niche market.

Online Video Distribution and the associated economics is a key area of study for the Telco 2.0 team.