US Wireless Market: Early Warning Signs of Change
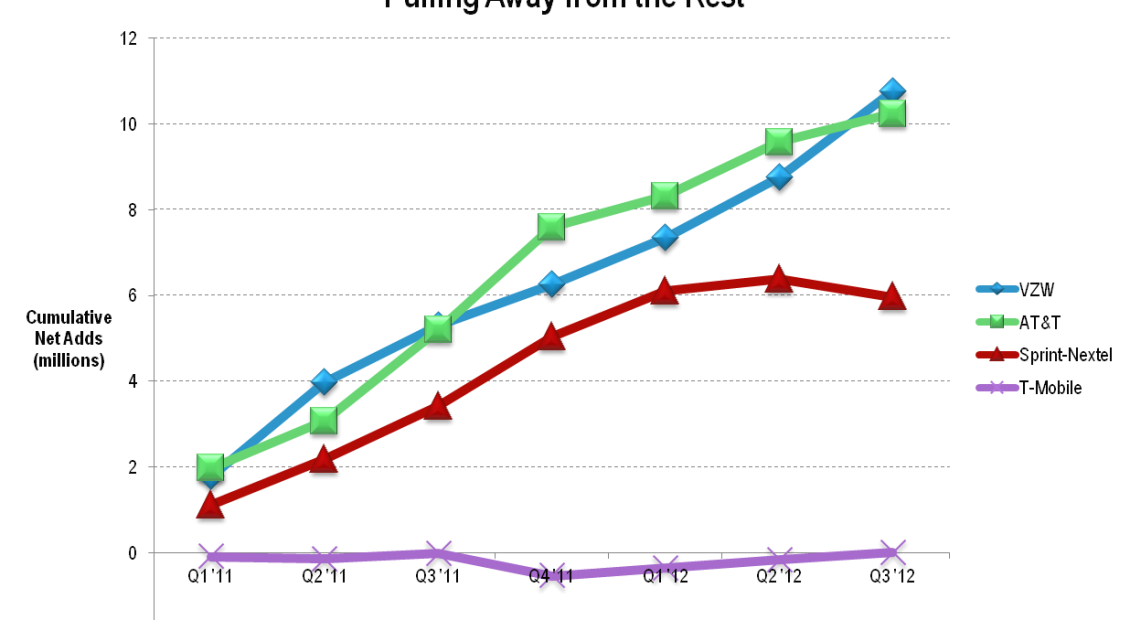
Introduction

The US national wireless market is currently the most influential of its kind on the planet. Not only is it big, it is also rich, with significantly higher ARPUs than other developed markets. Not only is it big and rich, it is advanced, with much higher 4G penetration than comparable markets. Further, it has frequently acted as a bellwether for the world wireless industry. The iPhone’s success in the US marked the smartphone’s transition from pioneer to early-adopter status worldwide; the much greater success of the iPhone 3GS and the Moto Droid marked the beginning of mass adoption, and the crisis of the mid-market vendors.

On the network side, Verizon Wireless’s early decision to abandon the CDMA2000 development path and choose LTE FDD signalled the end of the standards wars and the beginning of serious 4G deployment, threw Motorola even deeper into crisis, and positioned Alcatel-Lucent as the leading vendor in the first wave of LTE rollouts.

The inclusion of the 1800MHz band in the iPhone 5, meanwhile, transformed the world’s spectrum picture, redefining this legacy GSM/PCS allocation as a key asset for smartphone-focused operators. Today, the combination of US wireless operators and US semiconductor vendors is transforming industry technology strategies again, as Verizon Wireless, AT&T, and Qualcomm lead the charge for a mobile broadband-focused “early” 5G.

Clearly, the US market is as critical for global mobile as the European market was in the pre-iPhone era. As a result, Telco 2.0 finds it useful to monitor it closely. We covered the changing 5G ecosystem in MWC: 5G and Wireless Networks  and How 5G is Disrupting Cloud and Network Strategy Today. We covered AT&T’s key role in driving NFV and open-source telco software forwards in Fast Pivot to the NFV Future, and the fate of worldwide 4G deployments in 4G Rollout Analysis: Winning Strategies and 5G Implications. This picked out one US carrier in particular for closer attention. In the adjacent industries, we covered Microsoft in Pivoting to a Communications-Focused Business, Amazon.com in Amazon Web Services: Colossal, but Invincible?, the cable operators in Gigabit Cable Attacks This Year, and the top-brand tech sector generally in Amazon, Apple, Facebook, Google, Netflix: Whose digital content is king?.

In this note, we will review developments in the US national wireless sector, both on a long-term basis since the launch of 4G, and on a tactical basis over the last 12 months, including analysis of the results from our new, unique Mobile Network Experience Index product .

The US Wireless Market, 2011-2016

The last five years in the US cellular market have been characterised by two forces – disruption, and growth. The arrival of smartphones comprehensively disrupted what had been a rather stagnant sector. Later, T-Mobile USA initiated a price disruption which resulted in a wave of consolidation and a significant drop in industrywide ARPU. However, despite the “uncarrier”’s price cuts, the total industry profit pool has nonetheless grown dramatically in that timeframe, from $8.7bn/quarter to $14bn/quarter, as the revenue base has grown by some 20%, or 4% per annum.

Figure 1: The US wireless revenue base, 2011-2016

Source: STL Partners, company filings, themobileworld

Growth was as characteristic of the US market over the last 5 years as price disruption. T-Mobile’s strategy was to a large extent possible because there was a significant degree of “blue-ocean” competition, enlarging the subscriber base and deepening its use of smartphones and high-speed data service, as well as consolidation of minor operators. We show the net impact on operating profits in Figure 2.

Figure 2: Long term shifts in the US national wireless profit pool, 2011-2016

Source: STL Partners, themobileworld.com, company filings

Over the whole timeframe, the total annual pool of operating profit available in the market has grown by 59% or 11.8% per annum, or five times as fast as US GDP. This came in the context of a 20%, or 4% annualised, increase in total wireless revenues. At the same time, three operators have benefited disproportionately from this growth – AT&T, Verizon Wireless, and T-Mobile. In fact, AT&T’s gains have been quite modest compared to the triumphs at VZW and T-Mobile.

On the other hand, Sprint has seen its operating profits halve and halve again, while Leap, MetroPCS, and numerous minor operators have exited the market. Looking at these data in a time-series view, as we do in Figure 3, we see that the duopoly is still a real force, although Verizon, has done distinctly better than AT&T.

Verizon Wireless, which pursued a “premium carrier” strategy based on going first with 4G, using its 700MHz holdings to maximise coverage and densifying with 1800MHz, and holding the line on price as long as possible, has clearly maximised its operating-level profitability. Meanwhile, a vicious struggle for third place was waged between T-Mobile and Sprint. Both parties struggled at times with the cost of spectrum acquisitions and network investments, and the gap between them and the duopoly is unmistakable. However, T-Mobile has managed to keep in the black since 2013 and its profitability is gradually improving, breaking away from the also-rans over the last 12 months.


  • Executive Summary
  • Introduction
  • The US Wireless Market, 2011-2016
  • Where Do We Go From Here?
  • Duopolists, challengers, and exits
  • Valuations
  • Challenging the Premium Carrier
  • The Impact of IPv6 deployment
  • Conclusions
  • Disruptive Responses: 5G
  • Disruptive Responses: Content


  • Figure 1: The US wireless revenue base, 2011-2016
  • Figure 2: Long term shifts in the US national wireless profit pool, 2011-2016
  • Figure 3: Profits at US wireless carriers, 2011-2016 (time series)
  • Figure 4: The short-run profits pool
  • Figure 5: Five years of Verizon Vs T-Mobile
  • Figure 6: Long term share of connections growth, 2011-2016
  • Figure 7: Short term share of connections growth, 2015
  • Figure 8: Long term retail postpaid users, 2011-2016
  • Figure 9: Short term retail postpaid subscribers, 2015
  • Figure 10: Now, T-Mobile is gaining the right kind of subscribers
  • Figure 11: Retail postpaid connections over time
  • Figure 12: Prepaid subscribers over time
  • Figure 13: Long term change in prepaid users is mostly growth, and MetroPCS’s exit
  • Figure 14: Short term change in retail prepaid users, 2015
  • Figure 15: T-Mobile’s debts are far from zooming out of control
  • Figure 16: Duopolists, challengers, and exit candidates
  • Figure 17: Net income margins over time
  • Figure 18: Device sales surge, margins dive
  • Figure 19: Valuation – EV/EBITDA
  • Figure 20: T-Mobile leads on our MobiNEX score
  • Figure 21: A link between network metrics and customer satisfaction?
  • Figure 22: 3 out of 4 US MNOs are “challenged” in the world context
  • Figure 23: Download speed vs. percentage of LTE requests
  • Figure 24: T-Mobile is the lowest-latency US operator
  • Figure 25: T-Mobile is generating 25% fewer high latency events than AT&T
  • Figure 26: T-Mobile’s error rate catches up on the market leader
  • Figure 27: Quality across the board
  • Figure 28: IPv6 adoption, US wireless operators

Sprint-Softbank: how it will disrupt the US market

Summary:

The Japanese and French markets have both been disrupted through the entry of low-cost competitors offering substantial price reductions. We think that Softbank’s acquisition of Sprint is a signal that the same is to soon come in the US given Softbank’s experience as a successful disruptor in Japan. (January 2013, Executive Briefing Service)

Digital Commerce Flywheel December 2012
  Read in Full (Members only)  To Subscribe click here

Below is an extract from this 23 page Telco 2.0 Report that can be downloaded in full in PDF format by members of the Telco 2.0 Executive Briefing service here. Non-members can subscribe here or other enquiries, please email contact@telco2.net / call +44 (0) 207 247 5003.

We’ll also be discussing our findings at the New Digital Economics Brainstorm in Silicon Valley, 19-20 March, 2013.

Overview

Once upon a time…

Japan used to be a mobile market with two serious competitors, high ARPUs and margins, and three laggard players that nobody took too seriously. France’s mobile market had three operators, a highly tolerant regulator, and high margins. And the US mobile market once had a relatively laissez-faire regulator, high ARPUs, two mighty duopolists, and two laggards.

The Japanese and French markets have both been disrupted through the entry of low-cost competitors offering substantial price reductions, and in Japan’s case the disruptor was Softbank. The US now has a regulator seemingly more influenced by voices from Silicon Valley than ‘big telco’ lobbyists, the duopolists have attractive margins, and Softbank now stands behind Sprint. The scene appears set for a disruptive play.

The lessons of history

In Japan, back in 2006, when Vodafone sold its Japanese operation to Masayoshi Son’s Softbank, the mobile market was relatively stable with two large players – NTT Docomo and KDDI – and three much smaller ones including Softbank which were not making money (hence Vodafone’s decision to withdraw from Japan). Softbank spotted the disruptive possibilities of the Apple iPhone, the advantages of being Japan’s only operator on the UMTS world standard, and the fat margins of the duopolists. It became the iPhone exclusive carrier, benefited from world 3G infrastructure competition, and set keen prices on data to cut into the duopoly.  And the results have been spectacular: Operating income has increased 6 times since Softbank acquired the business from Vodafone, and net additions in 2012 were running 127% higher than those of NTT DoCoMo and 51% higher than KDDI.

In France back in 2011, three French operators shared out the market, under the eyes of ARCEP, a regulator much more enthusiastic about planning for infrastructure development than driving competition. That year, Free.fr, a company that had already disrupted the fixed ISP market through mastering software and therefore having the best customer premises devices and the lowest costs, finally got a 3G licence. Using a radical new network design based on small cells and WLAN-cellular integration, Free tore into the oligopolists at staggeringly low prices.

In the United States, between 2005 and 2009, the friendly regulator – FCC Chairman Kevin J. Martin – permitted three great mergers in wireless, creating the new AT&T, the new Verizon, and the new Sprint-Nextel. Out of those, execution was successful in the first two. Sprint-Nextel misjudged the importance of Nextel’s specialism in voice, made a bad bet on WiMAX, leaving itself excluded from the emerging smartphone arena, and anyway had the hardest integration challenge. This is now acknowledged by Daniel R. Hesse, Sprint-Nextel’s CEO.

“Hesse said that the AT&T’s failed attempt to consolidate two of the Big 4 made him realize that there was no longer such a thing as the Big 4. The industry had bifurcated into the Big 2 and everybody else.” … “With 20/20 hindsight, the Nextel merger was a mistake,” Hesse said. “The synergies, if you will, that we had hoped for and planned for didn’t materialize.” 

Source: GigaOm

AT&T and Verizon, however, made it across the merger swamp to found an effective duopoly, a dominating force that controls 68% of revenue in the world’s critical wireless market, and which regularly achieves 30+% margins while its rivals struggle to break even. Verizon’s decision to end the standards wars and go with LTE effectively killed the CDMA development path and left Sprint stuck with WiMAX. Was it strategy or happy accident?

So, what’s next?

Now, things have changed. Sprint has been bought out by none other than Softbank – the original Japanese disruptor. It is a reminder that strategic advantage is temporary and disruption is inevitable.

We expect that the new Sprint will take the pain to push ahead with its transition to LTE. The previous Softbank and Sprint experiences have shown that being outside the world standard is deadly from a devices point of view, which remains critical to success in mobile. We expect that they may make a much bigger effort with carrier WLAN, far better standardised, far more available, and in many ways technically more robust than WiMAX.

We also expect that Sprint/Softbank will aim for the simplest form of disruption, price war. Oligopolies are always either in a state of price stability or of price war. Whether a cartel controls the market, or a tacit balance of fear constrains action, stability reigns, until it doesn’t. Then, price war rages, as no-one can afford to resist. Customers will benefit. T-Mobile, trying to fight its way to the start-line, will suffer most of all.

Another lesson from Softbank, though, is that disruption on price needs a killer product if it is to be more than a race to the bottom. We explore some further strategy options for Sprint in the body of this report.

In addition to its impact on the core US telecoms market, the prospect of forthcoming disruption also raises the stakes on the question of whether the US telcos are transforming to new Telco 2.0 business models fast enough (see our report A Practical Guide to Implementing Telco 2.0). This is a topic that we will explore further in our research and at the next Silicon Valley Executive Brainstorm, March 19-20, 2013.

Orientation: The Softbank Experience

Masayoshi Son’s strategy at Softbank, after acquiring the Vodafone stake, was simple – sharp pricing, especially on data, and hot gadgets.

The iPhone: a disruptive innovation

Softbank was the launch partner for the iPhone in Japan and remained Apple’s exclusive carrier up to the release of the iPhone 4S. Softbank’s annual report shows the impact of the iPhone and repricing very clearly – the partnership with Apple was signed in June, 2008, and the iPhone 4S launch followed in Q3 2011. The disruption was transient, but it had lasting effects on the market, restoring Softbank as a serious competitor, in much the same way as it turbocharged AT&T in the US a year before.

Figure 1: iDisrupt – the June ‘08 iPhone launch reset the market in Japan

Softbank Results, January 2013Source: Softbank

The combination of keen pricing and iPhones had a lasting effect on subscriber growth, too. Throughout the exclusivity era, Softbank beat its rivals for net-adds handsomely.

The impact on price: enduring reduction in margins

However, this came at a price. On a quarterly basis, a steady erosion of operating margin is visible, driven partly by the pricing strategy and partly by the cost of the shiny, shiny gadgets. One way of mitigating this was to carve out the cost of the device from the cost of service. Rather than paying nothing up front, Softbank subscribers paid a monthly device charge, or else either paid cash or brought their own.

Softbank’s annual report says that their subscriber-acquisition cost was falling in their FY 2012 (i.e. 2011-12), but also that the average subscriber upgrade cost had increased – in a smartphone environment, users who were brought on board on a cheaper device will tend to eventually demand something better.

As a result, Softbank has been able to keep its share of net adds over 40%. In a market with four players, this is a major achievement. However, to do so, they have had to accept the erosion of their margins and pricing.

Figure 3: Softbank – keeping ahead of the competition…

Softbank Net Adds and Margins, January 2013Source: STL Partners, Softbank

Clearly, price disruption can work, and it is reasonable to think that something similar might happen in the US, a similar market. In the international context, US mobile operators are pricey: the US is the fourth-highest OECD market by ARPU.

On average, for instance, a triple-play package that bundles Internet, telephone and television sells for $160 a month with taxes. In France the equivalent costs just $38. For that low price the French also get long distance to 70 foreign countries, not merely one; worldwide television, not just domestic; and an Internet that’s 20 times faster uploading data and 10 times faster downloading it.

To read the note in full, including the following additional analysis…

  • Executive Summary
  • Orientation: The Softbank Experience
  • The iPhone: a disruptive innovation
  • The impact on price: enduring reduction in margins
  • The Disruption of EU High Price Markets
  • Target: The Duopoly
  • Context: Sources of the Duo
  • M&A Execution
  • AT&T: A Devil’s Bargain with Apple
  • Verizon – network leadership as a strategy
  • Sprint – post-merger distractions
  • The Future: Limits to the Duo
  • PSTN phaseout and Universal Service Fund transition
  • Very simply…a price war
  • Sprint: The Agenda
  • Recovering from the loss of the Nextel business
  • Future of the network
  • Future of the core
  • The spectrum issue
  • Sprint: the soft-shoe spectrum shuffle
  • Softbank: another 2.5GHz vision
  • Options for disruptive change
  • Happy Pipe
  • Telco 2.0
  • Comms-Focused
  • Conclusions


…and the following figures…

  • Figure 1: iDisrupt – the June ‘08 iPhone launch reset the market in Japan
  • Figure 2: Softbank accepted a drift-down in margins as the price of subscriber acquisition
  • Figure 3: Softbank – keeping ahead of the competition
  • Figure 4: Spain is a high-price market
  • Figure 5: Markets with premium pricing are the first to go
  • Figure 6: AT&T and Verizon Wireless dominate US mobile revenues and margins
  • Figure 7: The duopolists pull away in terms of subscribers
  • Figure 8: The duopolists’ subscriber gain has come without sacrificing ARPU
  • Figure 9: The duopolists dig in through capital investment
  • Figure 10: OneNet sent Vodafone UK powering ahead in the SMB market
  • Figure 11: Softbank Japan’s spectrum plan
  • Figure 12: Softbank and the US Carriers’ Spectrum Holdings
  • Figure 13: Softbank is more than confident on EBIT
  • Figure 14: Softbank ARPU – An “increasing trend” for one player, but only just


Members of the Telco 2.0 Executive Briefing Subscription Service can download the full 23 page report in PDF format hereNon-Members, please subscribe here or email contact@telco2.net / call +44 (0) 207 247 5003.

Strategy 2.0: What Skype + Microsoft means for telcos

Summary: in theory, Microsoft and Skype have the resources, the brands, the customer base and the know-how to shape the future of telecoms and become a strategic counterweight to Apple and Google. Can they do it – and what should telcos’ strategy be? (June 2011, Executive Briefing Service, Dealing with Disruption Stream).

Microsoft Skype Logo Image Medium


This page contains an excerpt from the report, plus detailed contents, figures and tables, and a summary of the companies, products, technologies and issues covered.


Read in Full (Members only)    Buy This Report    To Subscribe

(The 35 page PDF format report is available in full to Members of the Telco 2.0 Executive Briefing Service and the Telco 2.0 Dealing with Disruption Stream here. Non-members can buy a Single User license for this report online here for £995 (+VAT) or subscribe here. For multiple user licenses or other enquiries please email contact@telco2.net or call +44 (0) 207 247 5003.)

To share this article easily, please click:

//

Introduction: Skype, the Original ‘Voice 2.0’

Everyone knows Skype as the original Voice 2.0 company – providing free phone calls, free video, status updates, all delivered using an innovative peer-to-peer architecture, and with the unique selling point of VoIP that just worked. This report describes its business model, technology strategy, its acquisition by Microsoft, and the consequences for the telecoms industry.

A little history

Founded in 2003 by Janus Friis and Niklas Zennström, Skype was acquired by eBay in 2005 for $2.6bn. eBay ownership was a period of stagnation – although eBay also owns PayPal, it only made half-hearted efforts to integrate the two. In November 2009, eBay sold 65% of Skype to an investor group led by Silver Lake for approximately $1.9bn in cash, valuing Skype at $2.75bn.

With Skype preparing for an IPO, Microsoft announced in May 2011 that it had agreed to buy the company for $8.5bn, giving the investor group a massive return and ensuring future potentially-disruptive start-ups will also attract plenty of funding. Many commentators have suggested that Microsoft is paying too much for the VOIP company, although the price-earnings ratio is actually no higher than that of Cisco’s acquisition of WebEx. So, what exactly is Microsoft getting for its billions? Let’s take a closer look.

A Dive into Skype’s Accounts

Microsoft has acquired what is essentially a global telephony company with 663 million registered users and very significant gross profitability. Skype contributed more net new minutes of international voice than the rest of the industry put together in 2010, according to Telegeography. Skype has never struggled to achieve growth, but its profitability has often been criticised, as has its ability to generate growth in ARPU. The following chart (figure 1) summarises Skype’s operational key performance indicators (KPIs) since 2006.

Figure 1: Skype’s KPIs: users, usage, and ARPU

Telco 2.0 Skype KPIs Users and ARPU June 2011 Graph Chart v1

Source: Skype’s S-1, May 2011

Questions have been raised about Skype’s performance in converting registered or even active users into paying users. This is critical, as ARPU is relatively flat. However, a monthly ARPU for paying users of $8 would be considered very reasonable for an emerging-market GSM operator and such an operator would tie up far more capital than Skype does. As all Skype users contribute to the system’s peer-to-peer (P2P) infrastructure, the marginal cost of serving non-paying users is essentially nothing.

Another way of looking at the KPIs is to consider their growth rates, as we have done in the following chart (figure 2). Although the growth of paying users is nowhere near as fast as that of free minutes of use, 40% growth per annum in revenue-generating subscribers is still very impressive.

Figure 2: Growth rates of Skype KPIs.

Telco 2.0 Skype KPIs Growth June 2011 Graph Chart

Source: Skype’s S-1, May 2011

In fact, there is very little wrong with Skype at the operating level. The following chart (figure 3) shows that, if we consider the primary challenge for Skype to be converting free users into paying users, it is actually doing rather well. Revenue and EBITDA are advancing and margins are holding up well.

Figure 3: Revenue and EBITDA growth is strong

Telco 2.0 Skype KPIs 5 Years Revenue and EBITDA June 2011 Graph Chart

Source: Skype S-1, May 2011

With 509 million active users available for conversion, ARPU may not be that relevant – just converting users of the free service into paying users has so far provided strong growth in gross profits and could do for the foreseeable future.

Figure 4: Conversion of free users at steady ARPU drives gross profit.

Telco 2.0 Skype Gross Profits June 2011 Graph Chart

Source: Skype S-1, May 2011

Skype doesn’t make money on free calls (not even from advertising or customer analytics/insights, yet), and has to pay interconnection fees and operate some infrastructure in order to provide SkypeOut (calls to conventional telephone numbers, rather than other Skype clients), and SkypeIn (calls from the PSTN to Skype users).

Skype sceptics have argued that eventually termination charges will catch up with the company and destroy its profitability. It is true that most of Skype’s revenues are generated (over 80%) by SkypeOut call charges and that Skype’s cost of net revenue is dominated (over 60%) by the cost of terminating these calls. However, termination as a percentage of Skype’s cost of net revenue is falling and Skype’s gross margin is rising, as its enormous volume growth enables it to extract better bulk pricing from interconnect operators (see Figure 5).

To see Figure 5, the conclusion of our analysis of Skype’s finances, and…

  • Is Skype Accumulating “Technical Debt”?
  • Future Plans: The Core Business, The Enterprise & Facebook
  • Telcos and Skype
  • Enter Microsoft
  • Windows Phone 7: Relevant again?
  • Microsoft’s other mobile allies: Nokia, RIM
  • How Microsoft will deploy Skype
  • Developers, developers, developers
  • Key Risks and Questions: execution, regulatory, partners, advertisers & payments
  • Answers: How Telcos should deal with Skype…and Microsoft

…plus these additional figures & fables…

  • Figure 5: How Skype’s spending is changing
  • Figure 6: Why Skype is making a loss
  • Figure 7: Commoditisation is for everybody!
  • Figure 8: 3UK benefits from its deal with Skype
  • Figure 9: Skype’s Deals with Carriers
  • Figure 10: Skype is a good fit for many Microsoft products
  • Figure 11: A unifying Skype API is critical for integration into the Microsoft empire
  • Figure 12: Telco strategy options matrix


Members of the Telco 2.0 Executive Briefing Subscription Service and the Telco 2.0 Dealing with Disruption Stream can download the full 35 page report in PDF format here. Non-Members, please see here for how to subscribe, here to buy a single user license for for £995, or for multi-user licenses and any other enquiries please email contact@telco2.net or call +44 (0) 207 247 5003.

Organisations, products and people referenced in the report: 3UK, AdSense, Android, Apple, AT&T, Au, Avaya, Ben Horowitz, BlackBerry Messenger, Cisco, Dynamics CRM, EasyBits, eBay, Exchange Server, Facebook, Facetime, Google, Google Talk, Google Voice, GSMA, Happy Pipe, Hutchison, iOS, iPhone, Jajah, Janus Friis, KDDI Mobile, Kinect, KPN, Lync, Mango, Marchex, Microsoft, Microsoft-Nokia deal, MXit, MySpace, Niklas Zennström, Nokia, Ofcom, Office Live, Outlook, PayPal, PowerPoint, Qik, RIM, Silver Lake, Skype, SkypeConnect, SkypeIn, SkypeKit, SkypeOut, SkypePhone, Steve Ballmer, Telefonica, Teredo, Tony Jacobs, Tropo, Twitter, Verizon Wireless, Virgin, Visual Studio, WebEx, WhatsApp, Windows Mobile, Windows Phone 7, WP7, Xbox, X-Series.

Technologies referenced: GSM, HD voice, HTTP/S, IM, IMS MMTel, IP networks, IPv4, IPv6, LTE, Mobile, NAT, P2P, PSTN, RCS, SILK V3, SIP, SMS, SS7, super node, URI, video telephony, Voice 2.0, VoIP, XMPP.