Telco Cloud Deployment Tracker: Deploying NFs on public cloud without losing control

In this update, we present a review of telco cloud deployments for the whole of 2022 and discuss trends that will shape the year ahead. Fewer deployments than expected were completed in 2022. The main reason for this was a delay in previously announced 5G Standalone (SA) core roll-outs, for reasons we have analysed in a previous report. However, we expect these deployments to be largely completed in 2023. 

We also review deployments of NFs on the public cloud in 2022. While few in number, they are significant in scope, and illustrate ways in which telcos of different types can deploy NFs on public cloud while retaining control over the management and ongoing development of those NFs.

Enter your details below to download an extract of the report

CNFs on the public cloud: Recent deployments illustrate how to avoid hyperscaler lock-in

Few telcos have yet deployed critical network functions on the hyperscale cloud, as discussed in this report. However, significant new deployments did go live in 2022, as did tests and pilots, involving all three hyperscalers:​

Recent deployments and trials of CNFs on public cloud

Source: STL Partners

In our recently published Telco Cloud Manifesto 2.0, we argued that telcos thinking of outsourcing telco cloud (i.e. both VNFs/CNFs and cloud infrastructure) to hyperscalers should not do so as a simple alternative to evolving their own software development skills and cloud operational processes. In order to avoid a potentially crippling dependency on their hyperscaler partners, it is essential for operators to maintain control over the development and orchestration of their critical NFs and cloud infrastructure while delivering services across a combination of the private cloud and potentially multiple public clouds. In contrast to a simple outsourcing model, the deployments on public cloud in 2022 reflect different modes of exploiting the resources and potential of the cloud while maintaining control over NF development and potential MEC use cases. The telcos involved retain control because only specific parts of the cloud stack are handed over to the hyperscale platform; and, within that, the telcos also retain control over variable elements such as orchestration, NF development, physical infrastructure or the virtualisation layer.

In this report, we discuss the models which the telcos above have followed to migrate their network workloads onto the public cloud and how this move fits their overall virtualisation strategies.

Previous telco cloud tracker releases and related research

Enter your details below to download an extract of the report

Telco 1.0: Death Slide Starts in Europe

Telefonica results confirm that global telecoms revenue decline is on the way

Very weak Q1 2014 results from Telefonica and other European players 

Telefonica’s efforts to transition to a new Telco 2.0 business model are well-regarded at STL Partners.  The company, together with SingTel, topped our recent Telco 2.0 Transformation Index which explored six major Communication Service Providers (AT&T, Verizon, Telefonica, SingTel, Vodafone and Ooredoo) in depth to determine their relative strengths and weaknesses and provide specific recommendations for them, their partners and the industry overall.

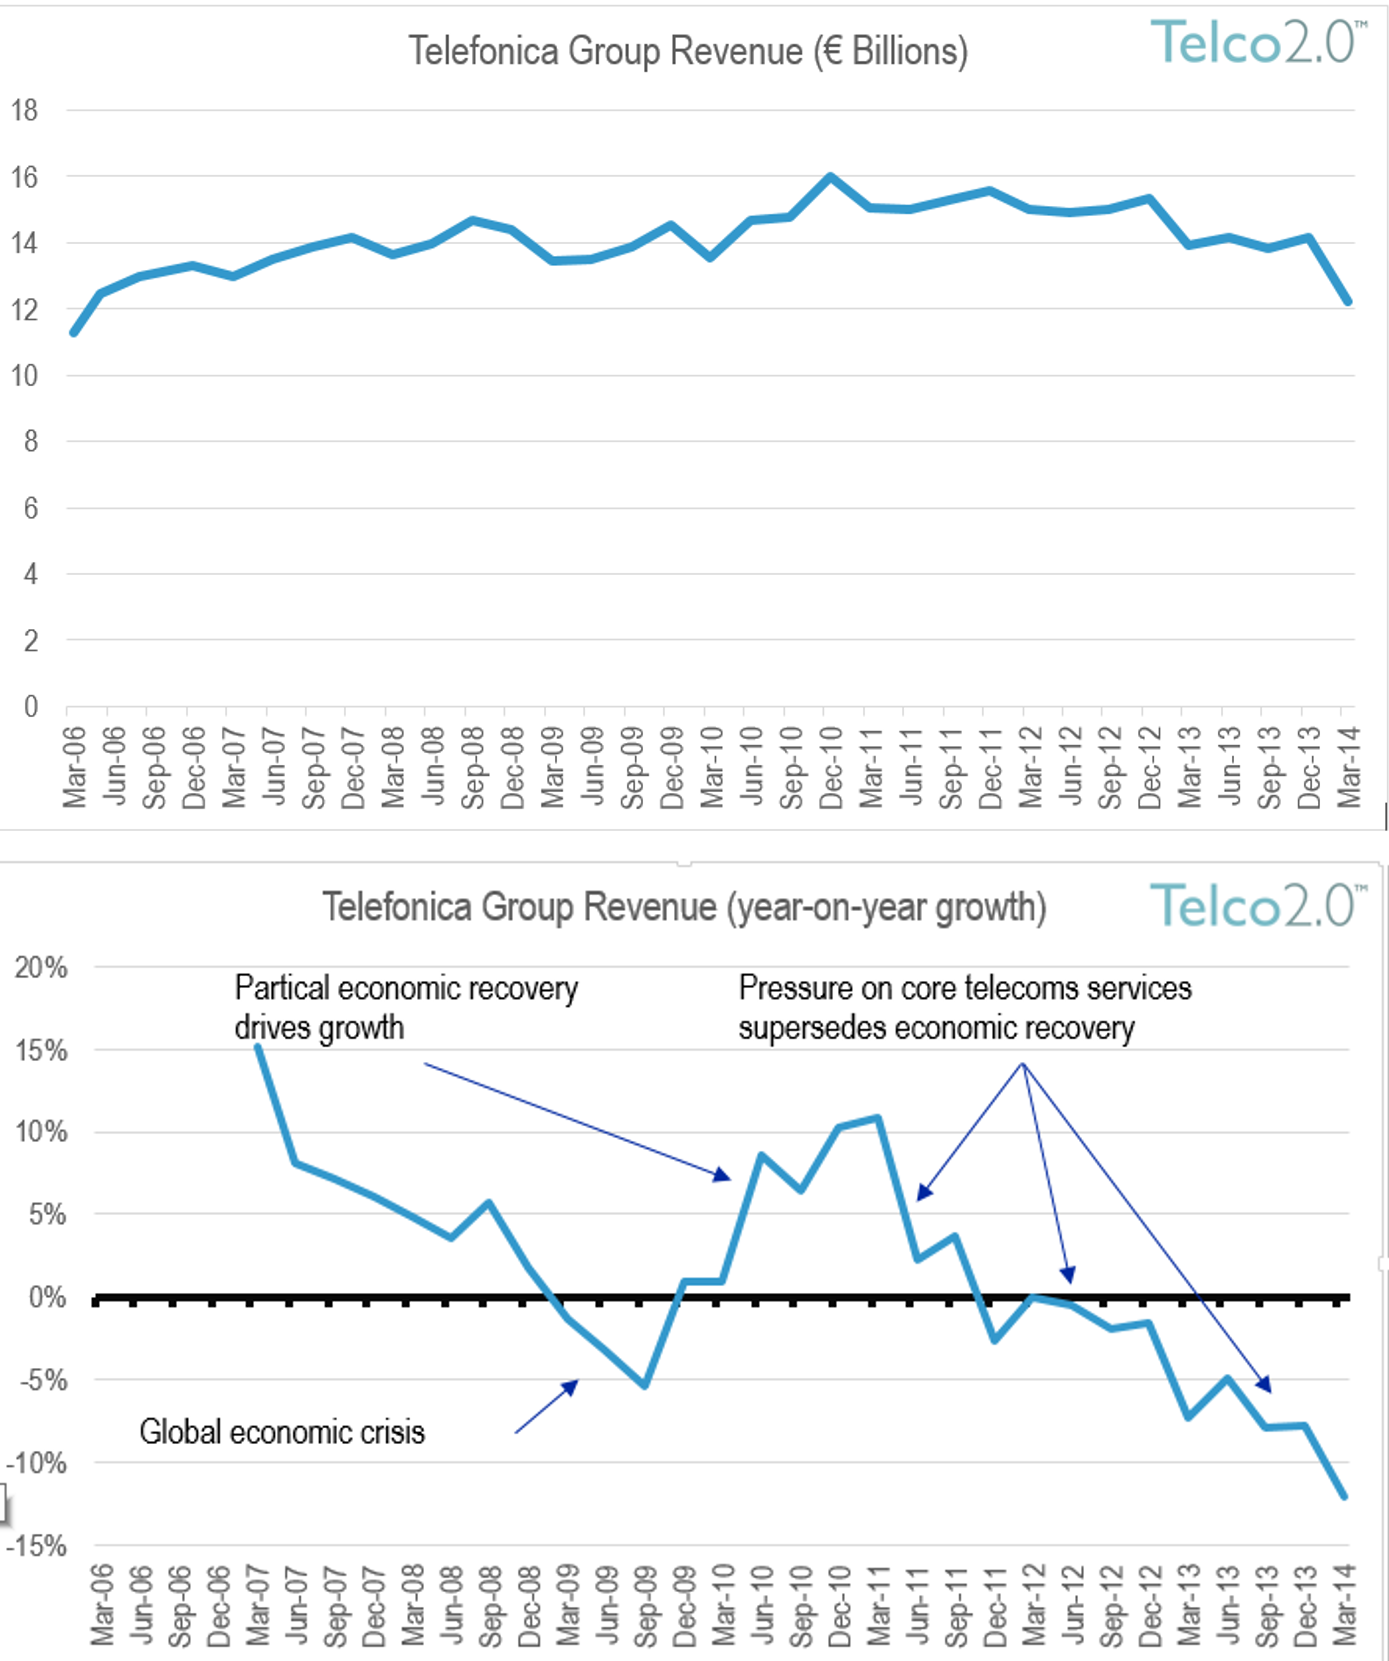
But Telefonica’s Q1 2014 results were even worse than recent ones from two other European players, Deutsche Telekom and Orange, which both posted revenue declines of 4%.  Telefonica’s Group revenue came in at €12.2 billion which was down 12% on Q1 2013.  Part of this was a result of the disposal of the Czech subsidiary and weaker currencies in Latin America, in which around 50% of revenue is generated.  Nevertheless, the negative trend for Telefonica and other European players is clear.

As the first chart in Figure 1 shows, Telefonica’s revenues have followed a gentle parabola over the last eight years.  They rose from 2006 to 2010, reaching a peak in Q4 of that year, before declining steadily to leave the company in Q1 2014 back where it started in Q1 2006.

The second chart, however, adds more insight.  It shows the year-on-year percentage growth or decline in revenue for each quarter.  It is clear that between 2006 and 2008 revenue growth was already slowing down and, following the 2008 economic crisis in which Spain (which generates around quarter of Telefonica’s revenue) was hit particularly hard, the company’s revenue declined in 2009.  The economic recovery that followed enabled Telefonica to report growth again in 2010 and 2011 before the underlying structural challenges of the telecoms industry – the decline of voice and messaging – kicked in, resulting in revenue decline since 2012.

Figure 1: Telefonica’s growth and decline over the last 8 years

Telco 2.0 Telefonica Group Revenue

Source: Telefonica, STL Partners analysis

One thing is clear: the only way is down for most CSPs and for the industry overall

The biggest concern for Telefonica and something that STL Partners believes will be replicated in other CSPs over the next few years is the accelerating nature of the decline since the peak.  It seems clear that Telco 1.0 revenues are not going to decline in a steady fashion but, once they reach a tipping point, to tumble away quickly as:

  • Substitute voice and messaging products and alternate forms of communication scale;
  • CSPs fight hard to maintain customers, revenue and share in voice, messaging and data products, via attractive bundles

The results of the European CSPs confirms STL Partners belief that the outlook for the global industry in the next few years is negative overall.  It is clear that telecoms industry maturity is at different stages globally:

  • Europe: in decline
  • US: still growing but very close to the peak
  • Africa, Middle East, Latin America: slowing growth but still 2(?) years before peak
  • Asia: mixed, some markets growing, others in decline

Given these different mixes, STL Partners reaffirms its forecast of 2012 that overall the industry will contract by up to 10% between 2013 and 2017 as core Telco 1.0 service revenue decline accelerates once more and more countries get beyond the peak.  This is illustrated for the mobile industry in Figure 2, below.

Figure 2: Near-term global telecoms decline is assured; longer-term growth is dependent on management actions now

Global mobile telcoms revenue

Source: STL Partners

Upturn in telecoms industry fortunes after 2016 dependent on current activities

If the downturn to 2016 is a virtual certainty, the shape of the recovery beyond this, which STL Partners (tentatively) forecasts, is not. The industry’s fortunes could be much better or worse than the forecast owing to the importance of transformation activities which all players (CSPs, Network Equipment Providers, IT players, etc.) need to make now.

The growth of what we have termed Human Data (personal data for consumers and business customers, including some aspects of Enterprise Mobility), Non-Human Data (connection of devices and applications – Internet of Things, Machine2Machine, Infrastructure as a Service, and some Enterprise Mobility) and Digital Services (end-user and B2B2X enabling applications and services) requires CSPs and their partners to develop new skills, assets, partnerships, customer relationships and operating and financial models – a new business model.

As IBM found in moving from being hardware manufacturer to a services player during the 1990’s, transforming the business model is hard.  IBM was very close to bankruptcy in the early 90’s before disrupting itself and re-emerging as a dominant force again in recent years.  CSPs and NEPs, in particular, are now seeking to do the same and must act decisively from 2013-2016 if they are to enjoy a rebirth rather than continued and sustained decline.

Telefonica leads Vodafone in more attractive markets

Introduction

As part of the recently launched Telco 2.0 Transformation Index, STL Partners has been analysing the transformation efforts of major telecoms operators.  We are close to completing a major analysis report on Vodafone which will complement those already completed for Telefonica, SingTel, Verizon, AT&T and Ooredoo.  Vodafone’s scores will also be added to an update of the Benchmarking Report which will be released in May.

The full analysis of each player covers 5 domains:

  1. Marketplace.   The context in which the Communications Service Provider (CSP) operates.  It consists of the economic and regulatory environment, the growth of the telecom market, the individual company’s competitive positioning and the relative strength of its relationships with customers.
  2. Service Offering.  What the CSP delivers to customers in a particular market segment. It is defined by the CSP’s corporate and services strategy.
  3. Value Network.  The way the CSP organises itself to deliver service offerings and includes both the internal structure and processes and external partnerships.
  4. Technology.  The technical architecture and functionality that a CSP uses to deliver service offerings.
  5. Finance.  The way the CSP generates a return from its investments and service offerings.  It also measures the CSP’s success in generating returns and metrics used to manage and drive performance.

In this report we explore a small part of the Marketplace analysis for Vodafone and compare its competitive positioning with another European-centric multi-national, Telefonica.

The results, we think, are surprising and instructive.  Vodafone, often held up as the strongest and most global player, actually has relatively weak competitive positions in its leading markets (it does not hold market leader positions) and is exposed to structurally competitive markets (even those that are developing).  Within this context, the company faces substantial challenges if it is to grow in the foreseeable future.

Of course, this is a small extract of a much deeper analysis on Vodafone.  In the full report, we explore Vodafone’s growth and transformation strategy in full and make specific recommendations on 3 different strategic options for management.

Overview: Vodafone operates in more competitive markets and has weaker market positions than Telefonica

STL Partners full report on Vodafone and Telefonica covers four areas of analysis within the Marketplace domain:

1. Economic environment & digital maturity:

  • The overall health of the economies in which Vodafone and Telefonica operate as reflected by GDP size and growth.
  • The digital maturity of Vodafone’s and Telefonica’s markets as reflected by consumer and enterprise adoption and usage of telecommunications and internet services.

2. Regulation:

  • The regulatory framework that Vodafone and Telefonica operate within. Includes legislation and attitudes to pricing, net neutrality, CSP technical and commercial collaboration for new Telco 2.0 solutions, etc.

3. Competition and positioning:

  • The nature of competition – how players compete, their goals, the strategies they deploy, the products they develop
  • How Vodafone and Telefonica are competing in the marketplace and their strengths and weaknesses

4. Customers and customer engagement:

  • What customers want and, more importantly, are trying to achieve (physically, intellectually, socially) and how this is reflected in their (digital) behaviour including how they use products, react to companies and brands, share information about themselves etc.
  • Specifically, the regard with which customers hold Vodafone and Telefonica

For the purposes of this report, we have extracted elements of the full analysis and present them along two dimensions: Market Attractiveness (the underlying growth, maturity and structure of Vodafone and Telefonica’s markets) and Competitive Position (Vodafone and Telefonica’s relative strength within these markets).

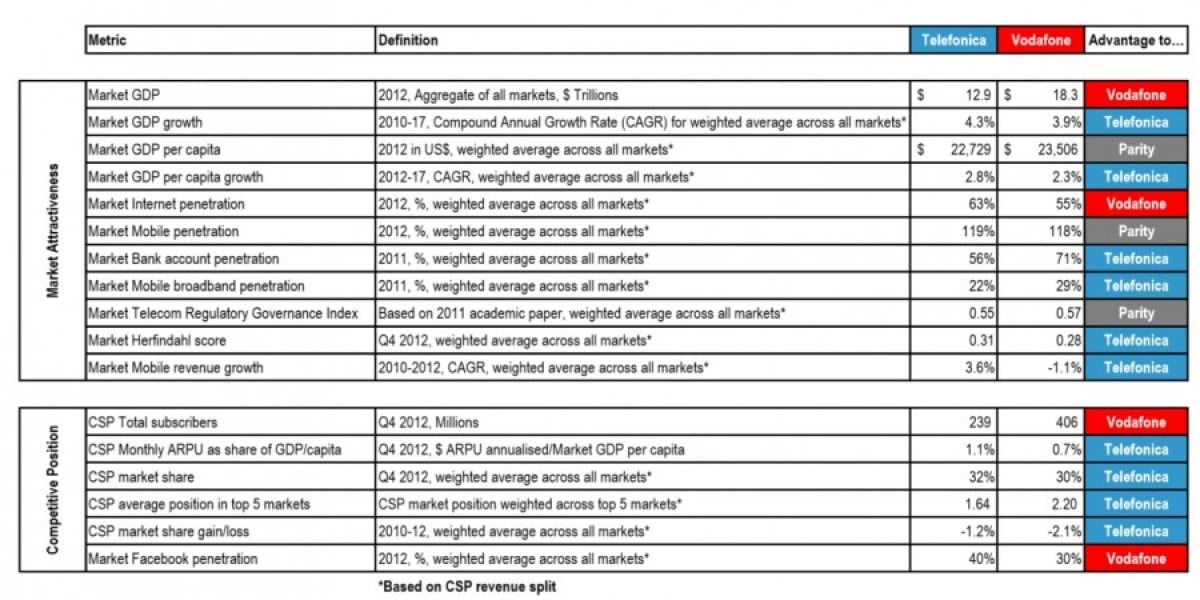
We explore a number of individual metrics within each dimension and, as we show in Figure 1 below, have collected data for each operator and then evaluated which of the two is in a stronger position.  Setting aside the three metrics where the CSPs are broadly at parity, at a summary level it appears that Telefonica appears to be in a stronger position than Vodafone:

  • Telefonica’s markets look more attractive than Vodafone’s: Telefonica outscores Vodafone by 6 metrics to 2 for Market Attractiveness including for GDP growth, GDP per capita growth, Bank account penetration, Broadband penetration, Herfindahl Score (a measure of a market’s structural attractiveness) and Mobile revenue growth.  Vodafone’s markets, by contrast, are only more attractive than Telefonica’s in terms of overall GDP size and Internet penetration.
  • Telefonica’s competitive position appears to be stronger than Vodafone’s: Telefonica outperforms Vodafone in 4 out of 6 metrics including ARPU as % of GDP per capita (ie share of wallet), market share, market position in top 5 markets, market share gain/loss.  Vodafone only outperforms Telefonica in 2 metrics: Total subscribers and Facebook penetration (with a lower penetration acting as a proxy for weaker OTT competition).

The ‘tale of the tape’ in Figure 1 is a top-line snapshot.  The rest of this report digs into a few of the metrics in more detail and seeks to explain where and how Telefonica is enjoying an advantage over Vodafone.

Figure 1: Telefonica and Vodafone Market Attractiveness and Competitive Positioning –

The Tale of the Tape

Figure 1: Telefonica and Vodafone Market Attractiveness and Competitive Positioning – The Tale of the Tape

Source: Company accounts; Market regulators, World Bank, International Monetary Fund, ITU, Internetworldstats.com, Benchmarking telecoms regulation – The Telecommunications Regulatory Governance Index (TRGI) by Leonard Wavermana, Pantelis Koutroumpis (published by Elsevier 2011) STL Partners analysis

  • Overview: Vodafone operates in more competitive markets and has weaker market positions than Telefonica
  • Telefonica is more exposed to fast-growing emerging markets
  • Vodafone has only 30% of revenue in emerging markets…
  • …compared with over 50% for Telefonica
  • Telefonica’s Latin American markets have grown much quicker than Vodafone’s Emerging ones…
  • …and Telefonica’s European markets have contracted at a similar rate to Vodafone’s Developed ones
  • Telefonica’s has a stronger competitive position than Vodafone in the most important markets
  • Overall, Telefonica has a stronger market position and is performing better in more attractive markets than Vodafone
  • Figure 1: Telefonica and Vodafone Market Attractiveness and Competitive Positioning – The Tale of the Tape
  • Figure 2:  Vodafone subscribers and revenue
  • Figure 3: Telefonica subscribers and revenue
  • Figure 4: Vodafone and Telefonica mobile market growth
  • Figure 5: Market shares in top 5 revenue-generating markets
  • Figure 6: Market Positioning Maps
  • Figure 7: Overall, Telefonica enjoys a 56% advantage over Vodafone using STL Partners’ Market Attractiveness-Competitive Situation (MACS) score
  • Figure 8: Portfolio Strategy Maps
  • Figure 9: Telefonica’s performance is broadly neutral and Vodafone’s negative using STL Partners’ EBITDA Margin-Market Share (EMMS) score

Are Telefonica, AT&T, Ooredoo, SingTel, and Verizon aiming for the right goals?

The importance of setting Telco 2.0 goals…

Communications Service Providers (CSPs) in all markets are now embracing new Telco 2.0 business models in earnest.  However, this remains a period of exploration and experimentation and a clear Telco 2.0 goal has not yet emerged for most players. At the most basic level, senior managers and strategists face a fundamental question:

What is an appropriate Telco 2.0 goal given my organisation’s current performance and market conditions?

This note introduces a framework based on analysis undertaken for the Telco 2.0 Transformation Index and offers some initial thoughts on how to start addressing this question [1] by exploring 5 CSPs in the context of the markets in which they operate and their current business model transformation performances.

Establishing the right Telco 2.0 goal for the organisation is an important first-step for senior management in the telecoms industry because:

  • Setting a Telco 2.0 goal that is unrealistically bold will quickly result in a sense of failure and a loss of morale among employees;
  • Conversely, a lack of ambition will see the organisation squeezed slowly and remorselessly into a smaller and smaller addressable market as a utility pipe provider.

Striking the right balance is critical to avoid these two unattractive outcomes.

…and the shortcomings of traditional frameworks

Senior management teams and strategists within the telecoms industry already have tools and approaches for managing investments and setting corporate goals.  So why is a fresh approach needed?  Put simply, the telecoms market is in the process of being irreversibly disrupted.  As we show in the first part of this note, traditional thinking and frameworks offer a view of the ‘as-is’ world but one which is changing fast because CSPs’ core communications services are being substituted by alternate offerings from new competitors.  The game is changing before our eyes and managers must think (and act) differently.  The framework outlined in summary here and covered in detail in the Telco 2.0 Transformation Index is designed to facilitate this fresh thinking.

Traditional strategic frameworks are useful to assess the ‘Telco 1.0’ situation

Understanding CSP groups’ ‘Telco 1.0’ strategic positioning: Ooredoo in a position of strength

Although they lack the detailed information and deep knowledge of the telecoms industry, investors have the benefit of an impartial view of different CSPs.  Unlike CSP management teams, they generally carry little personal ‘baggage’ and instead take a cold arm’s length approach to evaluating companies.  Their investment decisions obviously take into account future profit prospects and the current share price for each company to determine whether a stock is good value or not.  Leaving aside share prices, how might an investor sensibly appraise the ‘traditional’ Telco 1.0 telecoms market?

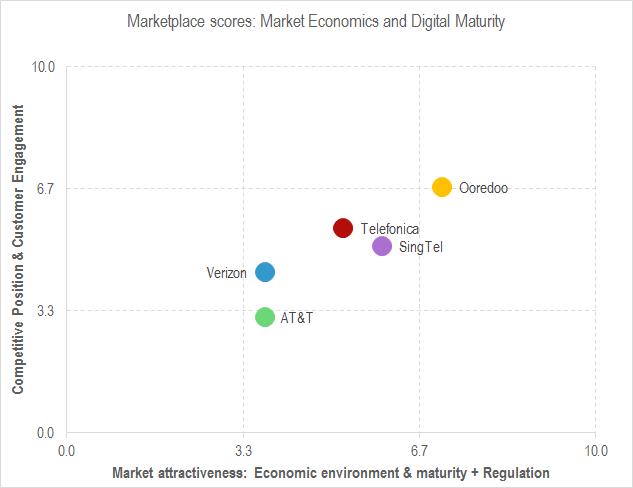
One classic framework plots competitive position against market attractiveness.  STL Partners has conducted this for 5 CSP groups in different markets as part of the analysis undertaken for the Telco 2.0 Transformation Index (see Figure 1).  According to the data collected, Ooredoo appears to be in the strongest position and, therefore, the most attractive potential investment vehicle.  Telefonica and SingTel appear to be moderately attractive and, surprisingly to many, Verizon and AT&T least attractive.

Figure 1: Strategic positioning framework for 5 CSP groups
Strategic Positioning Framework March 2014

Source: STL Partners’ Telco 2.0 Transformation Index, February 2014

Determining a CSP’s Telco 1.0 competitive position: Ooredoo enjoying life in the least competitive markets

As with all analytical tools, the value of the framework in Figure 1 is dependent upon the nature of the data collected and the methodology for converting it into comparable scores.  The full data set, methodology, and scoring tables for this and other analyses are available in the Telco 2.0 Transformation Index Benchmarking Report.  In this report, we will explore a small part of the data which drives part of the vertical axis scores in Figure 1 – Competitive Position (we exclude Customer Engagement in this report for simplicity).  In the Index methodology, there are 7 factors that determine ‘Competitive Position’ which are split into 2 categories:

  • Market competition, a consolidated score driven by:
  • Herfindahl score.  A standard economic indicator of competitiveness, reflecting the state of development of the underlying market structure, with more consolidated markets being less competitive and scoring more highly on the Herfindahl score.
  • Mobile revenue growth.  The compound annual growth of mobile revenues over a 2-year period.  Growing markets generally display less competition as individual players need to fight less hard to achieve growth.
  • Facebook penetration.  A proxy for the strength of internet and other ‘OTT’ players in the market.
  • CSP market positioning, driven by:
  • CSP total subscribers. The overall size of the CSP across all its markets.
  • CSP monthly ARPU as % of GDP per capita. The ability of the CSP to provide value to consumers relative to their income – essentially the CSP’s share of consumer wallet.
  • CSP market share. Self-explanatory – the relative share of subscribers.
  • CSP market share gain/loss. The degree to which the CSP is winning or losing subscribers relative to its peers.

If we look at the first 3 factors – those that drive fundamental market competition – it is clear why Ooredoo scores highly:

  • Its markets are substantially more consolidated than those of the other players (Figure 2).  Surprisingly, given the regular accusations of the US market being a duopoly, Verizon and AT&T have the most fragmented and competitive markets in the US.  For the fixed market, this latter point may be overstated since the US, for consumer and SME segments at least, is effectively carved up into regional areas where major fixed operators like Verizon and AT&T often do not compete head-to-head.
  • Its markets enjoy the strongest mobile revenue growth at 8.1% per annum between 2010 and 2012 versus 4.6% in Telefonica’s markets (fast in Latin America and negative in Europe), 5% in the US, and an annual decline (-1.7% ) for SingTel (Figure 3).
  • Facebook and the other internet players are much weaker in Ooredoo’s Middle Eastern markets than in Asia Pacific and Australia (SingTel), Europe and Latin America (Telefonica) and particularly the US (Verizon and AT&T) – see Figure 4.

 Figure 2: Herfindahl Score – Ooredoo enjoys the least competitive markets

Market Herfindahl Score March 2014

Note: Verizon and AT&T have slightly different scores owing the different business mixes between fixed and mobile within the US market

Source: STL Partners’ Telco 2.0 Transformation Index, February 2014

Figure 3: Ooredoo enjoying the strongest mobile market growth
Mobile Market Revenue Growth 2010-2012 March 2014

Source: STL Partners’ Telco 2.0 Transformation Index, February 2014

Ooredoo also operates in markets that have less competition from new players. For example, social network penetration is 56% in North America where AT&T and Verizon operate, 44% in Europe and South America where Telefonica operates, 58% in Singapore but only 34% in Qatar (Ooredoo’s main market) and 24% in the Middle East on average.


  • Identifying an individual CSP’s Telco 1.0 strategy: Telefonica Group in ‘harvest’ mode in most markets – holding prices, sacrificing share, generating cash
  • Frameworks used in the Telco 2.0 Transformation Index help identify evolving goals and strategies for CSPs
  • Traditional frameworks fail to account for new competitors, new services, new business models…
  • …but understanding how well each CSP is transforming to a new business model uncovers the optimum Telco 2.0 goal
  • STL Partners and the Telco 2.0™ Initiative


  • Figure 1: Strategic positioning framework for 5 CSP groups
  • Figure 2: Herfindahl Score – Ooredoo enjoys the least competitive markets
  • Figure 3: Ooredoo enjoying the strongest mobile market growth
  • Figure 4: Telefonica in harvest mode – milking companies for cash
  • Figure 5: Telco 2.0 Transformation Index strategic goals framework

Telco 2.0 Transformation Index: Technology Survey

Summary: 150 senior execs from Vodafone, Telefonica, Etisalat, Ooredoo (formerly Qtel), Axiata and Singtel supported our technology survey for the Telco 2.0 Transformation Index. This analysis of the results includes findings on prioritisation, alignment, accountability, speed of change, skills, partners, projects and approaches to transformation. It shows that there are common issues around urgency, accountability and skills, and interesting differences in priorities and overall approach to technology as an enabler of transformation. (November 2013, Executive Briefing Service, Transformation Stream.) Telco 2.0 Transformation Index Tech Survey Cover Small
  Read in Full (Members only)   To Subscribe click here

Below are a brief extract and detailed contents from a 29 page Telco 2.0 Briefing Report that can be downloaded in full in Powerpoint slideshow format by members of the Premium Telco 2.0 Executive Briefing service and the Telco 2.0 Transformation stream here.

This report is an extract from the overall analysis for the Telco 2.0 Transformation Index, a new service from Telco 2.0 Research. Non-members can find out more about subscribing to the Briefing Service here and the Transformation Index here. There will be a world first preview of the Telco 2.0 Transformation Index at our Digital Arabia Executive Brainstorm in Dubai on 11-13th November 2013. To find out more about any of these services please email contact@telco2.net or call +44 (0) 207 247 5003.

To share this article easily, please click:


Introduction


Details of the objectives and key benefits of the overall Telco 2.0 Transformation Index can be found here, and the methodology and approach here. There’s also an example of Telefonica’s market position here.

One component of our analysis has been a survey of 150 senior execs on the reality of developing and implementing technology strategy in their organisations, and the results are now available to download to members of the Telco 2.0 Executive Briefing Service.

Key Benefits

  • The report’s highly graphical and interactive Powerpoint show format makes it extremely easy to digest and reach valuable insights quickly
  • The structure of the analysis allows the reader to rapidly and concisely assimilate the complex similarities and differences between players
  • It is underpinned with detailed and sourced numerical and qualitative data


Example charts from the report

The report analyses similarities and differences in priorities across the six players.Telco 2.0 Transformation Index - Tech Prioritisation Differences - Singtel, Axiata, Vodafone, Telefonica, Etisalat, Ooredoo


It also assesses the skills profiles of the players against different strategic areas.

Telco 2.0 Transformation Index - Technology Skills analysis, Telefonica, Vodafone, Etisalat, Ooredoo, Axiata, Singtel
Contents

To access the contents of the report, including…

  • Introduction and Methodology
  • Background – the Telco 2.0 Transformation Index
  • Executive Summary
  • Survey respondents
  • Drivers of network and IT projects
  • Degree of challenge of ‘Transformation’ by operator
  • Priority areas for Transformation by operator
  • What are the preferred project approaches for transformation?
  • Alignment of techology and commercial priorities
  • Accountability for leveraging and generating value from technology projects
  • IT Skills – ‘Telco 1.0’ Vs ‘Telco 2.0’
  • Nature of strategic partnerships by operator
  • Technology project life-cycles by operator
  • Groupings by attitude to technology as a driver of success
  • Priority areas for technological improvement or transformation

Members of the Telco 2.0 Executive Briefing Subscription Service and the Telco 2.0 Transformation stream can download the full 29 page report in interactive Powerpoint slideshow format hereNon-Members, please subscribe here. For other enquiries, please email contact@telco2.net / call +44 (0) 207 247 5003.

Telco 2.0 Transformation Index: Understanding Telefonica’s Markets and Market Position

Summary: This extract from the Telco 2.0 Transformation Index shows our analysis of Telefonica’s markets and market position, including economic and digital market maturity, regulation, customers, competition and pricing. It is one part of our overall analysis of Telefonica’s progress towards transformation to the Telco 2.0 business model. The other parts of the Telefonica analysis are: Service Proposition, Finances, Technology, Value Network, and an overall summary. Telefonica is one of the companies analysed and compared in the first tranche of analysis that also addresses Vodafone, AT&T, Verizon, Axiata, SingTel, Etisalat and Ooredoo (formerly Qtel). (August 2013, Executive Briefing Service, Transformation Stream.) Telefonica Telco 2.0 Transformation Index Small

Introduction


Details of the objectives and key benefits of the overall Telco 2.0 Transformation Index can be found here, and the methodology and approach here.

Telefonica is one of the first companies featured in our Transformation Index, and one that is viewed with great interest by others. With operating companies facing very different conditions in Europe and South America, Telefonica faces some interesting strategic challenges, and has attempted to stimulate growth through innovation with the development of Telefonica Digital.

The ‘Markets and Position’ section of the analysis puts Telefonica’s current global position, risks and opportunities in context, and is now available to download to members of the Telco 2.0 Executive Briefing Service. The rest of the analysis (covering Service Proposition, Value Network, Technology and Finances), and the analyses of the other seven companies initially covered (Vodafone, AT&T, Verizon, Etisalat, Ooredoo [formerly Qtel], Singtel and Axiata) will be published from September 2013.

Key Benefits

  • The report’s highly graphical format makes it extremely easy to digest and reach valuable insights quickly into both Telefonica’s current position and future strategic needs
  • The structure of the analysis allows the reader to rapidly and concisely assimilate the complex picture of Telefonica’s international businesses, risks and opportunities
  • It is underpinned with detailed and sourced numerical and qualitative data


Example charts from the report

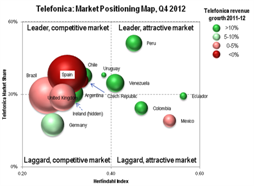
The report analyses Telefonica’s market share position across markets against their regulatory strength.
Telco 2.0 Transformation Index - Market Positioning Detail


It also assesses the economic and demographic make-up of Telefonica’s markets.

Telco 2.0 Transformation Index - Market Analysis Detail Example, Telefonica

The market analyses are consolidated into an overall summary of market positioning by Operating Company, which is further refined into an assessment of strategic approach and operational performance.

Telco 2.0 Transformation Index - Market Share and Profitability Detail


Contents

To access the contents of the report, including…

  • Introduction and Methodology
  • Market Position Summary: Economic, Regulatory, Competitive and Customers
  • Summary analysis of growth, GDP, prices and economics of key markets
  • Comparison and contrasts between European and Latin American markets
  • Regulation vs EBITDA margins
  • Mobile revenue growth by market
  • Subscribers and revenues by region
  • Mari-Meko of Subscribers and Shares in key markets
  • Market Share Vs. Regulation
  • Market Vs. Telefonica Growth by national market
  • Telefonica’s commercial strategy
  • Strength of OTT entrants in Telefonica’s markets
  • Pre-Pay, Post-Pay and Churn by Market
  • Telefonica’s relative brand strength