Connected TV: Forecasts and Winners/Losers (UK Case Study)

Summary: our in-depth look at the UK’s highly competitive digital TV market which reflects many global trends, such as competition between different types of content distributor (LoveFilm, YouTube, Virgin Media, BBC, BSkyB, BT, etc.), channel proliferation, new devices used for viewing,  and the increasing prevalence of connected TVs. What are the key trends and who will be the winners and losers? (August 2011, Executive Briefing Service) Chart from Connected TV Figure 2 telco 2.0


  Read in Full (Members only)    Buy This Report    To Subscribe

Below is an extract from this 23 page Telco 2.0 Report that can be downloaded in full in PDF format by members of the Telco 2.0 Executive Briefing service here. Non-members can buy a Single User license for this report online here for £595 (+VAT) or subscribe here. For multiple user licenses, or to book a place at our Digital Entertainment 2.0 workshop on New Business Models for the Home Video Entertainment market in Europe – Lessons from America at our London Executive Brainstorm on 8th November, please email contact@telco2.net or call +44 (0) 207 247 5003.

To share this article easily, please click:

Introduction and Background

With every wave of innovation, there are always winners and losers. In this note we examine who are likely to be the winners and losers in the UK as increasingly, TVs become connected to the internet.

While it is difficult to generalise with TV markets across the globe as the markets are fundamentally different in structure, especially with key variables such as PayTV penetration, state broadcaster involvement and fast broadband penetration varying widely, the comprehensive range of players and highly competitive nature of the UK market makes it a useful benchmark for many key global trends.

The UK TV Market

According to OFCOM’s latest research, there are 26.6m TV households in the UK with 60m TV sets or an average of 2.25 TV sets per household.

TV Viewing

Figure 1 – Average UK TV Viewing Per Day

Chart of average UK TV viewing to 2010 Fig 1 Connected TV Article Telco 2.0

Source: BARB.

TV viewing over the last few years has been remarkably resilient despite the internet and other platforms competing hard for attention. Where the TV market differs is that average consumption is very strongly proportional to age. In typical technology adoption cycles, adoption is indirectly proportional to age. This presents a real challenge to the connected TV market: the main TV consumers are more than likely to be adverse to technological change.

TV Device Manufacturers

Figure 2 – Annual UK TV Set Sales by Type 2002-2010

Chart of annual UK TV Set Sales to 2010 Fig 2 Connected TV Telco 2.0

The long term volume trend for TV manufacturers has been healthy. This has mainly been due to the innovation in device form and screen quality, with flat screen and HD features becoming the norm. TV manufacturers are now hoping that internet connected TV’s will generate another spurt in growth. Samsung and Sony are the UK market leaders.

But the challenge is the replacement cycles. With a 60m installed base of TV’s in the UK, and assuming that all the 9.5m TV’s sold in 2010 are replacements and not simply increasing the number of sets per household, the implication is that the replacement cycle is currently roughly every six years at a minimum. This is relatively slow when compared to two years for mobile phones and three years for laptops, and this in turn suggests that the adoption rate for standalone connected TVs will be much slower than the technology cycles for these devices.

While we expect internet connectivity to become a pretty standard feature with TV over the next couple of years we are sceptical about their active use for viewing video. The content offering is currently too limited. We would be surprised if within a couple of years, there are more than 1m homes regularly using TVs to watch video over the internet.

Set Top Boxes

The Set Top Box market in the UK falls into two categories: a subsidised segment which the consumer generally gets either for free or heavily discounted by their PayTV provider; and a retail segment where the consumer generally pays a full price and gives the consumer access to a limited set of free to air (FTA) channels and quite often DVR features.

In the subsidised segment, the market leader is Sky which currently manufacturers its own boxes. All the current models contain internet connectivity but require a subscription to Sky Broadband service to access Sky’s closed pull VOD service, Sky Anytime+. Sky has seeded the market for quite a few years with its Sky+ HD boxes which are currently in a minimum of 3,822k UK homes. We say a minimum because the figure is for homes with a HD subscription and Sky also installs a HD box for homes who do not subscribe to HD. This market seeding strategy accounts for the high initial take-up of the Sky Anytime+ service of 800k in the first quarter of launch. Since the service is effectively free, or rather bundled into the Sky TV and Broadband prices, we expect a rapid take up and within a couple of years Sky will have over 4m homes with their main TV connected to the internet.

Virgin Media has chosen TiVo as its exclusive connected set top box provider. The TiVo box is more open than the Sky box with the future promise of allowing independent Flash developers to deploy applications. TiVo is off to a steady start with around 50k homes in the first quarter of 2011. We expect TiVo adoption to be slower than Sky because the need for a new box which is priced at £50 with an ongoing service fee of £3/month. We expect these prices to reduce over time, but still can envisage an uptake of over 2m homes within two to three years assuming effective promotion by Virgin Media.

Another interesting opportunity is the launch of YouView. YouView is expected to come in two flavours, subsidised by CSPs and retail. BT and TalkTalk are shareholders, and are committed to launching YouView boxes by Pace and Huawei respectively in time for the London Olympics in 2012. Humax is committed to launching retail boxes. It is too early to properly forecast demand for YouView as neither the pricing or applications have yet been revealed. However, we struggle to see an installed base of over 1m homes even with the large base of broadband connections that BT and TalkTalk can market the product to.
All the original BT Vision set top boxes were manufactured by Pace (through their purchase of Philips) and need to be connected to BT broadband and therefore the whole of 575k subscribers count as connected TVs. We expect over time for BT to replace these BT Vision boxes with YouView boxes.

The major problem for YouView is that it is a proprietary UK standard whereas other European countries are committing to the hbbTV standard. This places other set top box makers in something of a quandary – will the UK market be large enough to support product development costs? Sony, Technicolour and Cisco have already publically stated that they have no current plans to develop a YouView box.

Other commentators express confidence in the Bluray players to provide the TV connectivity. We are bears of Bluray players and think the market will be niche at best.

Games Consoles

Figure 3 – Gaming Console Household Penetration

Chart of Gaming Consoles per UK Household Fig 3 Telco 2.0

Source: Ofcom residential tracker, w1 2011. Base: All adults 16+ (3,474)

Around half of UK homes contain a games console. The market is dominated by Microsoft, Sony and Nintendo and a growing number of consoles are connected to the internet. Primarily, for online gaming, but also for watching video content either via the internet or through playback of physical media such as DVD or Bluray.

Figure 4 – What UK Consumers use games consoles for

Chart of uses of gaming consoles 2010 Fig 4 Telco 2.0

Source: Ofcom residential tracker, w1 2011. Base: all adults 16+ with access to a games console at home (1,793).

We expect Gaming Consoles to become the most important method for secondary TV sets to connect to the internet, especially in children’s bedrooms. As more and more gaming moves online, we can easily see 75% of gaming consoles regularly connecting to the internet (c. 10m). However, the proportion using the console for regularly viewing video will remain small, perhaps as low as 20%. This will mean that although important Gaming Consoles will be secondary to STB’s for watching video over the internet.

To read the note in full, including additional analysis on…

  • Communications Service Providers (CSPs)
  • BT
  • Sky
  • Virgin Media
  • TalkTalk
  • Others
  • ‘Mainstream’ TV Channels
  • The BBC
  • New Entrants and Online Players
  • LoveFilm
  • Google – YouTube
  • Apple
  • Conclusions

…and the following charts…

  • Figure 1 – Average UK TV Viewing Per Day
  • Figure 2 – Annual UK TV Set Sales by Type 2002-2010
  • Figure 3 – Gaming Console Household Penetration
  • Figure 4 – What UK Consumers use games consoles for
  • Figure 5 – Main UK CSPs – Broadband and TV reach
  • Figure 6 – Take-up of multichannel TV on main sets
  • Figure 7 – Video on demand use in Virgin Media Homes
  • Figure 8 – Total UK TV Revenue by Sector
  • Figure 9 – UK TV Channel shares in all homes 1983-2010
  • Figure 10 – UK Online TV revenues by type of service
  • Figure 11 – Unique audiences to selected online film and TV sites
  • Figure 12 – Unique audiences to selected video-sharing sites
  • Figure 13 – Forecast of Connected TV market by device in 2013
  • Figure 14 – Table summarising strategy and winners/losers by type 19

Members of the Telco 2.0 Executive Briefing Subscription Service can download the full 23 page report in PDF format here. Non-Members, please see here for how to subscribe, here to buy a single user license for £595 (+VAT), or for multi-user licenses and any other enquiries please email contact@telco2.net or call +44 (0) 207 247 5003.

Organisations and products referenced: Amazon, Apple, AppleTV, BBC, BSkyB, BT, BT Vision, Cisco, Flash, Google, Huawei, Humax, ITV, LoveFilm, Microsoft, Motorola, Nintendo, O2, OFCOM, Orange, Pace, Philips, Samsung, Sky, Sky Anytime+, Sky Go, Sony, TalkTalk, Technicolour, TiVo, TV manufacturers, Virgin Media, YouTube, YouView .

Technologies and industry terms referenced: Bluray, catch-up TV, Connected TV, Digital Terrestrial, DVD, DVR, flat screen, free to air, Games Consoles, hbbTV, HD, IPTV, online, PayTV, regulatory relief, replacement cycles, Set Top Box, Tablets, Video, Video on demand (VOD).

Strategy 2.0: What Skype + Microsoft means for telcos

Summary: in theory, Microsoft and Skype have the resources, the brands, the customer base and the know-how to shape the future of telecoms and become a strategic counterweight to Apple and Google. Can they do it – and what should telcos’ strategy be? (June 2011, Executive Briefing Service, Dealing with Disruption Stream).

Microsoft Skype Logo Image Medium


This page contains an excerpt from the report, plus detailed contents, figures and tables, and a summary of the companies, products, technologies and issues covered.


Read in Full (Members only)    Buy This Report    To Subscribe

(The 35 page PDF format report is available in full to Members of the Telco 2.0 Executive Briefing Service and the Telco 2.0 Dealing with Disruption Stream here. Non-members can buy a Single User license for this report online here for £995 (+VAT) or subscribe here. For multiple user licenses or other enquiries please email contact@telco2.net or call +44 (0) 207 247 5003.)

To share this article easily, please click:

//

Introduction: Skype, the Original ‘Voice 2.0’

Everyone knows Skype as the original Voice 2.0 company – providing free phone calls, free video, status updates, all delivered using an innovative peer-to-peer architecture, and with the unique selling point of VoIP that just worked. This report describes its business model, technology strategy, its acquisition by Microsoft, and the consequences for the telecoms industry.

A little history

Founded in 2003 by Janus Friis and Niklas Zennström, Skype was acquired by eBay in 2005 for $2.6bn. eBay ownership was a period of stagnation – although eBay also owns PayPal, it only made half-hearted efforts to integrate the two. In November 2009, eBay sold 65% of Skype to an investor group led by Silver Lake for approximately $1.9bn in cash, valuing Skype at $2.75bn.

With Skype preparing for an IPO, Microsoft announced in May 2011 that it had agreed to buy the company for $8.5bn, giving the investor group a massive return and ensuring future potentially-disruptive start-ups will also attract plenty of funding. Many commentators have suggested that Microsoft is paying too much for the VOIP company, although the price-earnings ratio is actually no higher than that of Cisco’s acquisition of WebEx. So, what exactly is Microsoft getting for its billions? Let’s take a closer look.

A Dive into Skype’s Accounts

Microsoft has acquired what is essentially a global telephony company with 663 million registered users and very significant gross profitability. Skype contributed more net new minutes of international voice than the rest of the industry put together in 2010, according to Telegeography. Skype has never struggled to achieve growth, but its profitability has often been criticised, as has its ability to generate growth in ARPU. The following chart (figure 1) summarises Skype’s operational key performance indicators (KPIs) since 2006.

Figure 1: Skype’s KPIs: users, usage, and ARPU

Telco 2.0 Skype KPIs Users and ARPU June 2011 Graph Chart v1

Source: Skype’s S-1, May 2011

Questions have been raised about Skype’s performance in converting registered or even active users into paying users. This is critical, as ARPU is relatively flat. However, a monthly ARPU for paying users of $8 would be considered very reasonable for an emerging-market GSM operator and such an operator would tie up far more capital than Skype does. As all Skype users contribute to the system’s peer-to-peer (P2P) infrastructure, the marginal cost of serving non-paying users is essentially nothing.

Another way of looking at the KPIs is to consider their growth rates, as we have done in the following chart (figure 2). Although the growth of paying users is nowhere near as fast as that of free minutes of use, 40% growth per annum in revenue-generating subscribers is still very impressive.

Figure 2: Growth rates of Skype KPIs.

Telco 2.0 Skype KPIs Growth June 2011 Graph Chart

Source: Skype’s S-1, May 2011

In fact, there is very little wrong with Skype at the operating level. The following chart (figure 3) shows that, if we consider the primary challenge for Skype to be converting free users into paying users, it is actually doing rather well. Revenue and EBITDA are advancing and margins are holding up well.

Figure 3: Revenue and EBITDA growth is strong

Telco 2.0 Skype KPIs 5 Years Revenue and EBITDA June 2011 Graph Chart

Source: Skype S-1, May 2011

With 509 million active users available for conversion, ARPU may not be that relevant – just converting users of the free service into paying users has so far provided strong growth in gross profits and could do for the foreseeable future.

Figure 4: Conversion of free users at steady ARPU drives gross profit.

Telco 2.0 Skype Gross Profits June 2011 Graph Chart

Source: Skype S-1, May 2011

Skype doesn’t make money on free calls (not even from advertising or customer analytics/insights, yet), and has to pay interconnection fees and operate some infrastructure in order to provide SkypeOut (calls to conventional telephone numbers, rather than other Skype clients), and SkypeIn (calls from the PSTN to Skype users).

Skype sceptics have argued that eventually termination charges will catch up with the company and destroy its profitability. It is true that most of Skype’s revenues are generated (over 80%) by SkypeOut call charges and that Skype’s cost of net revenue is dominated (over 60%) by the cost of terminating these calls. However, termination as a percentage of Skype’s cost of net revenue is falling and Skype’s gross margin is rising, as its enormous volume growth enables it to extract better bulk pricing from interconnect operators (see Figure 5).

To see Figure 5, the conclusion of our analysis of Skype’s finances, and…

  • Is Skype Accumulating “Technical Debt”?
  • Future Plans: The Core Business, The Enterprise & Facebook
  • Telcos and Skype
  • Enter Microsoft
  • Windows Phone 7: Relevant again?
  • Microsoft’s other mobile allies: Nokia, RIM
  • How Microsoft will deploy Skype
  • Developers, developers, developers
  • Key Risks and Questions: execution, regulatory, partners, advertisers & payments
  • Answers: How Telcos should deal with Skype…and Microsoft

…plus these additional figures & fables…

  • Figure 5: How Skype’s spending is changing
  • Figure 6: Why Skype is making a loss
  • Figure 7: Commoditisation is for everybody!
  • Figure 8: 3UK benefits from its deal with Skype
  • Figure 9: Skype’s Deals with Carriers
  • Figure 10: Skype is a good fit for many Microsoft products
  • Figure 11: A unifying Skype API is critical for integration into the Microsoft empire
  • Figure 12: Telco strategy options matrix


Members of the Telco 2.0 Executive Briefing Subscription Service and the Telco 2.0 Dealing with Disruption Stream can download the full 35 page report in PDF format here. Non-Members, please see here for how to subscribe, here to buy a single user license for for £995, or for multi-user licenses and any other enquiries please email contact@telco2.net or call +44 (0) 207 247 5003.

Organisations, products and people referenced in the report: 3UK, AdSense, Android, Apple, AT&T, Au, Avaya, Ben Horowitz, BlackBerry Messenger, Cisco, Dynamics CRM, EasyBits, eBay, Exchange Server, Facebook, Facetime, Google, Google Talk, Google Voice, GSMA, Happy Pipe, Hutchison, iOS, iPhone, Jajah, Janus Friis, KDDI Mobile, Kinect, KPN, Lync, Mango, Marchex, Microsoft, Microsoft-Nokia deal, MXit, MySpace, Niklas Zennström, Nokia, Ofcom, Office Live, Outlook, PayPal, PowerPoint, Qik, RIM, Silver Lake, Skype, SkypeConnect, SkypeIn, SkypeKit, SkypeOut, SkypePhone, Steve Ballmer, Telefonica, Teredo, Tony Jacobs, Tropo, Twitter, Verizon Wireless, Virgin, Visual Studio, WebEx, WhatsApp, Windows Mobile, Windows Phone 7, WP7, Xbox, X-Series.

Technologies referenced: GSM, HD voice, HTTP/S, IM, IMS MMTel, IP networks, IPv4, IPv6, LTE, Mobile, NAT, P2P, PSTN, RCS, SILK V3, SIP, SMS, SS7, super node, URI, video telephony, Voice 2.0, VoIP, XMPP.

The Roadmap to New Telco 2.0 Business Models

$375Bn per annum Growth or Brutal Retrenchment? Which route will Telcos take?

Over the last three years, the Telco 2.0 Initiative has identified new business model growth opportunities for telcos of $375Bn p.a. in mature markets alone (see the ‘$125Bn Telco 2.0 ‘Two-Sided’ Market Opportunity’ and ‘New Mobile, Fixed and Wholesale Broadband Business Models’ Strategy Reports). In that time, most of the major operators have started to integrate elements of Telco 2.0 thinking into their strategic plans and some have begun to communicate these to investors.

But, as they struggle with the harsh realities of the seismic shift from being predominantly voice-centric to data-centric businesses, telcos now find themselves:

  • Facing rapidly changing consumer behaviours and powerful new types of competitors;
  • Investing heavily in infrastructure, without a clear payback;
  • Operating under less benign regulatory environments, which constrain their actions;
  • Being milked for dividends by shareholders, unable to invest in innovation.

As a result, far from yet realising the innovative growth potential we identified, many telcos around the world seem challenged to make the bold moves needed to make their business models sustainable, leaving them facing retrenchment and potentially ultimately utility status, while other players in the digital economy prosper.

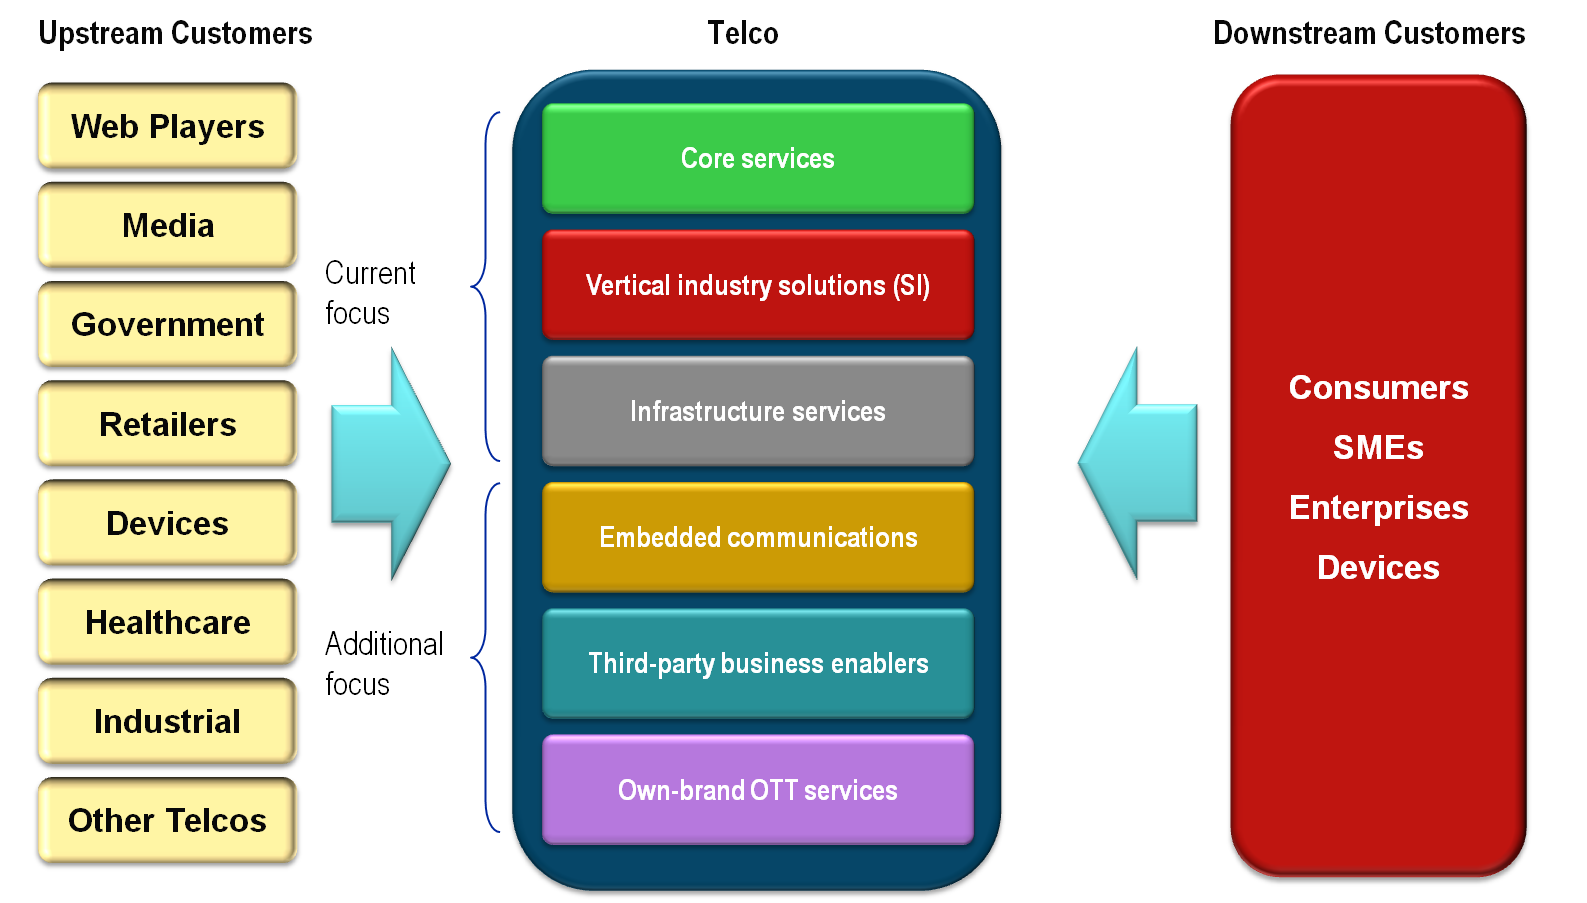
In our new 284 page strategy report – ‘The Roadmap to Telco 2.0 Business Models’ – we describe the transformational path the telecoms industry needs to take to carve out a more valuable role in the evolving ‘digital economy’. Based on the output from 5 intensive senior executive ‘brainstorms’ attended by over 1000 industry leaders, detailed analysis of the needs of ‘upstream’ industries and ‘downstream’ end users markets, and with the input from members and partners of the Telco 2.0 Initiative from across the world, the report specifically describes:

  • A new ‘Telco 2.0 Opportunity Framework’ for planning revenue growth;
  • The critical changes needed to telco innovation processes;
  • The strategic priorities and options for different types of telcos in different markets;
  • Best practice case studies of business model innovation.

The ‘Roadmap’ Report Builds on Telco 2.0’s Original ‘Two-Sided’ Telecoms Business Model

Updated Telco 2.0 Industry Framework

Source: The Roadmap to New Telco 2.0 Business Models


Who should read this report

The report is for strategy decision makers and influences across the TMT (Telecoms, Media and Technology) sector. In particular, CxOs, Strategists, Technologists, Marketers, Product Managers, and Legal and Regulatory leaders in telecoms operators, vendors, consultants, and analyst companies. It will also be valuable to those managing or considering medium to long-term investment in the telecoms and adjacent industries, and to regulators and legislators.

It provides fresh, creative ideas to:

Grow revenues beyond current projections by:

  • Protecting revenues from existing customers;
  • Extending services to new customers;
  • Generating new service offering and revenues.

Stay relevant with customers through:

  • A broader range of services and offers;
  • More personalised services;
  • Greater interaction with customers.

Evolve business models by:

  • Moving from a one-sided to a two-sided business model;
  • Generating cross-platform network effects – between service providers and customers;
  • Exploiting existing latent assets, skills and relationships.


The Six Telco 2.0 Opportunity Areas

Six Telco 2.0 Opportunity Types

Source: The Roadmap to New Telco 2.0 Business Models

What are the Key Questions the Report Answers?

For Telcos:

  • Where should your company be investing for growth?
  • What is ‘best practice’ in telecoms Telco 2.0 business model innovation and how does your company compare to it?
  • Which additional strategies should you consider, and which should you avoid?
  • What are the key emerging trends to monitor?
  • What actions are required in the areas of value proposition, technology, value / partner network, and finances?

For Vendors and Partners:

  • How to segment telecoms operators?
  • How well does your offering support Telco 2.0 strategies and transformation needs in your key customers?
  • What are the most attractive new areas in which you could support telcos in business model innovation?

For Investors and Regulators:

  • What are and will be the main new categories of telcos/CSPs?
  • What are the principle opportunity areas for operators?
  • What are and will be operator’s main strategic considerations with respect to new business models?
  • What are the major regulatory considerations of new business models?
  • What are the main advantages and disadvantages that telcos have in each opportunity area?

Contents

  • Executive Summary & Introduction
  • Pressures on Operators
  • The new Telco 2.0 Framework
  • Principles of Innovation and Services Delivery
  • – Strategic Positioning
  • – Design
  • – Development and delivery
  • Categorising telcos
  • Category 1: Leading international operators
  • Category 2: Regional leaders
  • Category 3: Wholesale and business-focused telcos
  • Category 4: Challengers & disruptors
  • Category 5: Smaller national leaders
  • Conclusions and Recommendations


Online Video Distribution: how will the market play out?

Members of the Executive Briefing Service and Future of Networks Stream: please click here for further access. Non-Members: please see here for how to access this content or go straight to buy here.

Overview

The online video distribution business model faces increasing challenges, particularly as explosive traffic growth is driving some costs faster than revenues. This is unsustainable – and there are many other changes: in content creation, aggregation, and distribution; in devices; and in end-user behaviour.

[Figure]

The Online Video Value Chain

This new Briefing summarises the evolution of the key technologies, the shifting industry structures, business models and behaviours, the evolving scenarios and the strategies required to prosper.

Who should read the report

Telco: Group strategy director, business development and strategy teams, data and IPTV product managers, CIO, CTO, CMO; Media companies; Broadcasters; Content players.

Key Challenges

In theory, telecom operators should be well-poised to benefit from the evolution of video technology. Fixed and mobile broadband services are increasing in speed, while phones and set-top boxes are becoming much more sophisticated and user-friendly.

Yet apart from some patchy adoption of IPTV as part of broadband triple-play in markets like Japan and France, the agenda is being set by Internet specialists like Google/YouTube and Joost, or offshoots of traditional media players like the BBC’s iPlayer and Hulu.

Many consumers are also turning to self-copied and pirated video content found on streaming or P2P sites. And although there is a lot of noise about the creativity of user-generated video and mashups, it is not being matched by revenue, especially from advertisers.

These changes present commercial challenges to different players in the value chain. Changes in user demand challenge the economics of “all you can eat” data plans (see “iPlayer nukes ISP business model”), content creators face well known issues relating to digital piracy and content protection, while aggregators face challenges monetising content.

Which Scenario will win – and who will prosper?

Our new research uses scenario planning to map out and analyse the future. The methodology was designed to deal with many moving parts, uncertain times and rapid change. We identified three archetypal future scenarios:

  • Old order restored: Historic distribution structures and business models are replicated online. Existing actors succeed in reinventing and reasserting themselves against new entrants.
  • Pirate world: Distribution becomes commoditised, copyright declines in relevance and the Internet destroys value. A new business model is required.
  • New order emerges: New or “evolved” distributors replace existing ones, with content aggregation becoming more valuable, as well as delivery via a multitude of devices and networks.

Which of these scenarios will dominate, when, and what can operators and other players do in order to prosper?

Key Topics Covered

  • Current market and variation across national markets
  • Significant changes and trends in content production, aggregation and distribution
  • Significant changes and trends in devices and end-user behaviour
  • Detail on the scenarios and the likely market evolution
  • Consequences of the changes by content genre (movies, sport, user-generated, adult)
  • Strategies to prosper as the scenarios evolve

Contents

Key questions for online video distribution

  • Online video today
  • Bandwidth
  • Penetration
  • Other factors

Emerging industry structure

  • User-generated vs. professional content
  • Aggregated vs. curated content
  • Market size

Future challenges for the industry

  • Content creation
  • Aggregation
  • Distribution
  • Customer environment and devices
  • Supply and demand side issues

Future scenarios for online video

  • Genre differences
  • Mobile video evolution
  • Regional differences

Strategic options for distributors

  • Threats
  • Weakness
  • Strengths
  • Opportunities
  • Strategic options

Conclusion

Members of the Executive Briefing Service and Future of Networks Stream: please click here for further accessNon-Members: please see here for how to access this content or go straight to buy here.