Mobile app latency in Europe: French operators lead; Italian & Spanish lag

Latency as a proxy for customer app experience

Latency is a measure of the time taken for a packet of data to travel from one designated point to another. The complication comes in defining the start and end point. For an operator seeking to measure its network latency, it might measure only the transmission time across its network.

However, to objectively measure customer app experience, it is better to measure the time it takes from the moment the user takes an action, such as pressing a button on a mobile device, to receiving a response – in effect, a packet arriving back and being processed by the application at the device.

This ‘total roundtrip latency’ time is what is measured by our partner, Crittercism, via embedded code within applications themselves on an aggregated and anonymised basis. Put simply, total roundtrip latency is the best measure of customer experience because it encompasses the total ‘wait time’ for a customer, not just a portion of the multi-stage journey

Latency is becoming increasingly important

Broadband speeds tend to attract most attention in the press and in operator advertising, and speed does of course impact downloads and streaming experiences. But total roundtrip latency has a bigger impact on many user digital experiences than speed. This is because of the way that applications are built.

In modern Web applications, the business logic is parcelled-out into independent ‘microservices’ and their responses re-assembled by the client to produce the overall digital user experience. Each HTTP request is often quite small, although an overall onscreen action can be composed of a number of requests of varying sizes so broadband speed is often less of a factor than latency – the time to send and receive each request. See Appendix 2: Why latency is important, for a more detailed explanation of why latency is such an important driver of customer app experience.

The value of using actual application latency data

As we have already explained, STL Partners prefers to use total roundtrip latency as an indicator of customer app experience as it measures the time that a customer waits for a response following an action. STL Partners believes that Crittercism data reflects actual usage in each market because it operates within apps – in hundreds of thousands of apps that people use in the Apple App Store and in Google Play. This is a quite different approach to other players which require users to download a specific app which then ‘pings’ a server and awaits a response. This latter approach has a couple of limitations:

1. Although there have been several million downloads of the OpenSignal and Actual Experience app, this doesn’t get anywhere near the number of people that have downloaded apps containing the Crittercism measurement code.

2. Because the Crittercism code is embedded within apps, it directly measures the latency experienced by users when using those apps1. A dedicated measurement app fails to do this. It could be argued that a dedicated app gives the ‘cleanest’ app reading – it isn’t affected by variations in app design, for example. This is true but STL Partners believes that by aggregating the data for apps such variation is removed and a representative picture of total roundtrip latency revealed. Crittercism data can also show more granular data. For example, although we haven’t shown it in this report, Crittercism data can show latency performance by application type – e.g. Entertainment, Shopping, and so forth – based on the categorisation of apps used by Google and Apple in their app stores.

A key premise of this analysis is that, because operators’ customer bases are similar within and across markets, the profile of app usage (and therefore latency) is similar from one operator to the next. The latency differences between operators are, therefore, down to the performance of the operator.

Why it isn’t enough to measure average latency

It is often said that averages hide disparities in data, and this is particularly true for latency and for customer experience. This is best illustrated with an example. In Figure 2 we show the distribution of latencies for two operators. Operator A has lots of very fast requests and a long tail of requests with high latencies.

Operator B has much fewer fast requests but a much shorter tail of poor-performing latencies. The chart clearly shows that operator B has a much higher percentage of requests with a satisfactory latency even though its average latency performance is lower than operator A (318ms vs 314ms). Essentially operator A is let down by its slowest requests – those that prevent an application from completing a task for a customer.

This is why in this report we focus on average latency AND, critically, on the percentage of requests that are deemed ‘unsatisfactory’ from a customer experience perspective.

Using latency as a measure of performance for customers

500ms as a key performance cut-off

‘Good’ roundtrip latency is somewhat subjective and there is evidence that experience declines in a linear fashion as latency increases – people incrementally drop off the site. However, we have picked 500ms (or half a second) as a measure of unsatisfactory performance as we believe that a delay of more than this is likely to impact mobile users negatively (expectations on the ‘fixed’ internet are higher). User interface research from as far back as 19682 suggests that anything below 100ms is perceived as “instant”, although more recent work3 on gamers suggests that even lower is usually better, and delay starts to become intrusive after 200-300ms. Google experiments from 20094 suggest that a lasting effect – users continued to see the site as “slow” for several weeks – kicked in above 400ms.

Percentage of app requests with total roundtrip latency above 500ms – markets

Five key markets in Europe: France, Germany, Italy, and the UK.

This first report looks at five key markets in Europe: France, Germany, Italy, and the UK. We explore performance overall for Europe by comparing the relative performance of each country and then dive into the performance of operators within each country.

We intend to publish other reports in this series, looking at performance in other regions – North America, the Middle East and Asia, for example. This first report is intended to provider a ‘taster’ to readers, and STL Partners would like feedback on additional insight that readers would welcome, such as latency performance by:

  • Operating system – Android vs Apple
  • Specific device – e.g. Samsung S6 vs iPhone 6
  • App category – e.g. shopping, games, etc.
  • Specific countries
  • Historical trends

Based on this feedback, STL Partners and Crittercism will explore whether it is valuable to provide specific total roundtrip latency measurement products.

Contents

  • Latency as a proxy for customer app experience
  • ‘Total roundtrip latency’ is the best measure for customer ‘app experience’
  • Latency is becoming increasingly important
  • STL Partners’ approach
  • Europe: UK, Germany, France, Italy, Spain
  • Quantitative Analysis
  • Key findings
  • UK: EE, O2, Vodafone, 3
  • Quantitative Analysis
  • Key findings
  • Germany: T-Mobile, Vodafone, e-Plus, O2
  • Quantitative Analysis
  • Key findings
  • France: Orange, SFR, Bouygues Télécom, Free
  • Quantitative Analysis
  • Key findings
  • Italy: TIM, Vodafone, Wind, 3
  • Quantitative Analysis
  • Key findings
  • Spain: Movistar, Vodafone, Orange, Yoigo
  • Quantitative Analysis
  • Key findings
  • About STL Partners and Telco 2.0
  • About Crittercism
  • Appendix 1: Defining latency
  • Appendix 2: Why latency is important


  • Figure 1: Total roundtrip latency – reflecting a user’s ‘wait time’
  • Figure 2: Why a worse average latency can result in higher customer satisfaction
  • Figure 3: Major European markets – average total roundtrip latency (ms)
  • Figure 4: Major European markets – percentage of requests above 500ms
  • Figure 5: The location of Google and Amazon’s European data centres favours operators in France, UK and Germany
  • Figure 6: European operators – average total roundtrip latency (ms)
  • Figure 7: European operators – percentage of requests with latency over 500ms
  • Figure 8: Customer app experience is likely to be particularly poor at 3 Italy, Movistar (Spain) and Telecom Italia
  • Figure 9: UK Operators – average latency (ms)
  • Figure 10: UK operators – percentage of requests with latency over 500ms
  • Figure 11: German Operators – average latency (ms)
  • Figure 12: German operators – percentage of requests with latency over 500ms
  • Figure 13: French Operators – average latency (ms)
  • Figure 14: French operators – percentage of requests with latency over 500ms
  • Figure 15: Italian Operators – average latency (ms)
  • Figure 16: Italian operators – percentage of requests with latency over 500ms
  • Figure 17: Spanish Operators – average latency (ms)
  • Figure 18: Spanish operators – percentage of requests with latency over 500ms
  • Figure 19: Breakdown of HTTP requests in facebook.com, by type and size

Self-Disruption: How Sprint Blew It

Introduction

At the beginning of 2013, we issued an Executive Briefing on the proposed take-over of Sprint-Nextel by Softbank, which we believed to be the starting gun for disruption in the US mobile market.

At the time, not only was 68% of revenue in the US market controlled by the top two operators, AT&T and Verizon, it was also an unusually lucrative market in general, being both rich and high-spending (see Figure 1, taken from the The Future Value of Voice & Messaging strategy report). Further, the great majority of net-adds were concentrated among the top two operators, with T-Mobile USA flat-lining and Sprint beginning to lose subscribers. We expected Sprint to initiate a price war, following a plan similar to Softbank’s in Japan, separating the cost of devices from that of service, making sure to offer the hero smartphone of the day, and offering good value on data bundles.

Figure 1: The US, a rich country that spends heavily on telecoms

The US a rich country that spends heavily on telecoms feb 2014

Source: STL Partners

In the event, the fight for control of Sprint turned out to be more drawn out and complex than anyone expected. Add to this the complexity of Sprint’s major network upgrade, Network Vision, as shown in Figure 2, and the fact that the plans changed in order to take advantage of Softbank’s procurement of devices for the 2.5GHz band, and it is perhaps less surprising that we have yet to see a major strategic initiative from Sprint.

Figure 2: The Softbank deal brought with it major changes to Network Vision
The Softbank deal brought with it major changes to Network Vision feb 2014

Source: Sprint Q3 earnings report

Instead, T-Mobile USA implemented a very similar strategy, having completed the grieving process for the AT&T deal and secured investment from DTAG for their LTE roll-out and spectrum enhancements. So far, their “uncarrier” strategy has delivered impressive subscriber growth at the expense of slashing prices. The tale of 2013 in terms of subscribers can be seen in the following chart, updated from the original Sprint/Softbank note. (Note that AT&T, VZW, and T-Mobile have released data for calendar Q3, but Sprint hasn’t yet – the big question, going by the chart, will be whether T-Mobile has overtaken Sprint for cumulative net-adds.)

Figure 3: The duopoly marches on, T-Mobile recovers, Sprint in trouble

The duopoly marches on, T-Mobile recovers, Sprint in trouble Feb 2014

Source: STL Partners

However, Sprint did have a major strategic initiative in the last two years – and one that went badly wrong. We refer, of course, to the shutdown of the Nextel half of Sprint-Nextel.

Closing Nextel: The Optimistic Case

There is much that is good inside Sprint, which explains both why so much effort went into its “turnaround” and why Masayoshi Son was interested. For example, its performance in terms of ARPU is strong, to say the least. The following chart, Figure 4, illustrates the point. Total ARPU in post-paid, which is most of the business, is both high at just under $65/mo and rising steadily. ARPU in pre-paid is essentially flat around $25/mo. The problem was Nextel and specifically, Nextel post-paid – while pre-paid hovered around $35/mo, post-paid trended steadily down from $45/mo to parity with pre-paid by the end.

Figure 4: Sprint-Nextel ARPU

Sprint-Nextel ARPU feb 2014

Source: STL Partners

The difference between the two halves of Sprint that were doing the work here is fairly obvious. Nextel’s unique iDEN network was basically an orphan, without a development path beyond the equivalent of 2005-era WCDMA speeds, and without smartphones. Sprint CDMA, and later LTE, could offer wireless broadband and could offer the iPhone. Clearly, something had to be done. You can see the importance of smartphone adoption from the following graphic, Figure 5, showing that smartphones drove ARPU on Sprint’s CDMA network.

Figure 5: Sprint CDMA has reached 80% smartphone adoption

Sprint CDMA has reached 80% smartphone adoption feb 2014

Source: STL Partners

It is true that smartphones create opportunities to substitute OTT voice and messaging, but this is less of a problem in the US. As the following chart from the Future Value of Voice and Messaging strategy report shows, voice and messaging are both cheap in the US, and people spend heavily on mobile data.

Figure 6: US mobile key indicators

US mobile key indicators feb 2014

Source: STL Partners

So far, the pull effect of better devices on data usage has helped Sprint grow revenues, while it also drew subscribers away from Nextel. Sprint’s strategy in response to this was to transition Nextel subscribers over to the mainline platform, and then shut down the network, while recycling savings and spectrum from the closure of Nextel into their LTE deployment.


  • Closing Nextel: The Scoreboard
  • Recapture
  • The Double Dippers
  • The Competition: AT&T Targets the Double Dippers
  • Developers, Developers, Devices
  • Conclusions


  • Figure 1: The US, a rich country that spends heavily on telecoms
  • Figure 2: The Softbank deal brought with it major changes to Network Vision
  • Figure 3: The duopoly marches on, T-Mobile recovers, Sprint in trouble
  • Figure 4: Sprint-Nextel ARPU
  • Figure 5: Sprint mainline has reached 80% smartphone adoption
  • Figure 6: US mobile key indicators
  • Figure 7: Tale of the tape – something goes wrong in early 2012
  • Figure 8: Sprint’s “recapture” rate was falling during 3 out of the 4 biggest quarters for Nextel subscriber losses, when it needed to be at its best
  • Figure 9: Nextel post-paid was 72% business customers in 3Q 2011
  • Figure 10: The loss of high-value SMB customers dragged Sprint’s revenues into negative territory
  • Figure 11: The way mobile applications development used to be

Digital Commerce: Leading Apps and Strategies for Retailers, Online Players and Telcos in the $10Bn Loyalty Market

Summary:  The advent of smartphones and tablets is disrupting the $10Bn+ loyalty market by opening up new ways for brands and retailers to engage with their customers in a highly interactive fashion.  This briefing analyses that market, why mobile is a compelling medium in it, key mobile app types, and leading edge strategies used by online players and traditional retailers. It concludes by outlining the strategies telcos need to employ to add value and exploit their assets and capabilities to play a major role in the value chain. (July 2013, Executive Briefing Service, Dealing with Disruption Stream.)

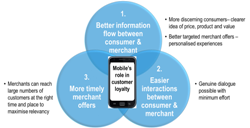
Loyalty and Mobile Venn Diagram 2013

  Read in Full (Members only)  Buy a single user license online  To Subscribe click here

Below is an extract from this 44 page Telco 2.0 Report that can be downloaded in full in PDF format by members of the Telco 2.0 Executive Briefing service and the Dealing with Disruption Stream here. Non-members can subscribe here, buy a Single User license for this report online here for £795 (+VAT for UK buyers), or for multi-user licenses or other enquiries, please email contact@telco2.net / call +44 (0) 207 247 5003.

To share this article easily, please click:


Who is this report for?

  • CxOs, strategists, marketing strategists and managers, loyalty programme managers, digital commerce and experience managers, new business development and sales people
  • In Telecoms operators and Vendors in Digital and Mobile Commerce, and in Financial Services and Online and / or ‘Bricks and Mortar’ Retail
  • More broadly, any executive or investor looking for an informed new perspective on the digital loyalty market

Key benefits

  • Better and more benchmarked decisions about your own company’s use of digital and mobile media to deliver loyalty progammes, increase loyalty and reduce churn
  • Better and more informed views about the potential needs of 3rd party digital loyalty programmes in this $10Bn + market, and how telcos in particular could address them
  • A broader understanding of the loyalty ecosystem and links to other aspects of digital commerce

Introduction

STL Partners defines Digital Commerce 2.0 as the use of new digital and mobile technology to bring buyers and sellers together more efficiently and effectively. Fast-growing usage of mobile and social networking is opening up direct communication channels for bricks-and-mortar companies that could strengthen relationships with customers and, as a result, improve both sales performance and operating efficiency.

With consumers permanently connected via mobile and social networking, leveraging the collective influence of loyal customers has never been more important. Now, more than ever, retailers are looking to facilitate information access and sharing – such as comparison tools, vouchers, personalised offers, and loyalty points – with their customers. An engaged and loyal customer base is likely to spend more and act as a ‘brand ambassador’ community for the company.

This executive briefing builds on STL Partners’ previously-published reports, Digital Commerce: Show me the Money and The Mobile Commerce Land-grab, which map out a comprehensive mobile commerce strategy and systematic approach to deploy services. In this briefing, STL Partners focuses on a specific aspect of our Digital Commerce “Wheel of Commerce”: Mobile loyalty. It explores opportunities for mobile operators to establish themselves as strong strategic position in the mobile loyalty space. In this briefing, we:

  • Define the loyalty market and explore the role of mobile technologies as an loyalty-enabler
  • Estimate the size of the loyalty market in Europe and in the U.S.
  • Identify, categorise and analyse some of the best global practices of both start-ups and Internet players, such as FidMe, Foursquare or Shopkick and well-known retailers and brands; namely Starbucks and Sephora
  • Examine how telcos can participate in the loyalty value chain
  • Highlight the key next steps for telcos to become successful in the mobile loyalty space

Market size and opportunity

The growing importance of mobile in commerce

In the mid-1990s, e-commerce platforms began disrupting the retail sector by promoting a new consumption model that gave consumers greater control and access to a wider choice of products, price comparison tools, and customer feedback information. Online players thus not only enjoyed cost advantages, but also customer experience advantages over high-street retailers.  Bricks-and-mortar players had to re-examine and re-evaluate their relationships with customers.

While mobile technology continues to create challenges for high-street players by enabling, for example, ‘show-rooming’ in which customers browse products in the store while simultaneously finding the best price for the same product online, mobile also provides the tools for a ‘high-street fight-back’.  By communicating with individual customers through the mobile channel, brands and shops have the ability to provide relevant personalised messages and offers that promote brand loyalty, as well as directly affecting purchasing behaviour.

The impact of mobile technologies on purchasing decisions is, therefore, increasing rapidly.  As well as using their handsets to buy more, consumers are also using mobile phones as a key tool for research and to make buying decisions.

Figure 1: digital buying is a multi-channel process

Consumers Take a Multi-Device Path to Purchase May 2013

Source: Google

Defining the loyalty market

We define loyalty as covering three principle activities within the ‘Retain’ section of STL Partners’ Digital Commerce ‘Wheel of Commerce (see Figure 2) – a schematic representation of all the key elements of a holistic digital commerce offering:

  • Loyalty programmes: A loyalty programme is a marketing initiative that rewards – and, therefore, encourages – loyal “buying behaviour” amongst an existing customer base. Examples of successful loyalty programmes are Tesco Clubcard and Nectar in the UK, Air Miles or AMEX cashback rewards.
  • Advocacy programmes: “Customer advocates” are customers who have a high degree of affinity or emotional equity towards a brand and will proactively talk about a brand, engage others in discussions about it, and influence people to buy a specific product and service. These ad-hoc promotional activities are usually not monitored or regulated by the brand itself. Luxury hotel chains, such as the Hilton or Carlson, are examples of brands with these kinds of advocates.
  • Brand communities: A brand community is essentially a group of ardent consumers organised around a lifestyle and the interests, activities, and ethos of the brand. Those users are “continuously” in touch with the brand and each other, not only responding to company initiatives, but also initiating and continuing conversations of their own about any aspect of the brand/business. Apple, Nike, Harley Davidson and Oracle are examples of brands, which have successfully created brand communities. Although brand communities have traditionally existed offline, the internet has strongly facilitated communication and information sharing between people. The primary difference to Advocacy programmes is that the key interactions are within the brand community as opposed to with potential new users and customers.

Things are complicated, of course, by the fact that the other sections of the ‘Wheel of Commerce’ are used in loyalty activities – customer profiling (in the plan section), offers and deals (promote), recommendations (guide), coupon redemptions and loyalty rewards (transact), and customer ratings (satisfy) are all potentially part of an effective loyalty or advocacy program.

Figure 2: STL Partners’ ‘Wheel of Commerce’
STL Partners’ ‘Wheel of Commerce’ May 2013

Source: STL Partners

A loyalty market estimated at $1.7+ billion in Europe and $9 billion in the US

For the reasons outlined above, it is not easy to size loyalty as a distinct market separate from other marketing and payment activities associated with digital commerce. 

As one benchmark, the AIMIA UK coalition estimates that £1 out of every £15 spent by UK consumers was eligible for a loyalty reward – or 6.7% of their spending. According to Payment Council, the UK spent around £312 billion in retail in 2012, so using the AIMIA UK coalition’s 6.7% estimate, this equates to a total retail value of £21 billion being eligible for loyalty schemes. Based on the major UK loyalty schemes (Tesco, Nectar), for each pound spent in retail, customers are rewarded with a penny voucher (1:100 ratio).  Therefore, the estimated UK loyalty spending by retailers in terms of rewards issued (as opposed to redeemed) is £210 million, i.e. US$325 million.

The UK loyalty marketplace is mature compared to other European countries. According to Global Vision, the UK represents 15 percent of the EU25 Purchasing Power Parity (PPP), suggesting a potential USD1.4 billion European loyalty market value.

Moreover Colloquy estimates that the perceived value of points sold to third-parties in 2011 in the US was worth $9 billion.

Figure 3: US Loyalty Market $Bns
US Loyalty Market $Bns May 2013

Sources: Colloquy, AIMIA, Payment Council, Global Vision, STL Partners
Exchange rate: £1= USD1.55

Some estimates of the value of the loyalty market are much higher. For example, Colloquy estimated the 2011 U.S. loyalty market at USD 48bn, while AIMIA has predicted that the global loyalty market will be worth USD 100bn in 2015. Those higher estimates refer to the broader loyalty market, which notably includes the transport and hospitality industries (with their popular ‘Airmiles’ type schemes). In this study, STL Partners is only considering the retail industry. Also some industry estimates include valuations relating to consumers’ perceived value of their earned and collected points, as opposed to the effective cost to the merchant, which we have used to give a more relevant comparison for players considering the business case in more depth.

Why is mobile such an important component in generating customer loyalty?

Mobile technologies open up new and creative ways for brands and retailers to interact with their target audiences. They can use the mobile channel to exchange value with their target audiences in order to generate leads, as well as on-going dialogue, which can be used, for example, to learn more about customers or to test new product and service concepts. An increasing proportion of retailers are integrating innovative mobile and digital technology into their marketing and loyalty strategy as a mean to differentiate and to fulfil customers’ needs for more personalisation, interactivity, and proximity.

Personalised shopping experiences

The relationship that retailers maintain with their customers is being reinvented. The combination of the Internet, online commerce platforms and advanced analytics tools is enabling new forms of interaction with online consumers.

Consumers are now expecting more personalised shopping experiences.  Amazon has, for example, strengthened its customer relationships by offering support across the whole customer life cycle – recommendations, purchase decision, delivery, after-sale service and customer retention.

As shoppers grow more fluent in browsing and comparing prices via smartphone, pure ‘bricks-and-mortar’ retail channels are struggling to keep pace with discount online merchants that contribute to the rise of “showrooming”, in which customers browse for products in stores and then buy them online from Amazon and other retailers for less. Such is Amazon’s confidence that it can offer prices unmatched by stores that its ‘price checker’ application is even encouraging consumers to visit bricks-and-mortar retailers to trial products before ordering them online from Amazon.

By placing the Internet in the hands of consumers all the time, mobile devices are enhancing consumers’ information and control over their shopping experience. Retailers of any kind must respond by offering competitively-priced and personalised offerings.

Effective customer engagement and interactivity

As more consumer attention and transactions move on to mobile, it is no surprise that retailers and brands see this as an increasingly important way to engage with customers.  Mobile advertising, heavily hyped between 2005 and 2007, is finally beginning to attract material budgets.  However, there has been a shift away from traditional display advertising (common on the Internet) towards more interactive forms of engagement that take advantage of mobile’s unique characteristics of immediacy and ability to influence consumers while they are out and about combined with an effective ‘return path’ – whether that be via SMS or WAP.  Moreover, the ubiquity and intrinsic characteristics of mobile phones have enabled and facilitate “on-the-go” dialogue and content sharing activities.

Retailers are now encouraging loyal customers to populate social media channels with engaging content: (Micro)-blogging sites, photo galleries, forums, polls, and videos are all examples of social communication channels that are being used by merchants and brands to interact with existing customers. It is no surprise that the battleground for Internet players that offer marketing and advertising support, such as Facebook, Google and Microsoft (Online Services division), is shifting rapidly to mobile.

Mobile increases merchant timeliness and reach

As the level of ‘marketing noise’ for consumers rises remorselessly on the Internet, merchants increasingly need to offer appropriate relevant messages at the right time. For example, product offers need to be made while consumers are in-store (and before they reach the point of sale), not while they are at home opening mail or, worse, overseas in a different time zone. Mobile does not just provide reach but, with the addition of location and presence, also allows merchants to interact with consumers efficiently at the right place and the right time.

Figure 4: Three ways mobile can support retailer and brand loyalty schemes
Three ways mobile can support retailer and brand loyalty schemes May 2013

 Source: STL Partners/Telco 2.0

To read the note in full, including the following additional analysis…

  • Two major mobile loyalty app categories
  • Physical loyalty card replacement
  • Loyalty-oriented digital commerce applications
  • Retailers’ loyalty strategies
  • Starbucks – Deepen customer relationship to drive loyalty
  • Sephora – loyalty scheme to unify its social and mobile marketing strategy
  • Where and how could telcos play in the loyalty market?
  • 1. Implement and experiment with your own loyalty programme
  • 2. Create compelling and powerful rewards
  • 3. Exploit your customer data to enable third-party businesses
  • 4. Build loyalty into m-wallet services
  • 5. Provide connectivity to deepen the communication channels between retailers and their consumers
  • What should operators do?
  • 1. Explore, Experiment and Collaborate
  • 2. Develop a compelling “in-door” coverage proposition to retailers
  • 3. Invest in customer data skills
  • About STL Partners

…and the following figures…

  • Figure 1: digital buying is a multi-channel process
  • Figure 2: STL Partners’ ‘Wheel of Commerce’
  • Figure 3: US Loyalty Market $Bns
  • Figure 4: Three ways mobile can support retailer and brand loyalty schemes
  • Figure 5: Key Ring aggregates loyalty cards within a single ‘wallet-like’ application
  • Figure 6: FidMe – a simple loyalty card scheme for local brands
  • Figure 7: Snapp’ business model
  • Figure 8: Foursquare’s SoMoLo app
  • Figure 9: Shopkick’s automated shopper rewards – ‘kicks’
  • Figure 10: Mobile Shopping Apps Average Time Spent per Month
  • Figure 11: Starbucks’ Facebook page
  • Figure 12: Starbucks’ promotional offers on Twitter
  • Figure 13: Starbucks’ Pinterest boards
  • Figure 14: Frappucino.com
  • Figure 15: Starbuck’s mobile application
  • Figure 16: Starbucks leading approach to digital loyalty
  • Figure 17: Starbucks 2000 – 2012
  • Figure 18: Sephora’s employees on Pinterest
  • Figure 19: Sephora virtual mirror application
  • Figure 20: Sephora on Passbook
  • Figure 21: “Beauty Insider” is unifying Sephora’s customer experience
  • Figure 22: Sephora 2000 – 2012
  • Figure 23: How the MinuTrade cash back programme works
  • Figure 24: MinuTrade value proposition
  • Figure 25: Value of telcos’ capabilities to retailers
  • Figure 26: How Wi-Fi fits into O2’s mobile commerce strategy
  • Figure 27: Telcos advantages to support retailer and brand loyalty activities
  • Figure 28: Relative value to telcos versus ease of implementation

Members of the Telco 2.0 Executive Briefing Subscription Service and the Dealing with Disruption Stream can download the full 44 page report in PDF format hereNon-Members, please subscribe here, buy a Single User license for this report online here for £795 (+VAT for UK buyers), or for multi-user licenses or other enquiries, please email contact@telco2.net / call +44 (0) 207 247 5003.

Technologies and industry terms referenced: