Data-driven telecoms: navigating regulations

Regulation has a significant impact on global communications markets

Telco relationships with telecoms regulators and the governments that influence them are very important. For data-driven telecoms, telcos must now also understand the regulation of digital markets, and how different types of data are treated, stored and transferred around the world. Data-driven telecoms is an essential part of telecoms growth strategy. The massive growth enjoyed by the global tech giants, in contrast with the stagnation of growth in the telecoms industry, provides a significant lure for telcos, to harness data and become digital businesses themselves. Of course, this necessitates complying with digital regulations, and understanding their direction.

Additionally, by participating in digital markets, and digitising their own systems, telcos are necessarily working with and sometimes competing against the global digital, for whom this legislation is essential to their ongoing business practices. Political reaction against some practices of these digital giants is leading to some toughened stances on digital regulation around the world, and a tarnished public perception.

Most businesses are impacted by digital regulation to some extent, but it is those most deeply embedded in digital markets that feel it the most, especially the digital hyper-scalers. What do Google, Meta, Microsoft et al need to do differently as digital regulations evolve and new standards come into play? And for telcos, apart from compliance, are there opportunities presented by new digital regulations? How can telcos and the digital giants evolve their relationships with the entities that regulate them? Can they ultimately work together to create a better future based on the Co-ordination Age vision, or will they remain adversarial with lines drawn around profit vs public good?

What is digital regulation?

The report covers two important aspects of digital regulation for telecoms players – data governance and digital market regulations.

It does not cover a third theme in digital regulation – the regulation of potentially harmful content and the responsibilities of digital platforms in this regard. This is a complex and far-reaching issue, affecting global trade agreements, sparking philosophical debates and leading to some tricky public relations challenges for digital platform providers. However, for the purposes of this report we will set aside this issue and focus instead on data governance and the regulation of digital markets which have most direct relevance to telcos in particular.

Data governance is a large topic, covering the treatment, storage and transfer of all kinds of data. Different national and regional regulatory bodies may have different approaches to data governance rules, broadly depending on where they find the balance between prioritising security, privacy and the rights of the individual, against the need for a free flow of data to fuel the growth of digital industries.

Regulation around data governance also naturally splits into two areas, one concerning personal data, and the other concerning industrial data, with greater regulatory scrutiny focused on the former. The regulation of these types of data are necessarily different because concerns about privacy only really apply to data that can be associated with individual people, although there may still be requirements around security, and fair access to industrial data. Examples of data governance regulation are the EU’s General Data Protection Regulation (GDPR) concerning personal data, and The Data Act concerning industrial data, or the Data Privacy and Protection Act in the US. All of these examples will be discussed in greater detail in the main body of the report.

Enter your details below to download an extract of the report

Significant types of digital regulation

Source: STL Partners

Regulation specific to policing digital markets has emerged when regulatory bodies decide that general competition law is not sufficient to serve digital markets, and that more specific and tailored rules or reparations are needed. Like other forms of competition law, this regulation aims to promote fair and open competition and curb market participants deemed to possess significant market power. Regulations of this nature are always to some degree controversial, because the exact boundaries of what constitutes significant market power have to be defined, and can be argued to be arbitrary or incorrectly drawn. Examples of this type of regulation that will be discussed in depth later in the report are the Digital Markets Act in the EU, and the Innovation and Choice Online Act in the US.

A global perspective

The market for digital services is by its nature global. Digital giants like Google, Meta, Amazon and Apple are offering a wide variety of digital services, both b2b and b2c, all over the world. Those services will be provisioned using storage, compute power, and even human workforce, that may or may not be located in the country or even region in which the service is being consumed. Thus digital regulations, especially those concerning data governance, are globally significant.

A global market

Source: STL Partners

This report places significant focus on the regulatory agendas of the European Union and the United States. This is because these are two of the most significant and influential global powers in setting trends in digital regulation. This significance is gained partly by market size – in a global market such as that for digital services, regulations that cover a large number of potential customers are going to have more weight, and the European Union has a population of roughly 447mn, while the population of the US is around 332mn. The US also maintains its significant role in setting the digital regulatory agenda by actively seeking influence and leadership, while the EU has gained influence by being one of the most proactive, and stringent, regulatory bodies in the world.

Table of Contents

  • Executive Summary
  • Introduction
  • Important trends in data governance regulation
    • Regulation of the processing, storage and use of personal data
    • Regulation of industrial data
  • Regulation of digital markets
    • The Digital Markets Act: Governing digital monopolies
    • The US approach to digital market regulation
  • A global perspective – how EU and US digital regulation trends are spreading around the world
    • The Globalisation of the EU Regulation: The Brussels Effect
    • Digital Economy Governance in the US Foreign Policy
    • Digital in the EU-US Transatlantic Relationship
    • A Patchwork of Digital Agreements in Asia
    • A New Global Framework on Cross-Border Data Flows
  • Conclusion
    • Advice for Telcos

Related research

Enter your details below to download an extract of the report

Four goals for the data-driven telco

Becoming a data-driven telco

There have been many case studies over the last five years demonstrating the disruption caused by “data-driven businesses”, i.e. those using insights to understand customers, automate processes, change their business models and drive new revenues. In the future, this concept will become an integral part of what it takes to compete successfully, allowing organisations to understand and run all parts of their operations, work with their customers and partners and take part in external activities in new ecosystems. This applies to telecoms operators as much as any other industry.

This research builds on a range of reports STL Partners has previously published on strategic topics related to telcos’ use of data, including:

This research turns to the practical topics of delivering on these strategic goals. The diagram below offers an overview of the drivers and barriers affecting delivery areas such as telco data management and machine learning (ML) in the short and longer term.

Drivers and barriers to being a data-driven telco

Source: STL Partners

Enter your details below to request an extract of the report

What capabilities should telcos develop?

Telcos are reasonably sophisticated users of data, but their particularly complex web of legacy systems requires a good deal of work around data management and governance to enable the extraction of data sets to give 360-degree view of the customer – and increasingly to provide training data for algorithms.

In the mid-term, telcos that are successful in selling IoT and becoming ecosystem players will require new A3 to deal with the increasing number of services, devices, price points and parties involved in providing service to a customer. Our research suggests that there is a range of new A3 technologies that can provide the automation and intelligence for this, as well as for the underlying data management processes.

In the longer-term, A3 will speed up decision making, impacting company strategy, new product and service creation, and customer experience. Humans will increasingly be supported by AI-, ML- and automation-powered tools in their decision-making. A similar progression will occur among competitors in telecoms, and in adjacent markets, increasing the complexity and speed of doing business. Besides integrating A3 into human workflows, working at increasing speed will depend on getting richer insights out of the available data with techniques such as small data and creation of synthetic data.

Capabilities for a data-driven telco

Source: STL Partners


Table of contents

  • Executive Summary
    • Capabilities telcos should develop over the medium term
    • What will telcos focus on in the mid-term?
    • Next steps
  • Becoming a data-driven telco
    • Short term drivers
    • Barriers in the short term
    • Long term drivers
    • Barriers in the long term
  • Availability of data
    • Use of data fabrics
    • Better data labelling
    • Rise of synthetic data
    • More intelligent data selection
    • Telco strategies for cloud usage
  • Equipping people
    • Augmented analytics and business intelligence
    • Decision intelligence
  • Work on governance
    • Governance across the telco
    • Agility in governance
    • Governance for AI and machine learning
    • Ethical governance
    • Improved measurement of governance
    • Governance in ecosystems
  • Index

A3 for enterprise: Where should telcos focus?

A3 capabilities operators can offer enterprise customers

In this research we explore the potential enterprise solutions leveraging analytics, AI and automation (A3) that telcos can offer their enterprise customers. Our research builds on a previous STL Partners report Telco data monetisation: What’s it worth? which modelled the financial opportunity for telco data monetisation – i.e. purely the machine learning (ML) and analytics component of A3 – for 200+ use cases across 13 verticals.

In this report, we expand our analysis to include the importance of different types of AI and automation in implementing the 200+ use cases for enterprises and assess the feasibility for telcos to acquire and integrate those capabilities into their enterprise services.

We identified eight different types of A3 capabilities required to implement our 200+ use cases.

These capability types are organised below roughly in order of the number of use cases for which they are relevant (i.e. people analytics is required in the most use cases, and human learning is needed in the fewest).

The ninth category, Data provision, does not actually require any AI or automation skills beyond ML for data management, so we include it in the list primarily because it remains an opportunity for telcos that do not develop additional A3 capabilities for enterprise.

Enter your details below to download an extract of the report

Most relevant A3 capabilities across 200+ use cases

9-types-of-A3-analytics-AI-automation

Most relevant A3 capabilities for leveraging enterprise solutions

People analytics: This is the strongest opportunity for telcos as it uses their comprehensive customer data. Analytics and machine learning are required for segmentation and personalisation of messaging or action. Any telco with a statistically-relevant market share can create products – although specialist sales capabilities are still essential.

IoT analytics: Although telcos offering IoT products do not immediately have access to the payload data from devices, the largest telcos are offering a range of products which use analytics/ML to detect patterns or spot anomalies from connected sensors and other devices.

Other analytics: Similar to IoT, the majority of other analytics A3 use cases are around pattern or anomaly detection, where integration of telco data can increase the accuracy and success of A3 solutions. Many of the use cases here are very specific to the vertical. For example, risk management in financial services or tracking of electronic prescriptions in healthcare – which means that a telco will need to have existing products and sales capability in these verticals to make it worthwhile adding in new analytics or ML capabilities.

Real time: These use cases mainly need A3 to understand and act on triggers coming from customer behaviour and have mixed appeal to telcos. Telcos already play a significant role in a small number of uses cases, such as mobile marketing. Some telcos are also active in less mature use cases such as patient messaging in healthcare settings (e.g. real-time reminders to take medication or remote monitoring of vulnerable adults). Of the rest of the use cases that require real time automation, a subset could be enhanced with messaging. This would primarily be attractive to mobile operators, especially if they offer broader relevant enterprise solutions – for example, if a telco was involved in a connected public transport solution, then it could also offer passenger messaging.

Remote monitoring/control: Solutions track both things and people and use A3 to spot issues, do diagnostic analysis and prescribe solutions to the problems identified. The larger telcos already have solutions in some verticals, and 5G may bring more opportunities, such as monitoring of remote sites or traffic congestion monitoring.

Video analytics: Where telcos have CCTV implementations or video, there is opportunity to add in analytics solutions (potentially at the edge).

Human interactions: The majority of telco opportunities here relate to the provision of chatbots into enterprise contact centres.

Human learning: A group of low feasibility use cases around training (for example, an engineer on a manufacturing floor who uses a heads-up augmented/virtual reality (AR/VR) display to understand the resolution to a problem in front of them) or information provision (for example, providing retail customers with information via AR applications).


Table of Contents

  • Executive Summary
    • Which A3 capabilities should telcos prioritise?
    • What makes an investment worthwhile?
    • Next steps
  • Introduction
  • Vertical opportunities
    • Key takeaways
  • A3 technology: Where should telcos focus?
    • Key takeaways
    • Assessing the telco opportunity for nine A3 capabilities
  • Verizon case study
  • Details of vertical opportunities
  • Conclusion
  • Appendix 1 – full list of 200 use cases


Enter your details below to download an extract of the report

Telco data monetisation: What is it worth?

Data revenue opportunities are variable

Monetisation of telco data has been an area of activity for the last six years. However, telcos’ interest levels have varied over time due to the complexity of delivering and selling such a diverse range of products, as well as highly variable revenue opportunities depending on the vertical. Telcos’ appetite to pursue data monetisation has also been heavily impacted by the fortunes of other new telco products, in particular IoT, owing to the link between many data/analytics products and IoT solutions.

This report assesses the opportunity for telcos to monetise their data and provide associated data analytics products in two parts:

  1. First, we look at the range of products and services a telco needs to create in order to deliver financial value.
  2. Then, we explore the main use cases and actual financial value of telco data analytics products across 12 verticals, plus horizontal solutions that apply to multiple verticals.

Telco data monetisation: Calculation methodology

The methodology used to model the financial value of telco data analytics is outlined in the figure below.

  • The starting point for this analysis is 210 data or data analytics use cases, spread across 12 verticals and the horizontal solutions applicable to multiple verticals.
  • We then assess how difficult it is for a telco to address each use case, based on pre-requisite supporting platforms and solutions, regulatory constraints, etc. (shown in red). This evaluation enables us to assess how likely telcos are to develop products for each use case.
  • Thirdly, we assess which types of telco are able to develop the use case (in yellow). For example, telcos in a market with particularly restrictive regulation around use of personal data are simply not able to create certain products.
  • Finally, it is necessary to understand whether the data/analytics products created for a use case can be offered as an independent, standalone product, or more likely to be provided as a bolt-on service to another, pre-existing solution. This question is primarily pertinent in the IoT space where basic data/analytics are likely to be included in the price of the IoT service.
    • For products that we expect to be sold independently, we calculate the potential revenue based on estimated pricing for the type of data product, where known, and likely volumes that a telco will sell in a year.
    • For data analytics products closely linked to IoT, we attach no monetary value.

Calculation methodology for the feasibility and value of telco data monetisation use cases

Rationale behind data monetisation potential

Source: STL Partners, Charlotte Patrick Consult

Enter your details below to download an extract of the report

Viewing the data

Underlying the analysis in this report is a database tool including a detailed assessment of each of the 210 data monetisation use cases we have identified, with numerical analysis and charting capabilities. We know many of our readers will be interested to explore the detailed data, and so have made it available for download on the website in the form of an Excel spreadsheet.

Full use case database and analysis available on our website

Source: STL Partners

Table of Contents

  • Executive Summary
  • Introduction
    • Calculation methodology
  • What is this market worth to telcos?
  • Creating products for data monetisation
    • Telco products for the ecosystem
    • Data and analytics for IoT
    • Use of location in data monetisation
  • Maximising value in different verticals
    • Advertising and market research
    • Agriculture
    • Finance
    • Government
    • Insurance
    • Healthcare
    • Manufacturing
    • Real estate and construction
    • Retail
    • Telecom, media and technology
    • Transportation
    • Utilities
    • Horizontal solutions for all verticals
  • Conclusion and recommendations
    • How to pick a winning project
  • Index

Enter your details below to download an extract of the report

Monetising IoT: Four steps for success

Introduction

The internet of things (IoT) will revolutionise all industries, not just TMT. In addition to the benefits of connecting previously unconnected objects to monitor and control them, the data that IoT will make available could play a pivotal role in other major technological developments, such as big data analytics and autonomous vehicles.

It seems logical that, because IoT relies on connectivity, this will be a new growth opportunity for telcos. And indeed, as anyone who has attended MWC in the last few years can testify, most if not all major telcos are providing some kind of IoT service.

But IoT is not a quick win for telcos. The value of IoT connectivity is only a small portion of the total estimated value of the IoT ecosystem, and therefore telcos seeking to grow greater value in this area are actively moving into other layers, such as platforms and vertical end solutions.

Enter your details below to download an extract of the report

Figure 1: Telcos are moving beyond IoT connectivity

Telcos are moving beyond IoT connectivity

Source: STL Partners

Although telco IoT strategies have evolved significantly over the past five years, this is a complicated and competitive area that people are still figuring out how to monetise. To help our clients overcome this challenge we are publishing a series of reports and best practice case studies over the next 12 months designed to help individual operators define their approach to IoT according to their size, market position, geographic footprint and other key characteristics such as appetite for innovation.

This report is the first in this series. The findings it presents are based upon primary and secondary research conducted between May and September 2017 which included:

  • A series of anonymous interviews with operators, vendors and other key players in the IoT ecosystem
  • A brainstorming session held with senior members from telco strategy teams at our European event in June 2017
  • An online survey about telcos’ role in IoT, which ran from May to June 2017

Contents:

  • Executive Summary
  • Introduction
  • A four-step process to monetise IoT
  • Step 1: Look beyond connected device forecasts
  • Step 2: Map out your IoT strategy
  • Step 3: Be brave and commit
  • Step 4: Develop horizontal capabilities to serve your non-core verticals
  • Result: The T-shaped IoT business model
  • IoT data is a secondary opportunity
  • Conclusion

Figures:

  • Figure 1: Telcos are moving beyond IoT connectivity
  • Figure 2: IoT verticals and use-cases
  • Figure 3: Four possible roles within the IoT ecosystem
  • Figure 4: Telcos can play different roles in different verticals
  • Figure 5: IoT connectivity can be simplified into four broad categories
  • Figure 6: As the IoT field matures, use-cases become more complex
  • Figure 7: The technical components of an IoT platform
  • Figure 8: The T-shaped IoT business model

Enter your details below to download an extract of the report

AI on the Smartphone: What telcos should do

Introduction

Following huge advances in machine learning and the falling cost of cloud storage over the last several years, artificial intelligence (AI) technologies are now affordable and accessible to almost any company. The next stage of the AI race is bringing neural networks to mobile devices. This will radically change the way people use smartphones, as voice assistants morph into proactive virtual assistants and augmented reality is integrated into everyday activities, in turn changing the way smartphones use telecoms networks.

Besides implications for data traffic, easy access to machine learning through APIs and software development kits gives telcos an opportunity to improve their smartphone apps, communications services, entertainment and financial services, by customising offers to individual customer preferences.

The leading consumer-facing AI developers – Google, Apple, Facebook and Amazon – are in an arms race to attract developers and partners to their platforms, in order to further refine their algorithms with more data on user behaviours. There may be opportunities for telcos to share their data with one of these players to develop better AI models, but any partnership must be carefully weighed, as all four AI players are eyeing up communications as a valuable addition to their arsenal.

In this report we explore how Google, Apple, Facebook and Amazon are adapting their AI models for smartphones, how this will change usage patterns and consumer expectations, and what this means for telcos. It is the first in a series of reports exploring what AI means for telcos and how they can leverage it to improve their services, network operations and customer experience.

Contents:

  • Executive Summary
  • Smartphones are the key to more personalised services
  • Implications for telcos
  • Introduction
  • Defining artificial intelligence
  • Moving AI from the cloud to smartphones
  • Why move AI to the smartphone?
  • How to move AI to the smartphone?
  • How much machine learning can smartphones really handle?
  • Our smartphones ‘know’ a lot about us
  • Smartphone sensors and the data they mine
  • What services will all this data power?
  • The privacy question – balancing on-device and the cloud
  • SWOT Analysis: Google, Apple, Facebook and Amazon
  • Implications for telcos

Figures:

  • Figure 1: How smartphones can use and improve AI models
  • Figure 2: Explaining artificial intelligence terminology
  • Figure 3: How machine learning algorithms see images
  • Figure 4: How smartphones can use and improve AI models
  • Figure 5: Google Translate works in real-time through smartphone cameras
  • Figure 6: Google Lens in action
  • Figure 7: AR applications of Facebook’s image segmentation technology
  • Figure 8: Comparison of the leading voice assistants
  • Figure 9: Explanation of Federated Learning

Music Lessons: How the music industry rediscovered its mojo

Introduction

The latest report in STL Partners’ Dealing with Disruption stream, this paper explores what telcos and their partners can learn from the music industry and its response to disruptive forces unleashed by the Internet.

Music was among the first industries to see its core product (compact discs) completely undermined by the Internet’s emergence as the primary distribution mechanism for content and software, throwing the record labels into a long standing struggle to maintain both relevance and revenues. After almost two decades of decline, sales of recorded music are growing again and, in developed markets, at least, the existential threat posed by piracy seems to have abated. Although the music industry still has problems aplenty, the success of streaming services has steadied the ship.

This report outlines how the music industry has regained its mojo, before considering the lessons for telcos and other digital service providers. The first section of the paper considers why music streaming has become so successful and whether the model will be sustainable. The second section of the paper explores the lessons companies from other sectors, notably telecoms, can draw from the ways in which the music industry responded to the Internet’s disruptive forces.

This paper builds on other entertainment-related reports published by STL Partners, including:

Apple’s pivot to services: What it means for telcos
Telco-Driven Disruption: Will AT&T, Axiata, Reliance Jio and Turkcell succeed?
Amazon: Telcos’ Chameleon-King Ally?
Can Telcos Entertain You? Vodafone and MTN’s Emerging Market Strategies (Part 2)
Can Telcos Entertain You? (Part 1)

Music bounces back

Over the past 20 years, the rise of the Internet has shaken the music industry to the core, obsolescing its distribution model, undermining its business model and enabling new forms of piracy. Yet, the major record labels have survived, albeit in a consolidated form, and the sector is now showing some tentative signs of recovery. In 2013, the global music industry began to grow again for the first time since the turn of the Millennium. It continues to recover and will grow at a compound annual growth rate of 3.5% between now and 2021, according to research by PwC, fuelled by growth in both the recorded music and the live music sectors (see Figure 1).

Figure 1: The global music industry has returned to growth

The global music industry has returned to growth

Source: PWC and Ovum

For most of the past two decades, revenues from recorded music have been shrinking, leaving the industry increasingly reliant on ticket sales for live performances. Widespread piracy, together with the growing obsolesce of CDs, appeared to be turning recorded music into a form of advertising for concerts and tours.

But in 2015, global recorded music revenues began to grow again. In 2016, they rose a relatively healthy 5.9% to US$15.7 billion (about one third of the industry’s total revenue), according to a report by the International Federation of the Phonographic Industry (IFPI). For music industry executives, that growth marks an important milestone. “We got here through years of hard work,” Michael Nash, executive vice president of digital strategy at Universal records, told the Guardian in April 2017, adding that the music industry was still going through a “historical transformation. The only reason we saw growth in the past two years, after some 15 years of substantial decline, is that music has been one of the fastest adapting sectors in the digital world.”

Contents:

  • Executive Summary
  • Introduction
  • Music bounces back
  • What has changed?
  • Is streaming the final word in music distribution
  • Lessons to learn from music’s recovery

Figures:

  • Figure 1: The global music industry has returned to growth
  • Figure 2: The way people buy recorded music is changing dramatically
  • Figure 3: YouTube pays particularly low rates per stream
  • Figure 4: YouTube is a major destination for music lover
  • Figure 5: Music is one of the slowest growing entertainment segments
  • Figure 6: Spotify’s losses continue to grow despite the growth in revenues
  • Figure 7: Spotify’s subscription service is growing rapidly
  • Figure 8: Concert ticket revenues are up sevenfold since 1996 in North America
  • Figure 9: Major concert tickets sell for an average of $77 apiece

4G Roll Out Analysis: Winning Strategies and 5G Implications

Identifying & Analysing Key Operators

In search of the best practice in 4G deployment, we first had to pick out the operators who did best on quantitative metrics, before we could drill down qualitatively to investigate why. We screened all the 40 MNOs that have so far launched 4G in the BRICS, the United States, the top 5 European markets, China, Japan, Taiwan, and South Korea, on the following indicators.

  • Monthly headline ARPU, converted to US dollars
  • Market share by subscribers
  • Quarterly net-adds
  • 4G adoption, % of the subscriber base
  • EBITDA margin %

Where possible, we also collected information on network density (i.e. subscribers per cell), and on spectrum holdings. In Figure 1, we plot EBITDA margin against the change in market share in percentage points since Q4 2012, sizing the bubbles by US dollar monthly ARPU. The axes are set to the average values for each metric.

Figure 1: 8 out of 40 MNOs made the cut for further analysis 


Source: STL Partners, themobileworld.com, company filings

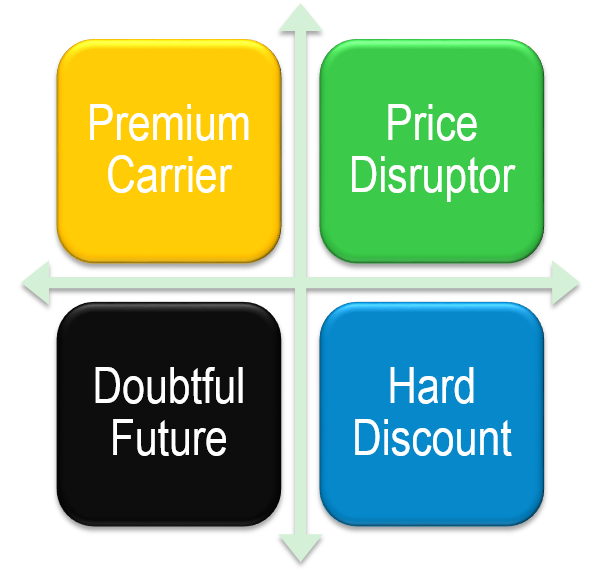
The top-right quadrant shows those operators who are above average both on improving margins and gaining share. We picked those operators who got into the top-right quadrant – above-average EBITDA margin and positive share growth – for at least two quarters, and have a positive trend, for further research. Those are:

  • Chunghwa Telecom
  • Free Mobile
  • Verizon Wireless
  • AT&T Mobility
  • Wind
  • Bharti Airtel
  • 3UK
  • MTS

We expected to find that those operators who chose market share first, initiating the price disruptions in the US and in France, would have sacrificed margin as they chased share. An example would be T-Mobile USA, additionally marked in purple on the chart. This is essentially the scenario allegedly needing “market repair” which is dear to the hearts of European telco lobbyists. However, as Figure 2 shows, we found something very different. Profitability is actually gradually increasing with subscriber growth, but only for the top-performing operators. Again, bubbles are scaled to ARPU.


  • Executive Summary*
  • Identifying & Analysing Key Operators
  • A Design for Success*
  • Parameters*
  • Commercial Options*
  • What Strategy Did the Top Eight Adopt?*
  • Conclusions on the Network for the top Eight*
  • Conclusions on the Commercial Strategy*
  • Getting It Wrong*
  • Operator Case Studies
  • Conclusions and recommendations*

(* = not shown here)


  • Figure 1: 8 out of 40 MNOs made the cut for further analysis
  • Figure 2: The fastest-growing 4G operators are either holding or gradually increasing their EBITDA margins*
  • Figure 3: Scale helps, but less than you might think*
  • Figure 4: A strategy matrix for 4G operators*
  • Figure 5: An introduction to carrier aggregation*
  • Figure 6: Parameters of our 8 leading 4G deployers*
  • Figure 7: MTS holds onto margins as data volumes surge*
  • Figure 8: Wind’s data revenue gains now offset losses from voice entirely, at 37% margins*
  • Figure 9: VZW’s service margin soars despite the price disruption*
  • Figure 10: AT&T service margins are also high and rising*
  • Figure 11: Service margins are rising strongly at 3UK*
  • Figure 12: Six operators who are struggling to escape the lower-left quadrant*
  • Figure 13: Sprint and T-Mobile are playing the same game but only one is winning*
  • Figure 14: Sprint toned down the smartphone bonanza in 2015*
  • Figure 15: Vodafone’s European OpCos are improving, but it’s been a hard road*
  • Figure 16: Vodafone Germany’s turnaround plan – 1800MHz plus backhaul*
  • Figure 17: Project Spring still hasn’t filled the fibre gap*
  • Figure 18: Free, despite being the smallest and latest to start of the French MNOs, had an outstanding score on our latency index*
  • Figure 19: T-Mobile USA’s latency performance is market-leading on a blended 3G/4G basis*
  • Figure 20: T-Mobile USA generates fewer high latency events than any US operator*

(* = not shown here)

Mobile app latency in Europe: French operators lead; Italian & Spanish lag

Latency as a proxy for customer app experience

Latency is a measure of the time taken for a packet of data to travel from one designated point to another. The complication comes in defining the start and end point. For an operator seeking to measure its network latency, it might measure only the transmission time across its network.

However, to objectively measure customer app experience, it is better to measure the time it takes from the moment the user takes an action, such as pressing a button on a mobile device, to receiving a response – in effect, a packet arriving back and being processed by the application at the device.

This ‘total roundtrip latency’ time is what is measured by our partner, Crittercism, via embedded code within applications themselves on an aggregated and anonymised basis. Put simply, total roundtrip latency is the best measure of customer experience because it encompasses the total ‘wait time’ for a customer, not just a portion of the multi-stage journey

Latency is becoming increasingly important

Broadband speeds tend to attract most attention in the press and in operator advertising, and speed does of course impact downloads and streaming experiences. But total roundtrip latency has a bigger impact on many user digital experiences than speed. This is because of the way that applications are built.

In modern Web applications, the business logic is parcelled-out into independent ‘microservices’ and their responses re-assembled by the client to produce the overall digital user experience. Each HTTP request is often quite small, although an overall onscreen action can be composed of a number of requests of varying sizes so broadband speed is often less of a factor than latency – the time to send and receive each request. See Appendix 2: Why latency is important, for a more detailed explanation of why latency is such an important driver of customer app experience.

The value of using actual application latency data

As we have already explained, STL Partners prefers to use total roundtrip latency as an indicator of customer app experience as it measures the time that a customer waits for a response following an action. STL Partners believes that Crittercism data reflects actual usage in each market because it operates within apps – in hundreds of thousands of apps that people use in the Apple App Store and in Google Play. This is a quite different approach to other players which require users to download a specific app which then ‘pings’ a server and awaits a response. This latter approach has a couple of limitations:

1. Although there have been several million downloads of the OpenSignal and Actual Experience app, this doesn’t get anywhere near the number of people that have downloaded apps containing the Crittercism measurement code.

2. Because the Crittercism code is embedded within apps, it directly measures the latency experienced by users when using those apps1. A dedicated measurement app fails to do this. It could be argued that a dedicated app gives the ‘cleanest’ app reading – it isn’t affected by variations in app design, for example. This is true but STL Partners believes that by aggregating the data for apps such variation is removed and a representative picture of total roundtrip latency revealed. Crittercism data can also show more granular data. For example, although we haven’t shown it in this report, Crittercism data can show latency performance by application type – e.g. Entertainment, Shopping, and so forth – based on the categorisation of apps used by Google and Apple in their app stores.

A key premise of this analysis is that, because operators’ customer bases are similar within and across markets, the profile of app usage (and therefore latency) is similar from one operator to the next. The latency differences between operators are, therefore, down to the performance of the operator.

Why it isn’t enough to measure average latency

It is often said that averages hide disparities in data, and this is particularly true for latency and for customer experience. This is best illustrated with an example. In Figure 2 we show the distribution of latencies for two operators. Operator A has lots of very fast requests and a long tail of requests with high latencies.

Operator B has much fewer fast requests but a much shorter tail of poor-performing latencies. The chart clearly shows that operator B has a much higher percentage of requests with a satisfactory latency even though its average latency performance is lower than operator A (318ms vs 314ms). Essentially operator A is let down by its slowest requests – those that prevent an application from completing a task for a customer.

This is why in this report we focus on average latency AND, critically, on the percentage of requests that are deemed ‘unsatisfactory’ from a customer experience perspective.

Using latency as a measure of performance for customers

500ms as a key performance cut-off

‘Good’ roundtrip latency is somewhat subjective and there is evidence that experience declines in a linear fashion as latency increases – people incrementally drop off the site. However, we have picked 500ms (or half a second) as a measure of unsatisfactory performance as we believe that a delay of more than this is likely to impact mobile users negatively (expectations on the ‘fixed’ internet are higher). User interface research from as far back as 19682 suggests that anything below 100ms is perceived as “instant”, although more recent work3 on gamers suggests that even lower is usually better, and delay starts to become intrusive after 200-300ms. Google experiments from 20094 suggest that a lasting effect – users continued to see the site as “slow” for several weeks – kicked in above 400ms.

Percentage of app requests with total roundtrip latency above 500ms – markets

Five key markets in Europe: France, Germany, Italy, and the UK.

This first report looks at five key markets in Europe: France, Germany, Italy, and the UK. We explore performance overall for Europe by comparing the relative performance of each country and then dive into the performance of operators within each country.

We intend to publish other reports in this series, looking at performance in other regions – North America, the Middle East and Asia, for example. This first report is intended to provider a ‘taster’ to readers, and STL Partners would like feedback on additional insight that readers would welcome, such as latency performance by:

  • Operating system – Android vs Apple
  • Specific device – e.g. Samsung S6 vs iPhone 6
  • App category – e.g. shopping, games, etc.
  • Specific countries
  • Historical trends

Based on this feedback, STL Partners and Crittercism will explore whether it is valuable to provide specific total roundtrip latency measurement products.

Contents

  • Latency as a proxy for customer app experience
  • ‘Total roundtrip latency’ is the best measure for customer ‘app experience’
  • Latency is becoming increasingly important
  • STL Partners’ approach
  • Europe: UK, Germany, France, Italy, Spain
  • Quantitative Analysis
  • Key findings
  • UK: EE, O2, Vodafone, 3
  • Quantitative Analysis
  • Key findings
  • Germany: T-Mobile, Vodafone, e-Plus, O2
  • Quantitative Analysis
  • Key findings
  • France: Orange, SFR, Bouygues Télécom, Free
  • Quantitative Analysis
  • Key findings
  • Italy: TIM, Vodafone, Wind, 3
  • Quantitative Analysis
  • Key findings
  • Spain: Movistar, Vodafone, Orange, Yoigo
  • Quantitative Analysis
  • Key findings
  • About STL Partners and Telco 2.0
  • About Crittercism
  • Appendix 1: Defining latency
  • Appendix 2: Why latency is important


  • Figure 1: Total roundtrip latency – reflecting a user’s ‘wait time’
  • Figure 2: Why a worse average latency can result in higher customer satisfaction
  • Figure 3: Major European markets – average total roundtrip latency (ms)
  • Figure 4: Major European markets – percentage of requests above 500ms
  • Figure 5: The location of Google and Amazon’s European data centres favours operators in France, UK and Germany
  • Figure 6: European operators – average total roundtrip latency (ms)
  • Figure 7: European operators – percentage of requests with latency over 500ms
  • Figure 8: Customer app experience is likely to be particularly poor at 3 Italy, Movistar (Spain) and Telecom Italia
  • Figure 9: UK Operators – average latency (ms)
  • Figure 10: UK operators – percentage of requests with latency over 500ms
  • Figure 11: German Operators – average latency (ms)
  • Figure 12: German operators – percentage of requests with latency over 500ms
  • Figure 13: French Operators – average latency (ms)
  • Figure 14: French operators – percentage of requests with latency over 500ms
  • Figure 15: Italian Operators – average latency (ms)
  • Figure 16: Italian operators – percentage of requests with latency over 500ms
  • Figure 17: Spanish Operators – average latency (ms)
  • Figure 18: Spanish operators – percentage of requests with latency over 500ms
  • Figure 19: Breakdown of HTTP requests in facebook.com, by type and size

Digital Commerce 2.0: Disrupting the Californian Giants

Introduction

In this briefing, we analyse the Digital Commerce 2.0 strategy and progress of the incumbents – the big five Internet players in this market – Amazon, Apple, eBay/PayPal, Facebook and Google.

STL defines Digital Commerce 2.0 as the use of new digital and mobile technologies to bring buyers and sellers together more efficiently and effectively. Fast growing adoption of mobile, social and local services is opening up opportunities to provide consumers with highly-relevant advertising and marketing services, underpinned by secure and easy-to-use payment services. By giving people easy access to information, vouchers, loyalty points and electronic payment services, smartphones can be used to make shopping in bricks and mortar stores as interactive as shopping through web sites and mobile apps.

This executive briefing considers how the rise of smartphones and the personal data they generate is disrupting digital commerce, and explores the mobile commerce strategies of the big five, their strengths and weaknesses and their areas of vulnerability.

Digital Commerce Disruption

Today, California is undoubtedly the epicentre of digital commerce. Amazon, Google, eBay/PayPal, Facebook and Apple are the leading brokers of digital commerce between businesses and consumers in most of the world’s developed economies. Each one of them has used the Internet to carve out a unique and lucrative role matching online buyers and sellers.

But digital commerce is changing fast, forcing these incumbents to innovate rapidly both to keep pace with each other and fend off a new wave of challengers seeking to take advantage of the disruption resulting from the widespread adoption of smartphones, and the vast quantities of real-time personal data they generate. Smartphones with touchscreens, full Internet browsers and an array of feature-rich apps, are turning out to be a game changer that profoundly impacts the way in which people and businesses buy and sell: Digital commerce is moving out of the home and the office and on to the street and in to the store.

As they move around, many consumers are now using smartphones to access social, local and mobile (SoLoMo) digital services and make smarter purchase decisions. This is not a gradual shift – it is happening extraordinarily quickly. Almost 70% of Americans used their mobile devices to look up information while in retail stores between Thanksgiving and Christmas 2012, according to a survey of 6,200 people by customer experience analytics firm ForeSee.

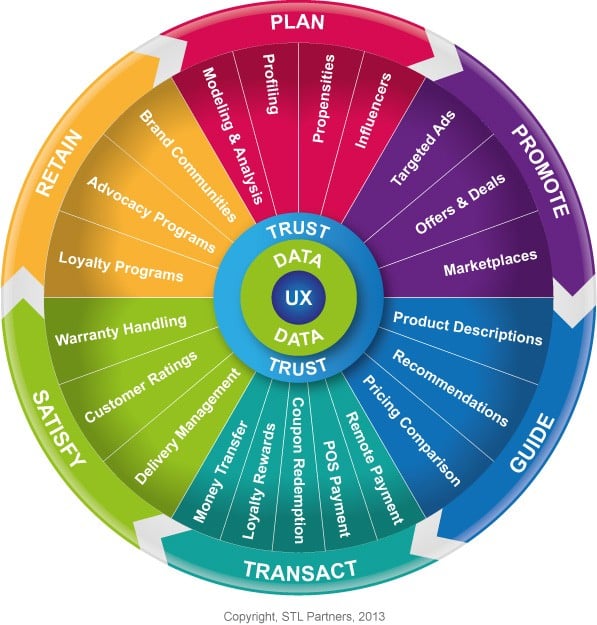
At the same time, the combination of Internet and mobile technologies, embodied in the smartphone, is enabling bricks and mortar businesses to adopt new forms of digital marketing, retailing and payments that could dramatically improve their efficiency and effectiveness. The smartphones and the data they generate can be used to optimise and enable every part of the entire ‘wheel of commerce’ (see Figure 3).

Figure 3: The elements that make up the wheel of commerce

Digital Commerce 2.0 Wheel of Commerce

Source: STL Partners

The extensive data being generated by smartphones can give companies real-time information on where their customers are and what they are doing. That data can be used to improve merchants’ marketing, advertising, stock management, fulfilment and customer care. For example, a smartphone’s sensors can detect how fast the device is moving and in what direction, so a merchant could see if a potential customer is driving or walking past their store.

Marketing that makes use of real-time smartphone data should also be more effective than other forms of digital marketing. In theory at least, targeting marketing at consumers in the right geography at a specific time should be far more effective than simply displaying adverts to anyone who conducts an Internet search using a specific term.

Similarly, local businesses should find sending targeted vouchers, promotions and information, delivered via smartphones, to be much more effective than junk mail at engaging with customers and potential customers. Instead of paying someone to put paper-based vouchers through the letterbox of every house in the entire neighbourhood, an Indian restaurant could, for example, send digital vouchers to the handsets of anyone who has said they are interested in Indian food as they arrive at the local train station between 7pm and 9pm in the evening. As it can be precisely targeted and timed, mobile marketing should achieve a much higher return on investment (ROI) than a traditional analogue approach.

Although the big five – Amazon, Google, eBay/PayPal, Facebook and Apple – are the leading brokers of “traditional” online commerce, they play a far smaller role in brokering bricks and mortar commerce: Their services are typically used to provide just once element of the wheel of commerce. Consumers shopping in the physical world tend to use a mix of services from the leading Internet players, flitting between the different ecosystems. As they shop, they might use Google Maps to locate a store, Facebook to canvas the opinion of friends and Amazon to read product reviews or compare in-store prices with those online. They might even use Apple’s Passbook to redeem a voucher or PayPal to complete a transaction at point of sale.

Although they are all involved to a greater or lesser extent, none of the big five has yet secured a strong strategic position in this new form of digital commerce. Each of them risks seeing their position in the broader digital commerce market being disrupted by the rise of SoLoMo services that seek to meld merchants online and offline sites into a coherent proposition. As the digital commerce pie grows to encompass more and more bricks and mortar commerce, the big five may see their power and influence wane.

As it becomes clear that smartphones and personal data will transform the consumer experience of bricks and mortar shopping, the leading internet companies are being challenged by telcos, banks, payment networks and other companies racing to sign up merchants and consumers for nascent commerce platforms. In most cases, these new entrants are focusing on digitising traditional commerce, but will inevitably also have to compete with Amazon, Google, eBay/PayPal, Facebook and Apple in the online commerce space – consumers will want to use the same tools and platforms regardless of whether they are in the armchair or walking down a street. Similarly, a merchant will want to use the same platform to support its marketing online and in-store, so their customers can redeem vouchers, for example, digitally or in person.

The internet giants are, of course, expanding their SoLoMo propositions to cover more of the wheel of commerce. Amazon, for example, is pursuing this market through its Amazon Local service, which emails offers from local merchants to consumers in specific geographic areas. Google is combining its Search, Maps, Places, Offers and Wallet services into a local commerce platform for merchants and consumers. But global Internet companies based on economies of scale can find it hard to develop commerce services that take into the account the vagaries of local markets.

There is much at stake: Merchants and brands spend hundreds of billions of dollars across the various elements of the wheel of commerce. In the U.S., the direct marketing market alone is worth US$ 139 billion (more than three times the U.S. online advertising market, according to some estimates (see Figure 4).

Figure 4: A breakdown of the U.S. direct marketing and advertising market

Digital Commerce 2.0 US Direct Marketing and Advertising Market

Source: STL Partners

Another way to view the strategic opportunity is to consider the vast amount of money that is still spent on paper-based marketing in local commerce – householders still receive large numbers of flyers through their door, advertising local businesses. Moreover, many merchants still operate crude loyalty schemes that involve stamping a paper card.

Closing the loop: The importance of payments

One of the most important battlegrounds for the big five is the transact segment of the wheel of commerce. Although this segment is only half the size of the promote segment in terms of revenues, according to STL’s estimates (see Figure 5), it is strategically important. Merchants and brands want to know whether a specific marketing activity actually led to a sale. By bridging the online and offline worlds, mobile technologies can close that loop. If a consumer uses their smartphone to research a product and then pay at point of sale, the retailer can see exactly what kind of marketing results in transactions.

Note that payments itself is a low margin business – American Express estimates that merchants in the U.S. spend four to five times as much on marketing activities, such as loyalty programmes and offers, as they do on payments. But Google and Facebook, as leading marketing and advertising brokers, and some telcos, are moving into the payments space to provide merchants with visibility across the whole wheel of commerce.

In general their approach is to roll out digital wallets that can be used to complete both online transactions and point of sale transactions (either using a contactless technology, such as NFC, or a mobile network-based solution). The term digital wallet or mobile wallet generally refers to an application that can store debit and credit card information, loyalty points, electronic vouchers and value. A digital wallet can reside in the cloud or on a specific device or a combination of the two. The big five each have their own digital wallet.

Although Apple and Facebook have only enabled the use of their wallets within their online walled gardens, they are both gradually extending their transact propositions into bricks and mortar commerce.

Figure 5: The relative size of the segments of the wheel of commerce

Digital Commerce 2.0: Segments and Sizes

Source: STL Partners research drawing on WPP and American Express data

Digital wallets could be the key to unlock a broader and much more lucrative digital commerce proposition. Instead of asking merchants to pay per click, a digital commerce broker could ask them to pay per transaction – a no-risk and, therefore, very attractive proposition for the merchant.

Typically designed to support approximately half of the wheel of commerce (the promote, guide and transact segments), the digital wallet is widely-regarded as an important strategic platform. The theory is that digital wallet suppliers will be well-positioned to interact with consumers while they are shopping, brokering targeted offers and promotions.

Three of the big five – PayPal, Amazon and Apple – have each already signed up tens of millions of users for their online wallets, primarily because they reduce the number of keystrokes and clicks required to complete a transaction online. These Internet players are now weighing up how best to deploy these wallets at point of sale in physical stores. The leading online digital wallet, PayPal, faces increasing competition from leading players in the financial services industry, including Amex and MasterCard (see Figure 6), as well as innovative start-ups, such as Square.

Each of these players is taking a different approach, using different technologies to enabling transactions in store. They are also having to compete with other wallets from companies outside the financial services sector, such as Google, telcos and even retailers.

Figure 6: Examples of financial services-led digital wallets

Digital Commerce 2.0: Financial Services Wallet Examples

Source: STL Partners

In the transact segment, Google, the leading broker of search-related advertising, is scrambling to catch up, rolling out Google Wallet both to compete with PayPal online and enable payments at point of sale using Near Field Communications (NFC) technology. But the software has been through several iterations without gaining significant traction. At the same time, telcos, such as AT&T, Verizon and T-Mobile in the U.S. (the partners in the Isis mobile commerce joint venture), are developing mobile-centric wallets that use NFC to enable payments at point of sale, supported by the SIM card for authentication. Major retailers are also rolling out digital wallets either individually or as part of a consortium. Figure 7 compares three of the mobile-centric wallets available in the U.S. market.

Figure 7: Examples of Mobile-centric wallets in the U.S.

Digital Commerce 2.0: Mobile Centric Wallets

Source: STL Partners

Contents

  • Executive Summary
  • Introduction: Digital commerce disruption
  • Closing the loop: The importance of payments
  • Internet players’ mobile commerce strategies
  • Amazon – impressive interconnected flywheels
  • Apple – slowly assembling the pieces
  • eBay and PayPal – trying to get mobile
  • Facebook – the rising star of mobile commerce
  • Google – try, try and try again in transactions
  • Conclusions
  • Mobile commerce is still up for grabs
  • Competition from telcos and banks
  • Areas of vulnerability


  • Figure 1: The mobile commerce strengths and weaknesses of the Internet players
  • Figure 2: The unfulfilled gap in the digital commerce market
  • Figure 3: The elements that make up the wheel of commerce
  • Figure 4: A breakdown of the U.S. direct marketing and advertising market
  • Figure 5: The relative size of the segments of the wheel of commerce
  • Figure 6: Examples of financial services-led digital wallets
  • Figure 7: Examples of Mobile-centric wallets in the U.S.
  • Figure 8: Google’s big lead in mobile Internet ad spending
  • Figure 9: Google handles one third of all digital advertising
  • Figure 10: The mobile commerce strategy of leading Internet players
  • Figure 11: How the fundamental Amazon flywheel increases working capital
  • Figure 12: How the Amazon Payments flywheel has evolved
  • Figure 13: Deals on display in the Amazon Local app
  • Figure 14: Apple’s Passbook app stores vouchers and loyalty cards
  • Figure 15: Facebook’s daily active users continue to grow
  • Figure 16: Facebook’s mobile daily active users
  • Figure 17: How consumers can redeem a Google Offer
  • Figure 18: Who is best placed to win in facilitating local commerce?
  • Figure 19: Google Wallet no longer needs to work directly with banks
  • Figure 20: The mobile commerce strengths and weaknesses of the Internet players
  • Figure 21: The unfulfilled gap in the digital commerce market
  • Figure 22: Internet giants and start-ups best placed to be infomediaries
  • Figure 23: How Telefónica compares with leading Internet players


Digital Commerce 2.0: New $50bn Disruptive Opportunities for Telcos, Banks and Technology Players

Introduction – Digital Commerce 2.0

Digital commerce is centred on the better use of the vast amounts of data created and captured in the digital world. Businesses want to use this data to make better strategic and operational decisions, and to trade more efficiently and effectively, while consumers want more convenience, better service, greater value and personalised offerings. To address these needs, Internet and technology players, payment networks, banks and telcos are vying to become digital commerce intermediaries and win a share of the tens of billions of dollars that merchants and brands spend finding and serving customers.

Mobile commerce is frequently considered in isolation from other aspects of digital commerce, yet it should be seen as a springboard to a wider digital commerce proposition based on an enduring and trusted relationship with consumers. Moreover, there are major potential benefits to giving individuals direct control over the vast amount of personal data their smartphones are generating.

We have been developing strategies in these fields for a number of years, including our engagement with the World Economic Forum’s (WEF) Rethinking Personal Data project, and ongoing research into user data and privacy, digital money and payments, and digital advertising and marketing.

This report brings all of these themes together and is the first comprehensive strategic playbook on how smartphones and authenticated personal data can be combined to deliver a compelling digital commerce proposition for both merchants and consumers. It will save customers valuable time, effort and money by providing a fast-track to developing and / or benchmarking a leading edge strategy and approach in the fast-evolving new world of digital commerce.

Benefits of the Report to Telcos, Other Players, Investors and Merchants


For telcos, this strategy report:

  • Shows how to evaluate and implement a comprehensive and successful digital commerce strategy worth up to c.$50bn (5% of core revenues in 5 years)
  • Saves time and money by providing a fast-track for decision making and an outline business case
  • Rapidly challenges / validates existing strategy and services against relevant ‘best in class’, including their peers, ‘OTT players’ and other leading edge players.


For other players including Internet companies, technology vendors, banks and payment networks:

  • The report provides independent market insight on how telcos and other players will be seeking to generate $ multi-billion revenues from digital commerce
  • As a potential partner, the report will provide a fast-track to guide product and business development decisions to meet the needs of telcos (and others) that will need to make commensurate investment in technologies and partnerships to achieve their value creation goals
  • As a potential competitor, the report will save time and improve the quality of competitor insight by giving a detailed and independent picture of the rationale and strategic approach you and your competitors will need to take


For merchants building digital commerce strategies, it will:


  • Help to improve revenue outlook, return on investment and shareholder value by improving the quality of insight to strategic decisions, opportunities and threats lying ahead in digital commerce
  • Save vital time and effort by accelerating internal decision making and speed to market


For investors, it will:

  • Improve investment decisions and strategies returning shareholder value by improving the quality of insight on the outlook of telcos and other digital commerce players
  • Save vital time and effort by accelerating decision making and investment decisions
  • Help them better understand and evaluate the needs, goals and key strategies of key telcos and their partners / competitors

Digital Commerce 2.0: Report Content Summary

  • Executive Summary. (9 pages outlining the opportunity and key strategic options)
  • Strategy. The shape and scope of the opportunities, the convergence of personal data, mobile, digital payments and advertising, and personal cloud. The importance of giving consumers control. and the nature of the opportunity, including Amazon and Vodafone case studies.
  • The Marketplace. Cultural, commercial and regulatory factors, and strategies of the market leading players. Further analysis of Google, Facebook, Apple, eBay and PayPal, telco and financial services market plays.
  • The Value Proposition. How to build attractive customer propositions in mobile commerce and personal cloud. Solutions for banked and unbanked markets, including how to address consumers and merchants.
  • The Internal Value Network. The need for change in organisational structure in telcos and banks, including an analysis of Telefonica and Vodafone case studies.
  • The External Value Network. Where to collaborate, partner and compete in the value chain – working with telcos, retailers, banks and payment networks. Building platforms and relationships with Internet players. Case studies include Weve, Isis, and the Merchant Customer Exchange.
  • Technology. Making appropriate use of personal data in different contexts. Tools for merchants and point-of-sale transactions. Building a flexible, user-friendly digital wallet.
  • Finance. Potential revenue streams from mobile commerce, personal cloud, raw big data, professional services, and internal use.
  • Appendix – the cutting edge. An analysis of fourteen best practice and potentially disruptive plays in various areas of the market.


Telco 2.0: Making Money from Location Insights

Preface

The provision of Location Insight Services (LIS) represents a significant opportunity for Telcos to monetise subscriber data assets. This report examines the findings of a survey conducted amongst representatives of key stakeholders within the emerging ecosystem, supplemented by STL Partners’ research and analysis with the objective of determining how operators can release the value from their unique position in the location value chain.

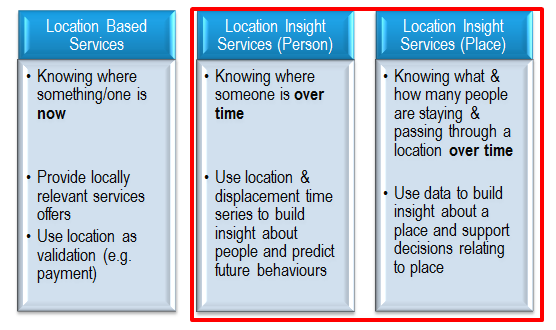
The report concentrates on the Location Insight Services (LIS), which leverage the aggregated and anonymised data asset derived from connected consumers’ mobile location data, as distinct from Location Based Services (LBS), which are dependent on the availability of individual real time data.

The report draws the distinction between Location Insight Services that are Person-centric and those that are Place-centric and assesses the different uses for each data set.

In order to service the demand from specific use cases as diverse as Benchmarking, Transport & Infrastructure Planning, Site Selection and Advertising Evaluation, operators face a choice between fulfilling the role of Data Supplier, providing the market with Raw Big Data or offering Professional Services, adding value through a combination of location insight reports and interpretation consultancy.

The report concludes with a comparative evaluation of options for operators in the provision of LIS services and a series of recommendations for operators to enable them to release the value in Location Insight Services.

Location data – untapped oil

The ubiquity of mobile devices has led to an explosion in the amount of location-specific data available and the market has been quick to capitalise on the opportunity by developing a range of Location-Based Services offering consumers content (in the form of information, promotional offers and advertising). Industry analysts predict that this market sector is already worth nearly $10 billion.

The vast majority of these Location Based Services (LBS) are dependent on the availability of real time data, on the reasonable assumption that knowing an individual’s location enables a company to make an offer that is more relevant, there and then.  But within the mobile operator community, there is a growing conviction that a wider opportunity exists in deriving Location Insight Services (LIS) from connected consumers’ mobile location data. This opportunity does not necessarily require real time data (see Figure 9). The underlying premise is that identification of repetitive patterns in location activity over time not only enables a much deeper understanding of the consumer in terms of behaviour and motivation, but also builds a clearer picture of the visitor profile of the location itself.

Figure 1:  Focus of this study is on Location Insight Services
Focus of this Study on Location Insight Services

  • As part of our Telco 2.0 Initiative, we have surveyed a number of companies from within the evolving location ecosystem to assess the potential value of operator subscriber data assets in the provision of Location Insight Services. This report examines the findings and illustrates how operators can release the value from their unique position in the location value chain.

Location Insight Services is a fast growing, high value opportunity

The demand is “Where”?

For operators to invest in the technology and resources required to enter this market, a compelling business case is required. Firstly, various analysts have confirmed that there is a massive latent demand for location-centric information within the business community to enable the delivery of location-specific products and services that are context-relevant to the consumer. According to the Economist Business Unit, there is a consensus amongst marketers that location information is an important element in developing marketing strategy, even for those companies where data on customer and prospect location is not currently collected.3

Figure 2: Location is seen as the most valuable information for developing marketing strategy
Location is seen as the most valuable information for developing marketing strategy

Source: Mind the marketing gap – A report from Economist Business Intelligence Unit

Scoping the LIS opportunity by industry and function

In order to understand the market potential for Location Insight Services, we have considered both industry sectors and job functions where insights derived from location data at scale improve business efficiencies. Our research has suggested that Location Insight Services have an application to many organisations that are seeking to address the broader issue of how to extract the benefits concealed within Big Data.

A recent report from Cisco concentrating on how to unlock the value of digital analytics suggested that Big Data has an almost universal application and

“Big Data could help almost any organization run better and more efficiently. A service provider could improve the day-to-day operations of its network. A retailer could create more efficient and lucrative point-of-sale interactions. And virtually any supply chain would run more smoothly. Overall, a common information fabric would improve process efficiency and provide a complete asset view.” 

Our research suggests that the following framework facilitates understanding of the different elements that together comprise the market for non-real time Location Insight Services.

The matrix considers the addressable market by reference to vertical industry sectors and horizontal function or disciplines.

We have rated the opportunities High, Medium and Low based on a high level assessment of the potential for uptake within each defined segment. In order to produce an estimate of the potential market size for non-real time Location Insight Services, STL Partners have taken into account the current revenue estimates for both industry sectors and functions.

Figure 3:  Location Insight Market Overview (telecoms excluded)
Location Insight Services Market Taxonomy

Report Contents

  • Preface
  • Executive Summary
  • Location data – untapped oil
  • Location Insight Services is a fast growing, high value opportunity
  • Scoping the LIS opportunity by industry and function
  • Location Insight Services could be worth $11bn globally by 2016
  • Which use cases will drive uptake of LIS?
  • Use cases – industry-specific illustrations
  • How should Telcos “productise” location insights services?
  • Operators are uniquely placed to deliver location insights and secure a significant share of this opportunity
  • What is the operator LIS value proposition?
  • Location insight represents a Big Data challenge for Telcos.
  • There is a demand for more granular location data
  • Increasing precision commands a premium
  • Meeting LIS requirements – options for operators
  • What steps should operators take?
  • Methodology and reference sources
  • References
  • Appendix 1 – Opportunity Sizing
  • Definition
  • Methodology


  • Figure 1: Focus of this study is on Location Insight Services
  • Figure 2: Location is seen as the most valuable information for developing marketing strategy
  • Figure 3: Location Insight Market Overview (telecoms excluded)
  • Figure 4: The value of Global Location Insight Services by industry and sector (by 2016)
  • Figure 5: How UK retail businesses use location based insights
  • Figure 6: Illustrative use cases within the Location Insights taxonomy
  • Figure 7: How can Telcos create value from customer data?
  • Figure 8: Key considerations for Telco LIS service strategy formulation
  • Figure 9: Real time service vs. Insight
  • Figure 10: The local link in global digital markets
  • Figure 11: Customer Data generated by Telcos
  • Figure 12: Power of insight from combining three key domains
  • Figure 13: Meeting LIS Requirements – Options for Operators

Digital Commerce: Time to redefine the Mobile Wallet

Summary: The ‘Mobile/Digital Wallet’ needs to evolve to support authentication, search and discovery, as well as payments, vouchers, tickets and loyalty programmes. Moreover, consumers will want to be able to tailor the functionality of this “commerce assistant” or “commerce agent” to fit with their own interests and preferences. Key findings and next steps from the Digital Commerce stream of our Silicon Valley 2013 brainstorm. (April 2013, Executive Briefing Service, Dealing with Disruption Stream.)

Who is best placed to win in local commerce April 2013

  Read in Full (Members only)   To Subscribe click here

Below are the high-level analysis and detailed contents from a 35 page Telco 2.0 Briefing Report that can be downloaded in full in PDF format by members of the Telco 2.0 Executive Briefing service and the Dealing with Disruption Stream  here. Digital Commerce strategies and the findings of this report will also be explored in depth at the EMEA Executive Brainstorm in London, 5-6 June, 2013. Non-members can find out more about subscribing here, or to find out more about this and/or the brainstorm by emailing contact@telco2.net or calling +44 (0) 207 247 5003.

To share this article easily, please click:


Introduction

Part of the New Digital Economics Executive Brainstorm 2013 series, the Digital Commerce 2.0 event took place at the InterContinental Hotel, San Francisco on the 20th March and looked at how to get the mobile commerce flywheel moving, how to digitise local commerce, how to improve digital advertising and how to effectively leverage customer data and personal data. The Brainstorm considered how to harness telco assets and capabilities, as well as those of banks and payment networks, to deliver Digital Commerce 2.0.

Analysis: Time to redefine the wallet?

The Executive Brainstorm uncovered widespread confusion and dissatisfaction with the concept of a digital or mobile wallet. Some executives feel that a wallet, with its connotations of a highly personal item that is controlled entirely by the consumer and used primarily for transactions, may be the wrong term. There is a view that the concept of a digital wallet may have to evolve into a more multi-faceted application that supports authentication, search and discovery, as well as payments, vouchers, tickets and loyalty programmes.

Moreover, consumers will likely want to be able to tailor the functionality of this “commerce assistant” or “commerce agent” to fit with their own interests and preferences, rather than having to use an inflexible off-the-shelf application. This gateway application may also act as a personal cloud/locker service, providing access to the individual’s media and content, as well as enabling them to control their privacy settings. In other words, ultimately, consumers may want an assistant or agent that amalgamates the personalised discovery services offered by apps, such as Google Now, online media services, such as iCloud, and the traditional functions of a wallet, such as payments, receipts, coupons and loyalty programmes.

Business model battles

The Brainstorm confirmed that the digital commerce market continues to be held back by the slow and familiar dance between the established interests of banks/payment networks, telcos, and retailers. Designing business models that sufficiently incentivise each partner is tough: big retailers, for example, are likely to resist digital commerce solutions that don’t address their dissatisfaction about transaction fees – there was some excitement about digital commerce solutions that workaround the major payment networks’ interchange systems.

Some of the participants in the Brainstorm held strongly entrenched views about which players can contribute to growth in digital commerce and should therefore benefit most from that growth. The arguments boiled down to:

  • The banking ecosystem believes it is well placed because of the requirement for transactions to be processed by entities with banking licenses and that comply with know your customer (KYC) regulations.
  • Telcos believe that, as digital commerce-related data travels over their networks, they will understand the market better than other players.
  • Retailers believe that they have the customer relationships and that digital commerce offers opportunities to strengthen those relationships and reduce the costs of transactions.

The length and complexity of the digital commerce value chain raises significant questions about whether one entity could and should own the customer relationship and manage customer care across the whole experience. Moreover, there may be a disconnect between elements of the value chain and the overall value proposition. For example, individual retailers may wish to offer fully-customised digital commerce experiences delivered through their own branded apps, but consumers may not want to see the complexity of the existing marketplace, in which they are asked to register and carry multiple loyalty cards, continue in an increasingly digitised world.

While the traditional players jostle for the best positions in the value chain, the door is wide open for market entrants to come with radically disruptive business models. Although telcos have the customer data to be play a pivotal role in digital commerce, other players will work around them unless telcos are prepared to move quickly and partner on equitable terms. In many cases, telcos (and other would-be digital commerce) brokers may have to compromise on margins to seed the market and ultimately gain scale – small merchants (the long tail), which have highly inefficient marketing today, have a greater incentive than large retailers to adopt such solutions. Participants in the Silicon Valley Brainstorm thought that either established Internet players or a start up would ultimately win over the banks and telcos in local commerce.

Who is best placed to win in local commerce April 2013

Consumers are most likely to adopt digital commerce services that offer convenience and breadth. Therefore, such services need to act as open and flexible brokers, which enable a wide range of merchants to use application programming interfaces (APIs) to plug in vouchers and loyalty schemes quickly and easily.

Mobile advertising – still very immature

Immature and messy, the mobile advertising market is still a long way from being as structured as, for instance, television advertising, in terms of standardising metrics for buyers and creating an efficient procurement process. The Brainstorm highlighted the profusion of different technologies and platforms that is making the mobile advertising market highly-fragmented and very resource-intensive for media buyers. In many cases, the advertising industry may be struggling to differentiate between mobile networks, mobile users and mobile devices. For example, a consumer using a tablet on a sofa may be seeing the same adverts as a smartphone user travelling to work on a train.

In essence, the creatives working in advertising agencies are not certain what messages and formats work on a mobile screen, as buyers don’t have reliable ROI data and the advertising networks continue to struggle to deliver precise targeting, stymied by multiple barriers, such as privacy fears, walled gardens and bandwidth constraints. As a result, there is widespread dissatisfaction among both media buyers and consumers with mobile advertising. The mobile advertising market needs robust tools and processes – standardised, proven formats and reliable, trusted metrics – to will enable brands to purchase advertising at scale and with confidence.

Some media buyers are looking for solutions that make the delivery of digital advertising more transparent to consumers, so they have a clearer understanding of why they are seeing a particular advert.

To address these issues, telcos, looking to broker advertising, need to create better platforms that are easy for media buyers to access, offer precise targeting and provide transparent metrics that are straightforward to monitor. Despite the formation of telco marketing and advertising joint ventures in some markets, such as the U.K., some advertising executives believe telcos don’t see a big enough revenue opportunity to build these platforms.

Instead of brand building and customer acquisition, which is the traditional use of mass advertising, it seems likely that the mobile channel will be used primarily for customer loyalty and retention. So-called active advertising (advertising that is designed to enable the individual to complete a specific task) may be well suited to mobile devices, which people typically use to get something done. As attention spans are short and screen space is limited in the mobile medium, the advertising value chain will need to change its mindset to put the needs of the consumer, rather than the brand, front and centre.

Big data – how to monetize?

The Brainstorm reinforced the sense that big data/personal data has the potential to create exceptional insights and disruptive new business models. But most people working in this space only have a high-level, theoretical view of how this might happen, rather than a collection of compelling case studies and use cases. Finding big data projects offering a respectable return on investment is going to be a hit and miss affair, requiring an open mind and the patience to experiment.

Although self-authenticated data could potentially make advertising and marketing more efficient, it may also increase transparency for consumers: The Internet has given consumers more control and is driving deflation in many sectors. The rise of personal data could have negative implications for companies’ profit margins as consumers use vendor relationship management systems to systematically secure the best price.

Many start-ups seem to still be pursuing advertising-funded business models, but big data and personal data business models may depend on a different approach. They should be asking: “How do you fund a search engine that is not ad-funded and can social networks not be ad-funded?” Computational contracts, which machines can execute and people can actually understand, could be part of the answer. Rather than trying to infer interests and movements, a social network might explicitly ask the following question. “If you give me your location and the brands you like, I’ll give you two coupons a day.” This is basically the Placecast model, which seems to be gaining traction in some markets. In any case, telcos and banks could and should use transparent and user-friendly privacy policies as a competitive weapon against Facebook and Google, which currently dominate the online advertising market.

The concept of companies interacting with individuals through the web presence of their objects, such as their car, their bike or their pet, seems sound. Both individuals and companies could benefit from a two-way flow of information around these objects. For example, a consumer with a specific make of printer or camera could benefit from personalised and timely discounts on accessories, such as cartridges and lenses.

Next steps for STL Partners

We will:

  • Continue to research and explore ‘Digital Commerce’ at our Executive Brainstorms, with particular emphasis on practical steps to create the Digital Wallet, enable ‘SoMoLo’, and the key role of personal data and trust frameworks;
  • Look further into the needs and applications of ‘Big Data’ into the field, as well as continuing our involvement in the World Economic Forum’s (WEF) work on Trust Networks for personal data;
  • Publish further research on the business case for personal data, and a full Strategy Report on the Digital Commerce area.


To read the note in full, including the following sections detailing additional analysis…

  • Closing the loop between advertising and payments
  • First stimulus presentation
  • Second stimulus presentation
  • Innovation showcase
  • Brainstorm
  • Key takeaways
  • Advertising & Marketing: Radical Game Change Ahead
  • First and Second stimulus presentations
  • Final stimulus presentation
  • Brainstorm
  • Key takeaways
  • Session 3: Big Data – Exploiting the New Oil for the New Economy
  • Stimulus Speakers and Panellists
  • Stimulus presentations
  • Voting, feedback, discussions
  • Key takeaways

…and the following figures…

  • Figure 1 – Customer Data is at the centre of Digital Commerce
  • Figure 2 – What will North American consumers value most from digital commerce?
  • Figure 3- Leading players’ strengths and weaknesses upstream and downstream
  • Figure 4 – The key elements of the digital commerce flywheel
  • Figure 5 – Vast majority of commerce is still offline
  • Figure 6 – Linking location-based offers to payment cards
  • Figure 7 – Participants’ views on likely winners in ‘local’ digital commerce
  • Figure 8 – Mobile ad spend doesn’t reflect the time people spend in this medium
  • Figure 9 – What does the advertising industry need to do to stay relevant?
  • Figure 10 – Why personal data isn’t like oil
  • Figure 11 – A strawman process for personal data
  • Figure 12 – A decentralised architecture for the Internet of My Things
  • Figure 13 – Kynetx: companies can connect through ‘things’

Members of the Telco 2.0 Executive Briefing Subscription Service and the Dealing with Disruption Stream can download the full 35 page report in PDF format here. Non-Members, please subscribe here. Digital Commerce strategies and the findings of this report will also be explored in depth at the EMEA Executive Brainstorm in London, 5-6 June, 2013. For this or any other enquiries, please email contact@telco2.net / call +44 (0) 207 247 5003.

Background & Further Information

Produced and facilitated by business innovation firm STL Partners, the Silicon Valley 2013 event brought together 150 specially-invited senior executives from across the communications, media, retail, banking and technology sectors, including:

  • Apigee, Arete Research, AT&T,ATG, Bain & Co, Beecham Research, Blend Digital Group, Bloomberg, Blumberg Capital, BMW, Brandforce, Buongiorno, Cablelabs, CenturyLink, Cisco, CITI Group, Concours Ventures, Cordys, Cox Communications, Cox Mobile, CSG International, Cycle Gear, Discovery, DoSomething.Org, Electronic Transactions Association, EMC Corporation, Epic, Ericsson, Experian, Fraun Hofer USA, GE, GI Partners, Group M, GSMA, Hawaiian Telecom, Huge Inc, IBM, ILS Technology, IMI Mobile Europe, Insight Enterprises, Intel, Ketchum Digital, Kore Telematics, Kynetx, MADE Holdings, MAGNA Global, Merchant Advisory Group, Message Systems, Microsoft, Milestone Group, Mimecast, MIT Media Lab, Motorola, MTV, Nagra, Nokia, Oracle, Orange, Panasonic, Placecast, Qualcomm, Rainmaker Capital, ReinCloud, Reputation.com, SalesForce, Samsung, SAP, Sasktel, Searls Group, Sesame Communications, SK Telecom Americas, Sprint, Steadfast Financial, STL Partners/Telco 2.0, SystemicLogic Ltd., Telephone & Data Systems, Telus, The Weather Channel, TheFind Inc, T-Mobile USA, Trujillo Group LLC, UnboundID, University of California Davis, US Cellular Corp, USC Entertainment Technology Center, Verizon, Virtustream, Visa, Vodafone, Wavefront, WindRiver, Xtreme Labs.

Around 40 of these executives participated in the ‘Digital Commerce’ session.

The Brainstorm used STL’s unique ‘Mindshare’ interactive format, including cutting-edge new research, case studies, use cases and a showcase of innovators, structured small group discussion on round-tables, panel debates and instant voting using on-site collaborative technology.

We’d like to thank the sponsors of the Brainstorm:
Silicon Valley 2013 Sponsors

The Great Compression: surviving the ‘Digital Hunger Gap’

Introduction

The Silicon Valley Brainstorm took place on 19-20 March 2013, at the Intercontinental Hotel, San Francisco.

Part of the New Digital Economics Executive Brainstorm & Innovation Series, it built on output from previous events in Singapore, Dubai, London and New York, and new market research and analysis, and focused on new business models and growth opportunities in digital commerce, content and the Internet of Things.

Summary Analysis: ‘The Great Compression’

In the next 10 years, many industries face the ‘Great Compression’ in which, in addition to the pressures of ongoing global economic uncertainty, there is also a major digital transformation that is destroying traditional value and moving it ‘disruptively’ to new areas and geographies, albeit at diminished levels.

In previous analyses (e.g. Dealing with the ‘Disruptors’: Google, Apple, Facebook, Microsoft/Skype and Amazon) we have shown how key technology players in particular compete with different objectives in different parts of the digital value chain. Figure 1 below shows via crossed dollar signs (‘New Non-Profit’) the areas in which companies are competing without the primary intention of driving profits, which means that traditional competitors in those areas can expect ‘disruptive’ competition from new business models.

Figure 1 – Digital disruption
Digital disruption occurring in many industries Mar 2013

Source: STL Partners ‘Dealing with the ‘Disruptors’: Google, Apple, Facebook, Microsoft/Skype and Amazon’


The Digital Hunger Gap

For the incumbent industry players we call the near-term results of this disruption ‘The Digital Hunger Gap’ – the widening deficit between past and projected revenues. Chris Barraclough, Chief Strategist STL Partners presented the classic Music Industry case study of the ‘Hunger Gap’ effects of digital disruption.

Figure 2 – The Music Industry’s ‘Hunger Gap’
The Music Industry's ‘Hunger Gap’ Mar 2013

Source: STL Partners


In a vote, 95% of participants agreed that something similar would happen in other industries.

Chris then presented our initial analysis of the ‘Hunger Gap’ for telcos (to be published in full shortly), and asked the participants where they thought the telco industry would be relative to its 2012 position in 2020.

Figure 3 – Participants’ views on forecasts for the telecoms industry
Participants' views on forecasts for the telecoms industry Mar 2013

Source: Silicon Valley 2013 Participants / STL Partners


As can be seen, participants’ views were widely spread, with a slight bias towards a more pessimistic outlook than that presented of a recovery to 2012 levels.

Chris argued that as the ‘hunger gap’ widens, and before new revenues are developed, there will be massive consolidation and cost-reduction among incumbent players, and opportunities for innovation in services, but the chances of success in the latter are very low and require a portfolio approach and either deep pockets, exceptional insight, or considerable good fortune.

Richard Kramer, Managing Partner of Arete Research, also presented a deflationary outlook for all but the leading consumer technology players in the handset and tablet arena.

Participants then voted on which areas needed the most significant changes in their business – and existing managements’ ‘mindset’ was voted as the top priority.

Figure 4 – ‘Mindset’ is the biggest barrier to transformation
'Mindset' is the biggest barrier to transformation Mar 2013

Source: Silicon Valley 2013 Participants / STL Partners


It is also notable that all categories averaged 3.0 or over – or needing ‘Significant Change’. This points to a significant transformation across all industries.

Content:

  • Opportunities
  • Telco 2.0 Strategies
  • Big Data and Personal Data
  • Digital Commerce
  • Digital Entertainment
  • Mobile Advertising & Marketing
  • The Internet of Things
  • Outlook by Industry
  • Next Steps


  • Figure 1 – Digital disruption
  • Figure 2 – The Music Industry’s ‘Hunger Gap’
  • Figure 3 – Participants’ views on forecasts for the telecoms industry
  • Figure 4 – ‘Mindset’ is the biggest barrier to transformation
  • Figure 5 – The ‘Telco 2.0’ opportunities for CSPs
  • Figure 6 – The impact of ‘Software Defined Networks’ (SDN)
  • Figure 7 – Will ‘Personal Data’ be more useful than ‘Big Data’?
  • Figure 8 – STL Partners’ ‘Wheel of Digital Commerce’
  • Figure 9 – Who will in ‘SoMoLo’?
  • Figure 10 – Significant changes in viewing habits
  • Figure 11 – Transformation needed in the advertising industry
  • Figure 12 – Growth projections for M2M ‘mobile’ (e.g. 3G/4G) connected devices

Europe’s brutal future: Vodafone and Telefonica hit hard

Introduction


Even in the UK and Germany, the markets with the brightest future, STL Partners forecasts a respective 19% and 20% decline in mobile core services (voice, messaging and data) revenues by 2020. The UK has less far to fall simply because the market has already contracted over the last 2-3 years whereas the German market has continued to grow.

We forecast a decline of 34% in France over the same period.

In Italy and, in particular, Spain we forecast a brutal decline of 47% and 61% respectively. Overall, STL Partners anticipates a reduction of 36% or €30 billion in core mobile service revenues by 2020. This equates to around €50 billion for Europe as a whole.


Like the medical profession, we don’t always like being correct when our diagnoses are pessimistic. So it is with some regret that we note that our forecasts are being borne out by the latest reports from southern Europe. Vodafone has been forced into a loss for H1 2012, after it wrote down the value of its Spanish and Italian OpCos by £5.9bn. Here’s why:

eurobloodbath.png

The writedown is of course non-cash, and those of us who remember Chris Gent’s Vodafone will be familiar with the sensation. But the reasons for it could not be more real. Service revenue has fallen sickeningly, down 7.9% across Europe, 1.4% across the group.

Vodafone has enjoyed a decent performance from the company’s assets in Africa, Asia, Turkey, and the Pacific, and a hefty dividend from Verizon Wireless. It is the performance in Europe which is dreadful and the situation in southern Europe especially bad.

For while service revenue in Gernany was up 1.8%, it was down a staggering 12.8% in both Spain and Italy. And margins were sacrificed for volume; EBITDA was down 16.6% in Italy, and 13.8% in “Other Southern Europe”, that is to say mostly Greece and Portugal. Even the UK saw service revenues fall -2.1%, while the Netherlands was down -1.9%. Vodafone’s investments across Europe seem to have landed in an arc of austerity running from the Norwegian Sea to the Aegean, the long way around.

Vodafone’s enterprise line of business has helped the Italian division defy gravity for a while. Until recently, OneNet was racking up the same 6% growth rates in Italy that it saw in Germany and contributing substantially to service revenue, even though the wider business was shrinking. In Q2, service revenue in Italy was down 4.1% but enterprise was up 5.8%.

But strategy inevitably beats tactics. Tellingly, the half-year statement from Vodafone management went a little coy about enterprise’s performance. Numbers are only given for Germany and Turkey, and for group-wide One Net seats. They are good, but you wonder about the numbers that aren’t given. We are told that One Net is “performing well” in Italy, but that’s not a number.

Meanwhile, Telefonica saw its European revenues fall 6.4% year-on-year. The problem is in Spain, where the plummet was 12.9%. Mobile was worse still, with revenues thumped downwards by 16.2%.

The damage, for both carriers, is concentrated in mobility, in southern Europe, and in voice and messaging. Telefonica blames termination rate cuts (as does Vodafone – both carriers are big enough that they tend to terminate more calls from other carriers than they pay out on), but this isn’t really going to wash. As Vodafone’s own statement makes clear, MTRs are coming down everywhere. And Telefonica’s wireline revenues were horrible, too, down 9.6%.

But the biggest hit to revenue for Vodafone was in messaging, and then in voice. Data revenue is growing. In the half to 30th September 2011, Vodafone.es subscribers generated £156 million in messaging revenues. In the corresponding half this year, it was £99 million. Part of this is accounted for by movement in the euro-sterling exchange rate, so Vodafone reports it as a 30% hit to messaging and a 20% hit to voice. Italy saw an 11.4% hit to messaging and a 16% hit to voice. The upshot to Vodafone is a 29.7% cut to the division’s operating profits. Brutal indeed.

Obviously, a lot of this is being driven by the European economic crisis. It is more than telling that Vodafone’s German and Turkish operations are powering ahead, while it’s not just the Mediterranean economies under the European Union’s “troika” management (EC, ECB and IMF) that are suffering. The UK, under its own voluntary austerity plan, was down 2.1% for Telefonica, and the Netherlands, having gone from being the keenest pupil in the class to another austerity case in the space of one unexpectedly bad budget, is off 1.9%. Even if you file Turkey under “emerging market”, the comparison between the Mediterranean disaster area, the OK-ish position in North-Western Europe, and the impressive (£2.4bn) dividend from Verizon Wireless in the States is compelling.

But disruption is a fact. We should not expect that things will snap back as soon as the macro-economy takes a turn for the better. One of the reasons for our grim prediction was that as well as weak economies, the Southern European markets exhibited surprisingly high prices for mobile service.

The impact of the crisis is likely to permanently reset customer behaviour, technology adoption, and price expectations. The Southern price premium is likely to be permanently eroded, whether by price war or by regulatory action. Customers are observably changing their behaviour in order to counter-optimise the carriers’ tariff plans.

Vodafone observes plummeting messaging revenues, poor voice revenues, and heavy customer retention spending, specifically on handset subsidies for smartphones. In fact, Vodafone admits that it has tried to phase out subsidy in Spain and been forced to turn back. This suggests that customers are becoming very much more aware of the high margin on SMS, are rationing it, and are deliberately pressing for any kind of smartphone in order to make use of alternatives to SMS. Once they are hooked on WhatsApp, they are unlikely to go back to carrier messaging if the economy looks up.

Another customer optimisation Vodafone encounters is that the customers love their integrated fixed/mobile plan. Unfortunately, this may mean they are shifting data traffic off the cellular network in the home-zone and onto WLAN. Further, as Vodafone is a DSL unbundler, the margin consequences of moving revenue this way may not be so great. In Italy, although the integrated tariffs sold well, a “fall in the non-ULL customer base” is blamed for a 5.6% drop in fixed service revenue. Are the customers fleeing the reseller lines because Vodafone can’t match TI or Fastweb’s pricing, or is it that the regulatory position means margins on unbundled lines are worse?

Vodafone’s response to all this is its RED tariff plan. This essentially represents a Telco 2.0 Happy Pipe strategy, providing unlimited voice and messaging in order to slow down the adoption of alternative communications, and setting data bundles at levels intended to be above the expected monthly usage, so the subscribers feel able to use them, but not far enough above it that the bandwidth-hog psychology takes hold.

vf-red.png

With regard to devices, RED offers three options with tiered pricing: SIM only, basic smartphone, and iPhone. The idea is to make the subsidy costs more evident to the customer, to slow up the replacement cycle on flagship smartphones via SIM-only, and to channel the smartphone hunters into the cheaper devices. Overall, the point is to drive data and smartphone adoption down the diffusion curve, so as to help the transition from a metered voice-centric to a data-centric business model.

The CEO, Vittorio Colao, says as much:

The reason why the whole industry is on a difficult trend…is because we historically voice priced really high and data priced really low.

Vodafone’s competitors face a serious challenge. They are typically still very dependent on prepaid voice minutes, a market which is suffering. Even in Northern Europe, it’s off 10%. Telcos loved PAYG because everything in it is incremental. Now, the challenge is how to create a RED-like tariff for the PAYG market.

Euro Voice Brutal Image 2 Chart Euro 5 Oct 2012.png

Those in North and South America, MENA and Asia-Pacific may be looking at Europe and breathing a sigh of relief. But don’t fool yourself. SMS revenues in the US are down for the first time driven by volume and price declines. One rather worrying outcome of last week’s Digital Arabia event was that operators in the region seem to be under the impression that the decline for them is still several years out and destined to be a relatively gentle softening of the market. There’s more here on our initial take on what they need to do to avoid complacency and start to build new business models more quickly.

European Mobile: The Future’s not Bright, it’s Brutal

Summary findings and implications

Dark skies ahead

The mobile telecoms sector has performed quite strongly through the economic downturn but STL Partners’ forecast for UK, France, Germany, Spain and Italy suggests that the outlook is extremely bleak:

  • Even in the UK and Germany, the markets with the brightest future, STL Partners forecasts a respective 19% and 20% decline in mobile core services (voice, messaging and data) revenues by 2020. The UK has less far to fall simply because the market has already contracted over the last 2-3 years whereas the German market has continued to grow.
  • We forecast a decline of 34% in France over the same period.
  • In Italy and, in particular, Spain we forecast a brutal declines of 47% and 61% respectively.
  • Overall, STL Partners anticipates a reduction of 36% or €30 billion in core mobile service revenues by 2020. This equates to around €50 billion for Europe as a whole.

Figure 1: Mobile core Service revenues

European Mobile Core Services Revenue Forecast Chart, Oct 2012, Telco 2.0

Source: European regulators, Mobile operators, Barclays Capital, STL Partners assumptions and analysis

  • Even if our forecasts prove to be too pessimistic – and we have sought to be realistic rather than unduly negative and have built our models bottom up looking at pricing and volume trends wherever possible – the future looks much worse than other analysts and industry observers are currently forecasting. For example, a recent report by Arthur D Little and Exane BNP Paribas forecasts a 2.3% per annum decline in mobile to 2015 compared with our forecast of 4.3% per annum decline over the same period.
  • Data growth, service bundling, customer experience improvements and cost-cutting activities are valuable but fall way short of offsetting declines in voice and messaging. The game for mobile operators in Europe is changing forever: as things stand, in a few short years they will be forced to become very much more conservative businesses – more like gas and water companies. Interestingly, the capital markets already rate telecoms companies as utilities judging by their lofty dividend yields.
  • There will be casualties. Several operators will not exist in their current form by 2020. Despite the desire of regulators to have four or five network operators in their countries to encourage competition, the downward revenue pressure will favour scale economies and the pressure for many operators to merge or acquire/be acquired will be overwhelming.

Get your umbrellas ready now

We are starting to see a few European operators invest more actively in building new revenue streams – something that STL Partners has been pushing through its Telco 2.0 initiative for several years. Telefonica with Telefonica Digital, KPN, Orange, Telenor and a handful of other companies are becoming more active in ‘digital services’ and new business models. This activity urgently needs to be accelerated and prioritised if operators stand any chance of replacing the impeding revenue declines.

For future success, operators must embrace Telco 2.0 (and recognise the need for a new business model and new service offerings) whether that is as a lean ‘Telco 2.0 Happy Pipe’ or as a ‘Telco 2.0 Services Provider’. Both of these strategies require business model transformation that encompasses:

  • Major strategic choices and decisions about what the organisation should and should not do;
  • The identification, selection and development of new products and services;
  • More effective processes for bringing newly developed services to market;
  • A realignment of organisation structures to deliver the new services;
  • A redefinition of the way operators work with each other and with external partners to build value;
  • Clarification of how technology should support the Telco 2.0 business model and services;
  • A review of revenue and cost models to maximise value for consumers, partners and telcos themselves;
  • A new relationship with regulators as the industry seeks to redefine its role and value in the digital economy.

STL Partners remains committed to working with TMT players that want to make the changes identified above in three ways:

For more details of how STL Partners can help you, please contact us.

Introduction

The telecoms industry is performing quite well in a tough economic environment

At the moment, the global telecoms industry seems to be in relatively robust health – developing economies are driving subscriber growth, 4G is being rolled out, smartphones are being connected with data plans in huge numbers, service providers are selling bundled “integrated offers” to maintain revenues, and costs are being controlled with network-sharing and other strategies

But there is also a nagging concern held by industry managers and observers that all is not well ‘below the waterline’, especially in mature markets. There have been a few worrying signs from operators losing out on messaging revenues to OTT players like WhatsApp, or suffering outright reductions in revenues and subscriber numbers in markets like Spain. That said, these have been largely ascribed to poor pricing decisions or (hopefully) temporary local macroeconomic problems.

Certainly, the financial markets seem pretty convinced in the operators’ underlying ability to turn consumers’ desire for communication into ARPU. Not only that, but there is broad conviction that growing data revenues should be able to offset – plus or minus a little – slow declines in voice and messaging, especially when it is all wrapped up in a bundle.

The question is whether that assumption is really valid, or whether there are broader structural risks, or even any reality in the dystopian view that revenues could suddenly ‘fall off a cliff’? Looking at the fixed telecom industry, it is notable that voice revenues have undergone a fairly precipitous decline over the past decade, partly because of mobile substitution, partly because of competition and, in some cases such as lucrative international calls, because of competition from Skype and its peers. Meanwhile, adjacent markets such as cable have started to suffer from the popularity of alternative sources of digital TV and content. Some of the fixed operators have picked up the slack with IT services and cloud infrastructure, but others have suffered – often to the extent that they have sold out, typically to their mobile peers.

But how bright is the future really?

Will mobile operators fare any better over the next 5-10 years? In developed markets, they have to contend with market saturation, increasing competition on basic services, and tightening regulatory regimes. They also need to deal with the strategic issue of the internet-based app ecosystems such as Apple’s and Google’s, and OTT-type services from the likes of Facebook and Microsoft/Skype. There is also a possibility that the very nature of ‘core services’ like telephony might change, as voice communications starts to get embedded into apps and the web itself. Some observers even see our 100-year relationship with voice telephony diminishing in importance, as other forms of communication become more useful.

This report looks into the mobile marketplace – specifically, voice and messaging services in the main European countries. We have constructed a “what if?” scenario model, that takes some basic assumptions about voice usage and pricing, along with data revenues trends. Rather than just assuming that ARPU will remain broadly flat and then divide it up between voice and data, we’ve started looking from the bottom up. Can likely declines in voice revenues really be made up elsewhere, especially given the possible collapse of SMS and the commoditisation of mobile data? Just how big might the gap be that needs to be filled with ‘other services’ such as content resale, two-sided capability exposure, M2M, vertical industries or Telco-OTT propositions?

Taking together the five largest European mobile markets – Germany, France, UK, Italy and Spain – paints a picture that should cause some alarm. Despite the rise of smartphones and dongles, overall quarterly mobile revenues are down 10% on their peak from Q3 2009; falling from €24.7bn to €22.2bn in Q1 2012. Even accounting for seasonality, this is significant (a €10bn annualised shortfall) – and early results suggest the fall accelerated in Q2 2012, as economic and competitive factors bit deeper into sales, with recessions in several countries and new entrants such as Free in France.

Worse, if we just look at voice revenues, the market is now down 25% from its peak in Q2 2009, and that fall seems to be accelerating. While declining voice ARPU is not a huge surprise, the failure of other services to take up the slack is disappointing, especially as the source of new business – basic data connectivity – also is the most capex-hungry in terms of extra costs of new spectrum and 3G/4G build-out.

Figure 2: EU5 Mobile Services revenue already down 10% from 2009 peak

EU5 Mobile Services Revenues Chart, Telco 2.0, Oct 2012
Source: STL Partners

A set of cold-blooded forecasts for UK, France, Germany, Italy and Spain

To the best of our knowledge, nobody else has made forecasts that are both dispassionate and founded on hard data and bottom-up analysis.

Too many analyst (and we suspect internal) financial models seem to suggest that ‘It’ll be alright, somehow… telecoms operators need to harvest cash from voice and messaging, grow data and find some new revenues, but there’s plenty of options’. STL Partners is questioning the first and second premises in the statement above – about harvesting voice and messaging and growing broadband data – not because we’re pessimists, but because we think that many in the industry are not acknowledging the scale of the problems ahead and making the necessary (and often uncomfortable) decisions early enough.

Views vary widely on the outlook for mobile telecoms in Europe

It is fair to say that the fixed telecoms industry has undergone enough pain over the last decade to be under no illusions about its challenges. Operators realise that they face a continued hard slog against competition, regulation, content providers and indifferent consumers. They have increasingly focused on businesses, wholesale models and specific high-value niches like fibre-based triple-play. Deployment of FTTC/FTTH has been patchy, as they have realised that political support doesn’t equate to revenue uplift or return on capital.

Conversely, the mobile industry has pinned its hopes on LTE, data services and various collaboration and partnership business models. Some operators have essentially become Apple and Samsung resellers, offering credit-finance for expensive devices in the guise of handset subsidies. Plenty of other ideas, from mobile money to M2M to API exposure have been the subject of huge efforts. As yet, none has really moved the needle compared to the legacy telephony and SMS services that still make up a large (60%+) share of most operators’ top line revenues. The only bright spot has been plain-vanilla Internet access, initially with 3G dongle modems for PCs, and more recently for smartphone data plans. But the former has now gone largely ex-growth (thankfully, in some cases, given the traffic loads generated at low prices). And the latter faces growth challenges once most users have shifted to a smart device, as few users seem incentivised to upgrade to larger data plans so far.

Privately held view seems to be pessimistic…

In private discussions with operator executives, we encounter a fair level of pessimism, especially about voice and SMS revenues. At our conferences, we have asked senior executives (using our anonymised voting system) about possible price and value erosion, and are often surprised by how far and fast telcos seem to think these core services will dwindle.

Figure 3: Example Telco 2.0 delegate view of 3-year voice revenue decline

Euro Mobile: The Future's Brutal - delegate views, Telco 2.0, Oct 2012
Source: Delegate Vote, New Digital Economics Executive Brainstorm, November 2011

…yet publicly, there is much less acknowledgement of the scale of the issue.

We’ve seen investment banks’ forecasts that assume that ARPUs can be (mostly) maintained through the magic of bundling, while some operators themselves paint a picture that can, charitably, be seen as rose-tinted at best:

Figure 4: Orange remains optimistic about European telecoms revenues

Euro Mobile: The Future's Brutal, Orange Forecast, Telco 2.0, October 2012
Source: FT Orange

Contents:

  • The bundling paradox
  • General trends impacting core services revenues
  • Macro-economic issues
  • Competitive & regulatory price pressure
  • The declining demand for voice telephony
  • Data growth
  • The relative mix of pre-paid vs post-paid customers
  • Lower handset subsidies
  • Definitions, assumptions & methodology
  • UK
  • Germany
  • France
  • Italy
  • Spain
  • Europe-wide summary
  • Appendix – Benchmarking prices for core services


  • Figure 1 – Mobile core Service revenues
  • Figure 2 – EU5 Mobile Services revenue already down 10% from 2009 peak
  • Figure 3 – Example Telco 2.0 delegate view of 3-year voice revenue decline
  • Figure 4 – Orange remains optimistic about European telecoms revenues
  • Figure 5 – Vodafone view bundling as the way to stem revenue loss
  • Figure 6 – At least 4 of the 6 general trends that impact mobile core services revenues are negative
  • Figure 7 – Developed-market mobile pricing has dropped 10%+ per annum
  • Figure 8 – French, German and Spanish mobile voice has historically had higher prices than other European countries
  • Figure 9 – STL Partners recent analysis suggests that Spain’s voice prices are nearly double those of UK and France
  • Figure 10 – Spanish voice premium is not offset by materially cheaper data charges compared with other European markets
  • Figure 11 – Despite growth over 2005-2010 period, mobile voice volumes are now flattening in more mature markets
  • Figure 12 – The underlying decline in fixed voice minutes (excluding mobile substitution) appears to be around 2% per quarter in the UK
  • Figure 13 – Smartphone penetration of mobile user base, January 2012
  • Figure 14 – EU5 mobile data revenues have grown steadily, not exponentially – and show recent signs of flattening-off as SMS declines
  • Figure 15 – The UK has shown a steady decline mobile data revenue growth rate despite increases in dongles and smartphones
  • Figure 16 – UK Mobile voice volumes (billions of minutes)
  • Figure 17 – UK Baseline Mobile Revenues down 25% from 2011 levels by 2020
  • Figure 18 – Unlike the UK, Germany mobile voice traffic is still growing strongly…
  • Figure 19 – …and mobile data usage in Germany is exploding (from a low base)
  • Figure 20 – Price pressure has meant that German mobile revenues have been flat in the recent past
  • Figure 21 – Germany Baseline Mobile Revenues down 18% from 2009 levels by 2020
  • Figure 22 – French mobile telephony volumes are still rising
  • Figure 23 – SMS and mobile data traffic volumes growing strongly
  • Figure 24 – France Baseline Mobile Revenues down 35% from 2009 levels by 2020
  • Figure 25 – Italy Baseline Mobile Revenues down 46% from 2009 levels by 2020
  • Figure 26 – Spain has been hurt especially hard by WhatsApp
  • Figure 27 – Spanish mobile voice traffic has been flat, but now faces decline
  • Figure 28 – The Spanish mobile market will fall precipitously through to 2020
  • Figure 29 – Total EU5 mobile core services revenues will fall 38% from peak by 2020
  • Figure 30 – Spain and Italy, in particular, are likely to experience a major decline in core mobile services revenues
  • Figure 31 – Mobile Voice Telephony Revenue Forecast by Country 2012-2020
  • Figure 32 – Extract from STL Partners database of 30-day SIM-only bundles
  • Figure 33 – Extract of how unit prices were calculated by STL Partners


Euro telcos: fiddling while the platform burns?

Summary: Most executives across the European telecoms industry accept that the current telco business model is in decline (the ‘burning platform’), but wholehearted action to create sustainable new models is not in place. We identify the key barriers and next steps to overcome them in this top-level analysis of findings from our recent EMEA Executive Brainstorm. (July 2012, Executive Briefing Service, Transformation Stream.)

UK Services Revenues: Actual and Forecast (index)

  Read in Full (Members only)   To Subscribe click here

Below is an extract from this 16 page Telco 2.0 Report that can be downloaded in full in PDF format by members of the Telco 2.0 Executive Briefing service and the Telco 2.0 Transformation stream here. Non-members can subscribe here and for this and other enquiries, please email contact@telco2.net / call +44 (0) 207 247 5003.

To share this article easily, please click:


Executive Summary

The Burning Platform

It was clear at the Telco 2.0/New Digital Economics Brainstorm in London a few weeks ago that most executives across the European telecoms industry accept that the current telco business model is in decline (the ‘burning platform’), but wholehearted action to create sustainable new models is not in place. 

Figure 1 – The burning platform illustrated: e.g. forecast decline in UK revenues

UK Services Revenues: Actual and Forecast (index)

Source: Presentation by Chris Barraclough, Chief Strategist and MD Telco 2.0

Two thirds of delegates thought this leading indicator forecast ‘about right’ or ‘too optimistic’.

Telcos need to act more decisively

The core message to the leaders of the European telecoms industry is that they must make a more concerted effort to change direction now or will have much less control over their future destinies.

Some telcos are taking steps, but even the most advanced are still in experimental mode, and the rest somewhere between strategic slide-ware and tacit acceptance of a future as a ‘pipe’.

As well as prudent re-pricing of data and diligence in cost and efficiency management, the primary opportunities for telcos are to re-conceive the core communications proposition, re-define the overall experience of being a telco customer and ultimately to create interoperable multi-sided business models that help 3rd parties and end-users (people, organisations and devices) connect in more efficient and effective ways. These actions will create a more valuable and defensible role for telcos in the emerging digital economy.

Overcoming industry inhibitions

To progress, the industry needs to overcome the following challenges:

  • Time is short. Delegates perceived that telcos had significantly less time to secure strategic control points in the digital economy than at previous brainstorms. Telcos need to act more decisively now in payments, advertising, creating new forms of ‘OTT’ communications, identity and cloud services.
  • Money is hard to find. The business cases for some of the new models are complex and the economics are different from traditional telco business models. We know because we have been working on many recently, and have also been recommending important new evaluation metrics. It’s not straightforward, nor is it easy to fill the gap left by the predicted decline in the current model, but it is possible to create new value.
  • Technology is a tool, not a strategy. The business case for LTE, for example, is hard to make without new service revenues in addition to access, which somewhat begs the question of who and what is leading this major industry investment. 
  • The right people are hard to find. 95% of delegates thought there is a serious shortage of the internal skills needed to manage, innovate and deliver very different types of propositions. Understanding, addressing and filling this gap is a vital priority.
  • Customers will not solve the industry’s problems. Most customers – upstream and downstream – do not understand how telcos could help them in new ways. Our research shows a range in comprehension and belief in telcos’ abilities, so telcos need to work harder to create and sell new solutions.
  • It’s tricky to organise innovation and change at scale. The operators that are starting to take action face a complex organisational challenge: should innovation be built into the core business or established in a new unit? In the core it is closer to the heart but also more vulnerable to the organisation’s white blood cells (the ones that attack unrecognised intruders). In a separate unit it’s easier to grant more freedoms but it’s much more difficult to integrate and change the core. 
  • Collaboration: the Prisoners’ Dilemma. Many of the new business models will only work effectively if telcos cooperate on a common approach. This is usually slow and difficult (witness the slow progress of RCS-e and the demise of WAC). There is also regulatory uncertainty around industry collaboration, and fear of the regulator is quite reasonably a powerful internal inhibitor in telcos. Additionally, some players perceive they could achieve competitive advantage by ‘going it alone’. A way through this dilemma needs to be navigated, and our recent analysis suggests some new ways to think about this.
  • It’s hard to change a winning formula (even when you are losing). Financial markets have been keen on telcos’ relative stability and cash flows in turbulent economic times. At the same time there are also those high up in telco organisations who have known nothing but success with the existing model and who will argue to defend the status quo. Yet the financial markets, well known as fickle and irrational beasts, will at some point start to be much more sensitive to the structural change in the telco industry and seek a new direction. Unreasonably perhaps, they will expect change to happen quickly, and if this is not apparent, they will demand new leaders but by then it may be too late.

Next steps for STL Partners and Telco 2.0

Telco 2.0 first described the core challenges facing the industry six years ago in ‘How to make money in an IP world‘, and proposed the ‘two-sided telecoms business model‘ as a key part of the solution four years ago. Over the last year we have published the ‘Roadmap to New Telco 2.0 Business Models‘ describing core innovations needed, and ‘Dealing with the Disruptors – Google, Apple, Facebook, Skype and Amazon‘ outlining strategies in the adjacent competitive landscape.

We’re now driving a range of implementation projects with individual players and collaborative consortiums and will be publishing a further detailed Telco 2.0 implementation guide later this year. Through our research we will also be benchmarking telcos’ strategies, to help the capital markets better understand how to make investment choices in the industry, and looking in-depth at creative strategies in voice and messaging, m-commerce, cloud services and M2M, as well as continuing our work with the World Economic Forum on one of the biggest prizes, how telcos can play a pivotal role in enabling the emergence of a new class of economic asset, ‘Personal Data‘.

We will also be running further invitation only Executive Brainstorms in Dubai (November 6-7, 2012), Singapore (4-5 December, 2012), Silicon Valley (19-20 March 2013), and London (23-24 April, 2013). Email contact@stlpartners.com or call +44 (0) 207 243 5003 to find out more.    

Support for Key Findings

The Platform is burning

Figure 2 – Delegates broadly agreed with STL’s UK Revenue forecast

STL Partners UK Revenue Forecast (June 2012)

Chris Barraclough, MD and Chief Strategist, Telco 2.0 / STL Partners, presented an example analysis of voice and data revenues from the UK market, and predicted a 24% decline from the peak in 2009 to 2018.

Delegates broadly supported this analysis, with over half saying they thought this was ‘about right’. We will be conducting and publishing further analysis in the top 5 European markets over the next few months.

NB The original ‘burning platform’ reference comes from this article describing a choice between certain death and possible death, and is now used to describe a situation where people are forced to act by dint of the alternative being somewhat worse. Nokia recently made ‘burning platform’ a famous phrase in the handset part of the telecoms sector, but it’s now relevant to telcos themselves as they face significant declines in their core revenues.

To read the note in full, including the following sections detailing support for the analysis…

  • Time is short
  • Money is hard to find
  • The right people are hard to find
  • Customers will not solve the industry’s problems
  • It’s tricky to organise innovation and change at scale
  • Collaboration: the Prisoners’ Dilemma
  • It’s hard to change a winning formula (even when you are losing)
  • Next steps

…and the following figures…

  • Figure 1 – The burning platform illustrated: e.g. forecast decline in UK revenues
  • Figure 2 – Delegates broadly agreed with STL’s UK Revenue forecast
  • Figure 3 – Time is running out for telcos
  • Figure 4 – The business case for Telco OTT Voice and Messaging is complex
  • Figure 5 – Telcos need to transform skills, systems, structures and incentives
  • Figure 6 – Upstream customers’ views on telco capabilities
  • Figure 7 – KPN is building innovation into the core rather than a separate business unit
  • Figure 8 – The Prisoners’ Dilemma
  • Figure 9 – It’s difficult to get the timing of new investments right 

Members of the Telco 2.0 Executive Briefing Subscription Service and the Telco 2.0 Transformation stream can download the full 16 page report in PDF format hereNon-Members, please subscribe here. For this or other enquiries, please email contact@telco2.net / call +44 (0) 207 247 5003.