US Wireless Market: Early Warning Signs of Change

Introduction

The US national wireless market is currently the most influential of its kind on the planet. Not only is it big, it is also rich, with significantly higher ARPUs than other developed markets. Not only is it big and rich, it is advanced, with much higher 4G penetration than comparable markets. Further, it has frequently acted as a bellwether for the world wireless industry. The iPhone’s success in the US marked the smartphone’s transition from pioneer to early-adopter status worldwide; the much greater success of the iPhone 3GS and the Moto Droid marked the beginning of mass adoption, and the crisis of the mid-market vendors.

On the network side, Verizon Wireless’s early decision to abandon the CDMA2000 development path and choose LTE FDD signalled the end of the standards wars and the beginning of serious 4G deployment, threw Motorola even deeper into crisis, and positioned Alcatel-Lucent as the leading vendor in the first wave of LTE rollouts.

The inclusion of the 1800MHz band in the iPhone 5, meanwhile, transformed the world’s spectrum picture, redefining this legacy GSM/PCS allocation as a key asset for smartphone-focused operators. Today, the combination of US wireless operators and US semiconductor vendors is transforming industry technology strategies again, as Verizon Wireless, AT&T, and Qualcomm lead the charge for a mobile broadband-focused “early” 5G.

Clearly, the US market is as critical for global mobile as the European market was in the pre-iPhone era. As a result, Telco 2.0 finds it useful to monitor it closely. We covered the changing 5G ecosystem in MWC: 5G and Wireless Networks  and How 5G is Disrupting Cloud and Network Strategy Today. We covered AT&T’s key role in driving NFV and open-source telco software forwards in Fast Pivot to the NFV Future, and the fate of worldwide 4G deployments in 4G Rollout Analysis: Winning Strategies and 5G Implications. This picked out one US carrier in particular for closer attention. In the adjacent industries, we covered Microsoft in Pivoting to a Communications-Focused Business, Amazon.com in Amazon Web Services: Colossal, but Invincible?, the cable operators in Gigabit Cable Attacks This Year, and the top-brand tech sector generally in Amazon, Apple, Facebook, Google, Netflix: Whose digital content is king?.

In this note, we will review developments in the US national wireless sector, both on a long-term basis since the launch of 4G, and on a tactical basis over the last 12 months, including analysis of the results from our new, unique Mobile Network Experience Index product .

The US Wireless Market, 2011-2016

The last five years in the US cellular market have been characterised by two forces – disruption, and growth. The arrival of smartphones comprehensively disrupted what had been a rather stagnant sector. Later, T-Mobile USA initiated a price disruption which resulted in a wave of consolidation and a significant drop in industrywide ARPU. However, despite the “uncarrier”’s price cuts, the total industry profit pool has nonetheless grown dramatically in that timeframe, from $8.7bn/quarter to $14bn/quarter, as the revenue base has grown by some 20%, or 4% per annum.

Figure 1: The US wireless revenue base, 2011-2016

Source: STL Partners, company filings, themobileworld

Growth was as characteristic of the US market over the last 5 years as price disruption. T-Mobile’s strategy was to a large extent possible because there was a significant degree of “blue-ocean” competition, enlarging the subscriber base and deepening its use of smartphones and high-speed data service, as well as consolidation of minor operators. We show the net impact on operating profits in Figure 2.

Figure 2: Long term shifts in the US national wireless profit pool, 2011-2016

Source: STL Partners, themobileworld.com, company filings

Over the whole timeframe, the total annual pool of operating profit available in the market has grown by 59% or 11.8% per annum, or five times as fast as US GDP. This came in the context of a 20%, or 4% annualised, increase in total wireless revenues. At the same time, three operators have benefited disproportionately from this growth – AT&T, Verizon Wireless, and T-Mobile. In fact, AT&T’s gains have been quite modest compared to the triumphs at VZW and T-Mobile.

On the other hand, Sprint has seen its operating profits halve and halve again, while Leap, MetroPCS, and numerous minor operators have exited the market. Looking at these data in a time-series view, as we do in Figure 3, we see that the duopoly is still a real force, although Verizon, has done distinctly better than AT&T.

Verizon Wireless, which pursued a “premium carrier” strategy based on going first with 4G, using its 700MHz holdings to maximise coverage and densifying with 1800MHz, and holding the line on price as long as possible, has clearly maximised its operating-level profitability. Meanwhile, a vicious struggle for third place was waged between T-Mobile and Sprint. Both parties struggled at times with the cost of spectrum acquisitions and network investments, and the gap between them and the duopoly is unmistakable. However, T-Mobile has managed to keep in the black since 2013 and its profitability is gradually improving, breaking away from the also-rans over the last 12 months.


  • Executive Summary
  • Introduction
  • The US Wireless Market, 2011-2016
  • Where Do We Go From Here?
  • Duopolists, challengers, and exits
  • Valuations
  • Challenging the Premium Carrier
  • The Impact of IPv6 deployment
  • Conclusions
  • Disruptive Responses: 5G
  • Disruptive Responses: Content


  • Figure 1: The US wireless revenue base, 2011-2016
  • Figure 2: Long term shifts in the US national wireless profit pool, 2011-2016
  • Figure 3: Profits at US wireless carriers, 2011-2016 (time series)
  • Figure 4: The short-run profits pool
  • Figure 5: Five years of Verizon Vs T-Mobile
  • Figure 6: Long term share of connections growth, 2011-2016
  • Figure 7: Short term share of connections growth, 2015
  • Figure 8: Long term retail postpaid users, 2011-2016
  • Figure 9: Short term retail postpaid subscribers, 2015
  • Figure 10: Now, T-Mobile is gaining the right kind of subscribers
  • Figure 11: Retail postpaid connections over time
  • Figure 12: Prepaid subscribers over time
  • Figure 13: Long term change in prepaid users is mostly growth, and MetroPCS’s exit
  • Figure 14: Short term change in retail prepaid users, 2015
  • Figure 15: T-Mobile’s debts are far from zooming out of control
  • Figure 16: Duopolists, challengers, and exit candidates
  • Figure 17: Net income margins over time
  • Figure 18: Device sales surge, margins dive
  • Figure 19: Valuation – EV/EBITDA
  • Figure 20: T-Mobile leads on our MobiNEX score
  • Figure 21: A link between network metrics and customer satisfaction?
  • Figure 22: 3 out of 4 US MNOs are “challenged” in the world context
  • Figure 23: Download speed vs. percentage of LTE requests
  • Figure 24: T-Mobile is the lowest-latency US operator
  • Figure 25: T-Mobile is generating 25% fewer high latency events than AT&T
  • Figure 26: T-Mobile’s error rate catches up on the market leader
  • Figure 27: Quality across the board
  • Figure 28: IPv6 adoption, US wireless operators

Cisco, Microsoft, Google, AT&T, Telefonica, et al: the disruptive battle for value in communications

Technology: Products and Vendors’ Approaches

There are many vendors and products in the voice/telephony arena. Some started as pure voice products or solutions like Cisco Call Manager, while others such as Microsoft Office 365 started as an office productivity suite, to which voice and presence became a natural extension, and then later a central part of the core product functionality. We have included details on RCS, however RCS is not globally available, and is limited in its functionality compared to some of the other products listed here.

Unified Communications

Unified Communications (UC) is not a standard; there are many different interpretations, but there is a general consensus about what it means – the unification of voice, video, messaging, presence, conferencing, and collaboration into a simple integrated user experience.

UC is an important technology for enterprise customers, it brings mobility and agility to an organisation, improves communication and collaboration, adds a social element, and lowers costs by reducing the need for office space and multiple disparate communications systems each with their own management and control systems. UC can be delivered as a cloud service and has the acronym UCaaS. Leading providers are Microsoft, Google, and Cisco. Other players include IBM, 8X8, and a number of other smaller vendors, as well as telco equipment manufacturers such as Ericsson. We have covered some of the leading solutions in this report, and there are definite opportunities for telcos to collaborate with these vendors, adding integration with core services such as telephony and mobile data, as well as customer support and billing.

There are several elements for an enterprise to consider when developing a UC solution for it to be successful:

  • Fixed voice functions and needs (including PBX) and integration into a UC solution
  • Mobile voice – billing, call routing, integration with fixed and UC solutions
  • Desktop and mobile video calling
  • Collaboration tools (conferencing, video conferencing, desktop integration, desktop sharing etc.)
  • Desktop integration – how does the solution integrate with core productivity tools (Microsoft Office, Google Apps, OpenOffice etc?)
  • PC and mobile clients – can a mobile user participate in a video conference, share files
  • Instant messaging and social integration
  • How the user is able to interact with the system and how intuitive it is to use. This is sometimes called the user experience and is probably the most important aspect, as a good user experience promotes efficiency and end user satisfaction

From the user perspective, it would be desirable for the solution to include the basic elements shown in Figure 1.

Figure 1: Basic user needs from Unified Communications
Voice Messaging Tech Cover

Source: STL Partners

Historically, Enterprise communications has been an area where telcos have been a supplier to the enterprise – delivering voice end points (E.164 phone numbers and mobile devices), voice termination, and outgoing voice and data services.

Organisational voice communications (i.e. internal calling) has been an area of strength for companies like Cisco, Avaya, Nortel and others that have delivered on-premise solutions which offer sophisticated voice and video services. These have grown over the years to provide Instant Messaging (IM), desktop collaboration tools, and presence capabilities. PC clients often replace fixed phones, adding functionality, and can be used when out of the office. What these systems have lacked is deep integration with desktop office suites such as Microsoft Office, Google Apps, and Lotus Notes. Plug-ins or other tools can be used to integrate presence and voice, but the user experience is usually a compromise as different vendors are involved.

The big software vendors have also been active, with Microsoft and IBM adding video and telephony features, and Google building telephony and conferencing into its growing portfolio. Microsoft also acquired Skype and has delivered on its promise to integrate Skype with Lync. Meanwhile, Google has made a number of acquisitions in the video and voice arena like ON2, Global IP Solutions, and Grand Central. The technology from ON2 allows video to be compressed and sent over an Internet connection. Google is pushing the products from ON2 to be integrated into one of the next major disruptors – WebRTC.

Microsoft began including voice capability with its release of Office Communications Server (OCS) in 2007. An OCS user could send instant messages, make a voice call, or place a video call to another OCS user or group of users. Presence was directly integrated with Outlook and a separate product – Office Live Meeting – was used to collaborate. Although OCS included some Private Branch eXchange (PBX) features, few enterprises regarded it as having enough features or capability to replace existing systems from the likes of Cisco. With Office 365, Microsoft stepped up the game, adding a new user interface, enhanced telephony features, integrated collaboration, and multiple methods of deployment using Microsoft’s cloud, on premise, and service provider deployments.


  • Technology: Products and Vendors’ Approaches
  • Unified Communications
  • Microsoft Office 365 – building on enterprise software strengths
  • Skype – the popular international behemoth
  • Cisco – the incumbent enterprise giant
  • Google – everything browser-based
  • WebRTC – a major disruptive opportunity
  • Rich Communication Service (RCS) – too little too late?
  • Broadsoft – neat web integration
  • Twilio – integrate voice and SMS into applications
  • Tropo – telephony integration technology leader
  • Voxeo – a pathfinder in integration
  • Hypervoice –make voice a native web object
  • Calltrunk – makes calls searchable
  • Operator Voice and Messaging Services
  • Section Summary
  • Telco Case Studies
  • Vodafone – 360, One Net and RED
  • Telefonica – Digital, Tu Me, Tu Go, BlueVia, Free Wi-Fi
  • AT&T – VoIP, UC, Tropo, Watson
  • Section Summary
  • STL Partners and the Telco 2.0™ Initiative


  • Figure 1: Basic user needs from Unified Communications
  • Figure 2: Microsoft Lync 2013 client
  • Figure 3: Microsoft Lync telephony integration options
  • Figure 4: International Telephone and Skype Traffic 2005-2012
  • Figure 5: The Skype effect on international traffic
  • Figure 6: Voice call charging in USA
  • Figure 7: Google Voice call charging in USA
  • Figure 8: Google Voice call charging in Europe
  • Figure 9: Google outbound call rates
  • Figure 10: Calliflower beta support for WebRTC
  • Figure 11: Active individual user base for WebRTC, millions
  • Figure 12: Battery life compared for different services
  • Figure 13: Vodafone One Net Express call routing
  • Figure 14: Vodafone One Net Business Call routing
  • Figure 15: Enterprise is a significant part of Vodafone group revenue
  • Figure 16: Vodafone Red Bundles
  • Figure 17: Telefonica: Market Positioning Map, Q4 2012
  • Figure 18: US market in transition towards greater competition
  • Figure 19: Voice ARPU at AT&T, fixed and mobile
  • Figure 20: Industry Value is Concentrated at the Interfaces
  • Figure 21: Telco 2.0™ ‘two-sided’ telecoms business model

Mobile Marketing and Commerce: the technology battle between NFC, BLE, SIM, & Cloud

Introduction

In this briefing, we analyse the bewildering array of technologies being deployed in the on-going mobile marketing and commerce land-grab. With different digital commerce brokers backing different technologies, confusion reigns among merchants and consumers, holding back uptake. Moreover, the technological fragmentation is limiting economies of scale, keeping costs too high.

This paper is designed to help telcos and other digital commerce players make the right technological bets. Will bricks and mortar merchants embrace NFC or Bluetooth Low Energy or cloud-based solutions? If NFC does take off, will SIM cards or trusted execution environments be used to secure services? Should digital commerce brokers use SMS, in-app notifications or IP-based messaging services to interact with consumers?

STL defines Digital Commerce 2.0 as the use of new digital and mobile technologies to bring buyers and sellers together more efficiently and effectively (see Digital Commerce 2.0: New $Bn Disruptive Opportunities for Telcos, Banks and Technology Players).  Fast growing adoption of mobile, social and local services is opening up opportunities to provide consumers with highly-relevant advertising and marketing services, underpinned by secure and easy-to-use payment services. By giving people easy access to information, vouchers, loyalty points and electronic payment services, smartphones can be used to make shopping in bricks and mortar stores as interactive as shopping through web sites and mobile apps.

This executive briefing weighs the pros and cons of the different technologies being used to enable mobile commerce and identifies the likely winners and losers.

A new dawn for digital commerce

This section explains the driving forces behind the mobile commerce land-grab and the associated technology battle.

Digital commerce is evolving fast, moving out of the home and the office and onto the street and into the store. The advent of mass-market smartphones with touchscreens, full Internet browsers and an array of feature-rich apps, is turning out to be a game changer that profoundly impacts the way in which people and businesses buy and sell.  As they move around, many consumers are now using smartphones to access social, local and mobile (SoLoMo) digital services and make smarter purchase decisions. As they shop, they can easily canvas opinion via Facebook, read product reviews on Amazon or compare prices across multiple stores. In developed markets, this phenomenon is now well established. Two thirds of 400 Americans surveyed in November 2013 reported that they used smartphones in stores to compare prices, look for offers or deals, consult friends and search for product reviews.

At the same time, the combination of Internet and mobile technologies, embodied in the smartphone, is enabling businesses to adopt new forms of digital marketing, retailing and payments that could dramatically improve their efficiency and effectiveness. The smartphones and the data they generate can be used to optimise and enable every part of the entire ‘wheel of commerce’ (see Figure 4).

Figure 4: The elements that make up the wheel of commerce

The elements that make up the wheel of commerce Feb 2014

Source: STL Partners

The extensive data being generated by smartphones can give companies’ real-time information on where their customers are and what they are doing. That data can be used to improve merchants’ marketing, advertising, stock management, fulfilment and customer care. For example, a smartphone’s sensors can detect how fast the device is moving and in what direction, so a merchant could see if a potential customer is driving or walking past their store.

Marketing that makes use of real-time smartphone data should also be more effective than other forms of digital marketing. In theory, at least, targeting marketing at consumers in the right geography at a specific time should be far more effective than simply displaying adverts to anyone who conducts an Internet search using a specific term.

Similarly, local businesses should find sending targeted vouchers, promotions and information, delivered via smartphones, to be much more effective than junk mail at engaging with customers and potential customers. Instead of paying someone to put paper-based vouchers through the letterbox of every house in the entire neighbourhood, an Indian restaurant could, for example, send digital vouchers to the handsets of anyone who has said they are interested in Indian food as they arrive at the local train station between 7pm and 9pm in the evening. As it can be precisely targeted and timed, mobile marketing should achieve a much higher return on investment (ROI) than a traditional analogue approach.

In our recent Strategy Report, STL Partners argued that the disruption in the digital commerce market has opened up two major opportunities for telcos:

  1. Real-time commerce enablement: The use of mobile technologies and services to optimise all aspects of commerce. For example, mobile networks can deliver precisely targeted and timely marketing and advertising to consumer’s smartphones, tablets, computers and televisions.
  2. Personal cloud: Act as a trusted custodian for individuals’ data and an intermediary between individuals and organisations, providing authentication services, digital lockers and other services that reduce the risk and friction in every day interactions. An early example of this kind of service is financial services web site Mint.com (profiled in the appendix of this report). As personal cloud services provide personalised recommendations based on individuals’ authorised data, they could potentially engage much more deeply with consumers than the generalised decision-support services, such as Google, TripAdvisor, moneysavingexpert.com and comparethemarket.com, in widespread use today.

These two opportunities are inter-related and could be combined in a single platform. In both cases, the telco is acting as a broker – matching buyers and sellers as efficiently as possible, competing with incumbent digital commerce brokers, such as Google, Amazon, eBay and Apple. The Strategy Report explains in detail how telcos could pursue these opportunities and potentially compete with the giant Internet players that dominate digital commerce today.

For most telcos, the best approach is to start with mobile commerce, where they have the strongest strategic position, and then use the resulting data, customer relationships and trusted brand to expand into personal cloud services, which will require high levels of investment. This is essentially NTT DOCOMO’s strategy.

However, in the mobile commerce market, telcos are having to compete with Internet players, banks, payment networks and other companies in land-grab mode – racing to sign up merchants and consumers for platforms that could enable them to secure a pivotal (and potentially lucrative) position in the fast growing mobile commerce market. Amazon, for example, is pursuing this market through its Amazon Local service, which emails offers from local merchants to consumers in specific geographic areas.

Moreover, a bewildering array of technologies are being used to pursue this land-grab, creating confusion for merchants and consumers, while fuelling fragmentation and limiting economies of scale.

In this paper, we weigh the pros and cons of the different technologies being used in each segment of the wheel of commerce, before identifying the most likely winners and losers. Note, the appendix of the Strategy Report profiles many of the key innovators in this space, such as Placecast, Shopkick and Square.

What’s at stake

This section considers the relative importance of the different segments of the wheel of commerce and explains why the key technological battles are taking place in the promote and transact segments.

Carving up the wheel of commerce

STL Partners’ recent Strategy Report models in detail the potential revenues telcos could earn from pursuing the real-time commerce and personal cloud opportunities. That is beyond the scope of this technology-focused paper, but suffice to say that the digital commerce market is large and is growing rapidly: Merchants and brands spend hundreds of billions of dollars across the various elements of the wheel of commerce. In the U.S., the direct marketing market alone is worth about $155 billion per annum, according to the Direct Marketing Association. In 2012, $62 billion of that total was spent on digital marketing, while about $93 billion was spent on traditional direct mail.

In the context of the STL Wheel of Commerce (see Figure 3), the promote segment (ads, direct marketing and coupons) is the most valuable of the six segments. Our analysis of middle-income markets for clients suggests that the promote segment accounts for approximately 40% of the value in the wheel of digital commerce today, while the transact segment (payments) accounts for 20% and planning (market research etc.) 16% (see Figure 5). These estimates draw on data released by WPP and American Express.

Note, that payments itself is a low margin business – American Express estimates that merchants in the U.S. spend four to five times as much on marketing activities, such as loyalty programmes and offers, as they do on payments.

Figure 5: The relative size of the segments of the wheel of commerce

The relative size of the segments of the wheel of commerce Feb 2014

Source: STL Partners


  • Introduction
  • Executive Summary
  • A new dawn for digital commerce
  • What’s at stake
  • Carving up the wheel of commerce
  • The importance of tracking transactions
  • It’s all about data
  • Different industries, different strategies
  • Tough technology choices
  • Planning
  • Promoting
  • Guiding
  • Transacting
  • Satisfying
  • Retaining
  • Conclusions
  • Key considerations
  • Likely winners and losers
  • The commercial implications
  • About STL Partners


  • Figure 1: App notifications are in pole position in the promotion segment
  • Figure 2: There isn’t a perfect point of sale solution
  • Figure 3: Different tech adoption scenarios and their commercial implications
  • Figure 4: The elements that make up the wheel of commerce
  • Figure 5: The relative size of the segments of the wheel of commerce
  • Figure 6: Examples of financial services-led digital wallets
  • Figure 7: Examples of Mobile-centric wallets in the U.S.
  • Figure 8: The mobile commerce strategy of leading Internet players
  • Figure 9: Telcos can combine data from different domains
  • Figure 10: How to reach consumers: The technology options
  • Figure 11: Balancing cost and consumer experience
  • Figure 12: An example of an easy-to-use tool for merchants
  • Figure 13: Drag and drop marketing collateral into Google Wallet
  • Figure 14: Contrasting a secure element with host-based card emulation
  • Figure 15: There isn’t a perfect point of sale solution
  • Figure 16: The proportion of mobile transactions to be enabled by NFC in 2017
  • Figure 17: Integrated platforms and point solutions both come with risks attached
  • Figure 18: Different tech adoption scenarios and their commercial implications

Telco 2.0: Making Money from Location Insights

Preface

The provision of Location Insight Services (LIS) represents a significant opportunity for Telcos to monetise subscriber data assets. This report examines the findings of a survey conducted amongst representatives of key stakeholders within the emerging ecosystem, supplemented by STL Partners’ research and analysis with the objective of determining how operators can release the value from their unique position in the location value chain.

The report concentrates on the Location Insight Services (LIS), which leverage the aggregated and anonymised data asset derived from connected consumers’ mobile location data, as distinct from Location Based Services (LBS), which are dependent on the availability of individual real time data.

The report draws the distinction between Location Insight Services that are Person-centric and those that are Place-centric and assesses the different uses for each data set.

In order to service the demand from specific use cases as diverse as Benchmarking, Transport & Infrastructure Planning, Site Selection and Advertising Evaluation, operators face a choice between fulfilling the role of Data Supplier, providing the market with Raw Big Data or offering Professional Services, adding value through a combination of location insight reports and interpretation consultancy.

The report concludes with a comparative evaluation of options for operators in the provision of LIS services and a series of recommendations for operators to enable them to release the value in Location Insight Services.

Location data – untapped oil

The ubiquity of mobile devices has led to an explosion in the amount of location-specific data available and the market has been quick to capitalise on the opportunity by developing a range of Location-Based Services offering consumers content (in the form of information, promotional offers and advertising). Industry analysts predict that this market sector is already worth nearly $10 billion.

The vast majority of these Location Based Services (LBS) are dependent on the availability of real time data, on the reasonable assumption that knowing an individual’s location enables a company to make an offer that is more relevant, there and then.  But within the mobile operator community, there is a growing conviction that a wider opportunity exists in deriving Location Insight Services (LIS) from connected consumers’ mobile location data. This opportunity does not necessarily require real time data (see Figure 9). The underlying premise is that identification of repetitive patterns in location activity over time not only enables a much deeper understanding of the consumer in terms of behaviour and motivation, but also builds a clearer picture of the visitor profile of the location itself.

Figure 1:  Focus of this study is on Location Insight Services
Focus of this Study on Location Insight Services

  • As part of our Telco 2.0 Initiative, we have surveyed a number of companies from within the evolving location ecosystem to assess the potential value of operator subscriber data assets in the provision of Location Insight Services. This report examines the findings and illustrates how operators can release the value from their unique position in the location value chain.

Location Insight Services is a fast growing, high value opportunity

The demand is “Where”?

For operators to invest in the technology and resources required to enter this market, a compelling business case is required. Firstly, various analysts have confirmed that there is a massive latent demand for location-centric information within the business community to enable the delivery of location-specific products and services that are context-relevant to the consumer. According to the Economist Business Unit, there is a consensus amongst marketers that location information is an important element in developing marketing strategy, even for those companies where data on customer and prospect location is not currently collected.3

Figure 2: Location is seen as the most valuable information for developing marketing strategy
Location is seen as the most valuable information for developing marketing strategy

Source: Mind the marketing gap – A report from Economist Business Intelligence Unit

Scoping the LIS opportunity by industry and function

In order to understand the market potential for Location Insight Services, we have considered both industry sectors and job functions where insights derived from location data at scale improve business efficiencies. Our research has suggested that Location Insight Services have an application to many organisations that are seeking to address the broader issue of how to extract the benefits concealed within Big Data.

A recent report from Cisco concentrating on how to unlock the value of digital analytics suggested that Big Data has an almost universal application and

“Big Data could help almost any organization run better and more efficiently. A service provider could improve the day-to-day operations of its network. A retailer could create more efficient and lucrative point-of-sale interactions. And virtually any supply chain would run more smoothly. Overall, a common information fabric would improve process efficiency and provide a complete asset view.” 

Our research suggests that the following framework facilitates understanding of the different elements that together comprise the market for non-real time Location Insight Services.

The matrix considers the addressable market by reference to vertical industry sectors and horizontal function or disciplines.

We have rated the opportunities High, Medium and Low based on a high level assessment of the potential for uptake within each defined segment. In order to produce an estimate of the potential market size for non-real time Location Insight Services, STL Partners have taken into account the current revenue estimates for both industry sectors and functions.

Figure 3:  Location Insight Market Overview (telecoms excluded)
Location Insight Services Market Taxonomy

Report Contents

  • Preface
  • Executive Summary
  • Location data – untapped oil
  • Location Insight Services is a fast growing, high value opportunity
  • Scoping the LIS opportunity by industry and function
  • Location Insight Services could be worth $11bn globally by 2016
  • Which use cases will drive uptake of LIS?
  • Use cases – industry-specific illustrations
  • How should Telcos “productise” location insights services?
  • Operators are uniquely placed to deliver location insights and secure a significant share of this opportunity
  • What is the operator LIS value proposition?
  • Location insight represents a Big Data challenge for Telcos.
  • There is a demand for more granular location data
  • Increasing precision commands a premium
  • Meeting LIS requirements – options for operators
  • What steps should operators take?
  • Methodology and reference sources
  • References
  • Appendix 1 – Opportunity Sizing
  • Definition
  • Methodology


  • Figure 1: Focus of this study is on Location Insight Services
  • Figure 2: Location is seen as the most valuable information for developing marketing strategy
  • Figure 3: Location Insight Market Overview (telecoms excluded)
  • Figure 4: The value of Global Location Insight Services by industry and sector (by 2016)
  • Figure 5: How UK retail businesses use location based insights
  • Figure 6: Illustrative use cases within the Location Insights taxonomy
  • Figure 7: How can Telcos create value from customer data?
  • Figure 8: Key considerations for Telco LIS service strategy formulation
  • Figure 9: Real time service vs. Insight
  • Figure 10: The local link in global digital markets
  • Figure 11: Customer Data generated by Telcos
  • Figure 12: Power of insight from combining three key domains
  • Figure 13: Meeting LIS Requirements – Options for Operators

Telco 2.0 Transformation Index: Understanding Telefonica’s Markets and Market Position

Summary: 
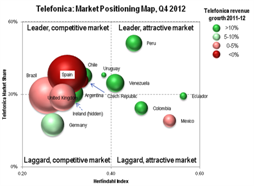
This extract from the Telco 2.0 Transformation Index shows our analysis of Telefonica’s markets and market position, including economic and digital market maturity, regulation, customers, competition and pricing. It is one part of our overall analysis of Telefonica’s progress towards transformation to the Telco 2.0 business model. The other parts of the Telefonica analysis are: Service Proposition, Finances, Technology, Value Network, and an overall summary. Telefonica is one of the companies analysed and compared in the first tranche of analysis that also addresses Vodafone, AT&T, Verizon, Axiata, SingTel, Etisalat and Ooredoo (formerly Qtel). (August 2013, Executive Briefing Service, Transformation Stream.) Telefonica Telco 2.0 Transformation Index Small

Introduction


Details of the objectives and key benefits of the overall Telco 2.0 Transformation Index can be found here, and the methodology and approach here.

Telefonica is one of the first companies featured in our Transformation Index, and one that is viewed with great interest by others. With operating companies facing very different conditions in Europe and South America, Telefonica faces some interesting strategic challenges, and has attempted to stimulate growth through innovation with the development of Telefonica Digital.

The ‘Markets and Position’ section of the analysis puts Telefonica’s current global position, risks and opportunities in context, and is now available to download to members of the Telco 2.0 Executive Briefing Service. The rest of the analysis (covering Service Proposition, Value Network, Technology and Finances), and the analyses of the other seven companies initially covered (Vodafone, AT&T, Verizon, Etisalat, Ooredoo [formerly Qtel], Singtel and Axiata) will be published from September 2013.

Key Benefits

  • The report’s highly graphical format makes it extremely easy to digest and reach valuable insights quickly into both Telefonica’s current position and future strategic needs
  • The structure of the analysis allows the reader to rapidly and concisely assimilate the complex picture of Telefonica’s international businesses, risks and opportunities
  • It is underpinned with detailed and sourced numerical and qualitative data


Example charts from the report

The report analyses Telefonica’s market share position across markets against their regulatory strength.
Telco 2.0 Transformation Index - Market Positioning Detail


It also assesses the economic and demographic make-up of Telefonica’s markets.

Telco 2.0 Transformation Index - Market Analysis Detail Example, Telefonica

The market analyses are consolidated into an overall summary of market positioning by Operating Company, which is further refined into an assessment of strategic approach and operational performance.

Telco 2.0 Transformation Index - Market Share and Profitability Detail


Contents

To access the contents of the report, including…

  • Introduction and Methodology
  • Market Position Summary: Economic, Regulatory, Competitive and Customers
  • Summary analysis of growth, GDP, prices and economics of key markets
  • Comparison and contrasts between European and Latin American markets
  • Regulation vs EBITDA margins
  • Mobile revenue growth by market
  • Subscribers and revenues by region
  • Mari-Meko of Subscribers and Shares in key markets
  • Market Share Vs. Regulation
  • Market Vs. Telefonica Growth by national market
  • Telefonica’s commercial strategy
  • Strength of OTT entrants in Telefonica’s markets
  • Pre-Pay, Post-Pay and Churn by Market
  • Telefonica’s relative brand strength


Digital Commerce: Leading Apps and Strategies for Retailers, Online Players and Telcos in the $10Bn Loyalty Market

Summary:  The advent of smartphones and tablets is disrupting the $10Bn+ loyalty market by opening up new ways for brands and retailers to engage with their customers in a highly interactive fashion.  This briefing analyses that market, why mobile is a compelling medium in it, key mobile app types, and leading edge strategies used by online players and traditional retailers. It concludes by outlining the strategies telcos need to employ to add value and exploit their assets and capabilities to play a major role in the value chain. (July 2013, Executive Briefing Service, Dealing with Disruption Stream.)

Loyalty and Mobile Venn Diagram 2013

  Read in Full (Members only)  Buy a single user license online  To Subscribe click here

Below is an extract from this 44 page Telco 2.0 Report that can be downloaded in full in PDF format by members of the Telco 2.0 Executive Briefing service and the Dealing with Disruption Stream here. Non-members can subscribe here, buy a Single User license for this report online here for £795 (+VAT for UK buyers), or for multi-user licenses or other enquiries, please email contact@telco2.net / call +44 (0) 207 247 5003.

To share this article easily, please click:


Who is this report for?

  • CxOs, strategists, marketing strategists and managers, loyalty programme managers, digital commerce and experience managers, new business development and sales people
  • In Telecoms operators and Vendors in Digital and Mobile Commerce, and in Financial Services and Online and / or ‘Bricks and Mortar’ Retail
  • More broadly, any executive or investor looking for an informed new perspective on the digital loyalty market

Key benefits

  • Better and more benchmarked decisions about your own company’s use of digital and mobile media to deliver loyalty progammes, increase loyalty and reduce churn
  • Better and more informed views about the potential needs of 3rd party digital loyalty programmes in this $10Bn + market, and how telcos in particular could address them
  • A broader understanding of the loyalty ecosystem and links to other aspects of digital commerce

Introduction

STL Partners defines Digital Commerce 2.0 as the use of new digital and mobile technology to bring buyers and sellers together more efficiently and effectively. Fast-growing usage of mobile and social networking is opening up direct communication channels for bricks-and-mortar companies that could strengthen relationships with customers and, as a result, improve both sales performance and operating efficiency.

With consumers permanently connected via mobile and social networking, leveraging the collective influence of loyal customers has never been more important. Now, more than ever, retailers are looking to facilitate information access and sharing – such as comparison tools, vouchers, personalised offers, and loyalty points – with their customers. An engaged and loyal customer base is likely to spend more and act as a ‘brand ambassador’ community for the company.

This executive briefing builds on STL Partners’ previously-published reports, Digital Commerce: Show me the Money and The Mobile Commerce Land-grab, which map out a comprehensive mobile commerce strategy and systematic approach to deploy services. In this briefing, STL Partners focuses on a specific aspect of our Digital Commerce “Wheel of Commerce”: Mobile loyalty. It explores opportunities for mobile operators to establish themselves as strong strategic position in the mobile loyalty space. In this briefing, we:

  • Define the loyalty market and explore the role of mobile technologies as an loyalty-enabler
  • Estimate the size of the loyalty market in Europe and in the U.S.
  • Identify, categorise and analyse some of the best global practices of both start-ups and Internet players, such as FidMe, Foursquare or Shopkick and well-known retailers and brands; namely Starbucks and Sephora
  • Examine how telcos can participate in the loyalty value chain
  • Highlight the key next steps for telcos to become successful in the mobile loyalty space

Market size and opportunity

The growing importance of mobile in commerce

In the mid-1990s, e-commerce platforms began disrupting the retail sector by promoting a new consumption model that gave consumers greater control and access to a wider choice of products, price comparison tools, and customer feedback information. Online players thus not only enjoyed cost advantages, but also customer experience advantages over high-street retailers.  Bricks-and-mortar players had to re-examine and re-evaluate their relationships with customers.

While mobile technology continues to create challenges for high-street players by enabling, for example, ‘show-rooming’ in which customers browse products in the store while simultaneously finding the best price for the same product online, mobile also provides the tools for a ‘high-street fight-back’.  By communicating with individual customers through the mobile channel, brands and shops have the ability to provide relevant personalised messages and offers that promote brand loyalty, as well as directly affecting purchasing behaviour.

The impact of mobile technologies on purchasing decisions is, therefore, increasing rapidly.  As well as using their handsets to buy more, consumers are also using mobile phones as a key tool for research and to make buying decisions.

Figure 1: digital buying is a multi-channel process

Consumers Take a Multi-Device Path to Purchase May 2013

Source: Google

Defining the loyalty market

We define loyalty as covering three principle activities within the ‘Retain’ section of STL Partners’ Digital Commerce ‘Wheel of Commerce (see Figure 2) – a schematic representation of all the key elements of a holistic digital commerce offering:

  • Loyalty programmes: A loyalty programme is a marketing initiative that rewards – and, therefore, encourages – loyal “buying behaviour” amongst an existing customer base. Examples of successful loyalty programmes are Tesco Clubcard and Nectar in the UK, Air Miles or AMEX cashback rewards.
  • Advocacy programmes: “Customer advocates” are customers who have a high degree of affinity or emotional equity towards a brand and will proactively talk about a brand, engage others in discussions about it, and influence people to buy a specific product and service. These ad-hoc promotional activities are usually not monitored or regulated by the brand itself. Luxury hotel chains, such as the Hilton or Carlson, are examples of brands with these kinds of advocates.
  • Brand communities: A brand community is essentially a group of ardent consumers organised around a lifestyle and the interests, activities, and ethos of the brand. Those users are “continuously” in touch with the brand and each other, not only responding to company initiatives, but also initiating and continuing conversations of their own about any aspect of the brand/business. Apple, Nike, Harley Davidson and Oracle are examples of brands, which have successfully created brand communities. Although brand communities have traditionally existed offline, the internet has strongly facilitated communication and information sharing between people. The primary difference to Advocacy programmes is that the key interactions are within the brand community as opposed to with potential new users and customers.

Things are complicated, of course, by the fact that the other sections of the ‘Wheel of Commerce’ are used in loyalty activities – customer profiling (in the plan section), offers and deals (promote), recommendations (guide), coupon redemptions and loyalty rewards (transact), and customer ratings (satisfy) are all potentially part of an effective loyalty or advocacy program.

Figure 2: STL Partners’ ‘Wheel of Commerce’
STL Partners’ ‘Wheel of Commerce’ May 2013

Source: STL Partners

A loyalty market estimated at $1.7+ billion in Europe and $9 billion in the US

For the reasons outlined above, it is not easy to size loyalty as a distinct market separate from other marketing and payment activities associated with digital commerce. 

As one benchmark, the AIMIA UK coalition estimates that £1 out of every £15 spent by UK consumers was eligible for a loyalty reward – or 6.7% of their spending. According to Payment Council, the UK spent around £312 billion in retail in 2012, so using the AIMIA UK coalition’s 6.7% estimate, this equates to a total retail value of £21 billion being eligible for loyalty schemes. Based on the major UK loyalty schemes (Tesco, Nectar), for each pound spent in retail, customers are rewarded with a penny voucher (1:100 ratio).  Therefore, the estimated UK loyalty spending by retailers in terms of rewards issued (as opposed to redeemed) is £210 million, i.e. US$325 million.

The UK loyalty marketplace is mature compared to other European countries. According to Global Vision, the UK represents 15 percent of the EU25 Purchasing Power Parity (PPP), suggesting a potential USD1.4 billion European loyalty market value.

Moreover Colloquy estimates that the perceived value of points sold to third-parties in 2011 in the US was worth $9 billion.

Figure 3: US Loyalty Market $Bns
US Loyalty Market $Bns May 2013

Sources: Colloquy, AIMIA, Payment Council, Global Vision, STL Partners
Exchange rate: £1= USD1.55

Some estimates of the value of the loyalty market are much higher. For example, Colloquy estimated the 2011 U.S. loyalty market at USD 48bn, while AIMIA has predicted that the global loyalty market will be worth USD 100bn in 2015. Those higher estimates refer to the broader loyalty market, which notably includes the transport and hospitality industries (with their popular ‘Airmiles’ type schemes). In this study, STL Partners is only considering the retail industry. Also some industry estimates include valuations relating to consumers’ perceived value of their earned and collected points, as opposed to the effective cost to the merchant, which we have used to give a more relevant comparison for players considering the business case in more depth.

Why is mobile such an important component in generating customer loyalty?

Mobile technologies open up new and creative ways for brands and retailers to interact with their target audiences. They can use the mobile channel to exchange value with their target audiences in order to generate leads, as well as on-going dialogue, which can be used, for example, to learn more about customers or to test new product and service concepts. An increasing proportion of retailers are integrating innovative mobile and digital technology into their marketing and loyalty strategy as a mean to differentiate and to fulfil customers’ needs for more personalisation, interactivity, and proximity.

Personalised shopping experiences

The relationship that retailers maintain with their customers is being reinvented. The combination of the Internet, online commerce platforms and advanced analytics tools is enabling new forms of interaction with online consumers.

Consumers are now expecting more personalised shopping experiences.  Amazon has, for example, strengthened its customer relationships by offering support across the whole customer life cycle – recommendations, purchase decision, delivery, after-sale service and customer retention.

As shoppers grow more fluent in browsing and comparing prices via smartphone, pure ‘bricks-and-mortar’ retail channels are struggling to keep pace with discount online merchants that contribute to the rise of “showrooming”, in which customers browse for products in stores and then buy them online from Amazon and other retailers for less. Such is Amazon’s confidence that it can offer prices unmatched by stores that its ‘price checker’ application is even encouraging consumers to visit bricks-and-mortar retailers to trial products before ordering them online from Amazon.

By placing the Internet in the hands of consumers all the time, mobile devices are enhancing consumers’ information and control over their shopping experience. Retailers of any kind must respond by offering competitively-priced and personalised offerings.

Effective customer engagement and interactivity

As more consumer attention and transactions move on to mobile, it is no surprise that retailers and brands see this as an increasingly important way to engage with customers.  Mobile advertising, heavily hyped between 2005 and 2007, is finally beginning to attract material budgets.  However, there has been a shift away from traditional display advertising (common on the Internet) towards more interactive forms of engagement that take advantage of mobile’s unique characteristics of immediacy and ability to influence consumers while they are out and about combined with an effective ‘return path’ – whether that be via SMS or WAP.  Moreover, the ubiquity and intrinsic characteristics of mobile phones have enabled and facilitate “on-the-go” dialogue and content sharing activities.

Retailers are now encouraging loyal customers to populate social media channels with engaging content: (Micro)-blogging sites, photo galleries, forums, polls, and videos are all examples of social communication channels that are being used by merchants and brands to interact with existing customers. It is no surprise that the battleground for Internet players that offer marketing and advertising support, such as Facebook, Google and Microsoft (Online Services division), is shifting rapidly to mobile.

Mobile increases merchant timeliness and reach

As the level of ‘marketing noise’ for consumers rises remorselessly on the Internet, merchants increasingly need to offer appropriate relevant messages at the right time. For example, product offers need to be made while consumers are in-store (and before they reach the point of sale), not while they are at home opening mail or, worse, overseas in a different time zone. Mobile does not just provide reach but, with the addition of location and presence, also allows merchants to interact with consumers efficiently at the right place and the right time.

Figure 4: Three ways mobile can support retailer and brand loyalty schemes
Three ways mobile can support retailer and brand loyalty schemes May 2013

 Source: STL Partners/Telco 2.0

To read the note in full, including the following additional analysis…

  • Two major mobile loyalty app categories
  • Physical loyalty card replacement
  • Loyalty-oriented digital commerce applications
  • Retailers’ loyalty strategies
  • Starbucks – Deepen customer relationship to drive loyalty
  • Sephora – loyalty scheme to unify its social and mobile marketing strategy
  • Where and how could telcos play in the loyalty market?
  • 1. Implement and experiment with your own loyalty programme
  • 2. Create compelling and powerful rewards
  • 3. Exploit your customer data to enable third-party businesses
  • 4. Build loyalty into m-wallet services
  • 5. Provide connectivity to deepen the communication channels between retailers and their consumers
  • What should operators do?
  • 1. Explore, Experiment and Collaborate
  • 2. Develop a compelling “in-door” coverage proposition to retailers
  • 3. Invest in customer data skills
  • About STL Partners

…and the following figures…

  • Figure 1: digital buying is a multi-channel process
  • Figure 2: STL Partners’ ‘Wheel of Commerce’
  • Figure 3: US Loyalty Market $Bns
  • Figure 4: Three ways mobile can support retailer and brand loyalty schemes
  • Figure 5: Key Ring aggregates loyalty cards within a single ‘wallet-like’ application
  • Figure 6: FidMe – a simple loyalty card scheme for local brands
  • Figure 7: Snapp’ business model
  • Figure 8: Foursquare’s SoMoLo app
  • Figure 9: Shopkick’s automated shopper rewards – ‘kicks’
  • Figure 10: Mobile Shopping Apps Average Time Spent per Month
  • Figure 11: Starbucks’ Facebook page
  • Figure 12: Starbucks’ promotional offers on Twitter
  • Figure 13: Starbucks’ Pinterest boards
  • Figure 14: Frappucino.com
  • Figure 15: Starbuck’s mobile application
  • Figure 16: Starbucks leading approach to digital loyalty
  • Figure 17: Starbucks 2000 – 2012
  • Figure 18: Sephora’s employees on Pinterest
  • Figure 19: Sephora virtual mirror application
  • Figure 20: Sephora on Passbook
  • Figure 21: “Beauty Insider” is unifying Sephora’s customer experience
  • Figure 22: Sephora 2000 – 2012
  • Figure 23: How the MinuTrade cash back programme works
  • Figure 24: MinuTrade value proposition
  • Figure 25: Value of telcos’ capabilities to retailers
  • Figure 26: How Wi-Fi fits into O2’s mobile commerce strategy
  • Figure 27: Telcos advantages to support retailer and brand loyalty activities
  • Figure 28: Relative value to telcos versus ease of implementation

Members of the Telco 2.0 Executive Briefing Subscription Service and the Dealing with Disruption Stream can download the full 44 page report in PDF format hereNon-Members, please subscribe here, buy a Single User license for this report online here for £795 (+VAT for UK buyers), or for multi-user licenses or other enquiries, please email contact@telco2.net / call +44 (0) 207 247 5003.

Technologies and industry terms referenced: 

Digital Commerce: Time to redefine the Mobile Wallet

Summary: The ‘Mobile/Digital Wallet’ needs to evolve to support authentication, search and discovery, as well as payments, vouchers, tickets and loyalty programmes. Moreover, consumers will want to be able to tailor the functionality of this “commerce assistant” or “commerce agent” to fit with their own interests and preferences. Key findings and next steps from the Digital Commerce stream of our Silicon Valley 2013 brainstorm. (April 2013, Executive Briefing Service, Dealing with Disruption Stream.)

Who is best placed to win in local commerce April 2013

  Read in Full (Members only)   To Subscribe click here

Below are the high-level analysis and detailed contents from a 35 page Telco 2.0 Briefing Report that can be downloaded in full in PDF format by members of the Telco 2.0 Executive Briefing service and the Dealing with Disruption Stream  here. Digital Commerce strategies and the findings of this report will also be explored in depth at the EMEA Executive Brainstorm in London, 5-6 June, 2013. Non-members can find out more about subscribing here, or to find out more about this and/or the brainstorm by emailing contact@telco2.net or calling +44 (0) 207 247 5003.

To share this article easily, please click:


Introduction

Part of the New Digital Economics Executive Brainstorm 2013 series, the Digital Commerce 2.0 event took place at the InterContinental Hotel, San Francisco on the 20th March and looked at how to get the mobile commerce flywheel moving, how to digitise local commerce, how to improve digital advertising and how to effectively leverage customer data and personal data. The Brainstorm considered how to harness telco assets and capabilities, as well as those of banks and payment networks, to deliver Digital Commerce 2.0.

Analysis: Time to redefine the wallet?

The Executive Brainstorm uncovered widespread confusion and dissatisfaction with the concept of a digital or mobile wallet. Some executives feel that a wallet, with its connotations of a highly personal item that is controlled entirely by the consumer and used primarily for transactions, may be the wrong term. There is a view that the concept of a digital wallet may have to evolve into a more multi-faceted application that supports authentication, search and discovery, as well as payments, vouchers, tickets and loyalty programmes.

Moreover, consumers will likely want to be able to tailor the functionality of this “commerce assistant” or “commerce agent” to fit with their own interests and preferences, rather than having to use an inflexible off-the-shelf application. This gateway application may also act as a personal cloud/locker service, providing access to the individual’s media and content, as well as enabling them to control their privacy settings. In other words, ultimately, consumers may want an assistant or agent that amalgamates the personalised discovery services offered by apps, such as Google Now, online media services, such as iCloud, and the traditional functions of a wallet, such as payments, receipts, coupons and loyalty programmes.

Business model battles

The Brainstorm confirmed that the digital commerce market continues to be held back by the slow and familiar dance between the established interests of banks/payment networks, telcos, and retailers. Designing business models that sufficiently incentivise each partner is tough: big retailers, for example, are likely to resist digital commerce solutions that don’t address their dissatisfaction about transaction fees – there was some excitement about digital commerce solutions that workaround the major payment networks’ interchange systems.

Some of the participants in the Brainstorm held strongly entrenched views about which players can contribute to growth in digital commerce and should therefore benefit most from that growth. The arguments boiled down to:

  • The banking ecosystem believes it is well placed because of the requirement for transactions to be processed by entities with banking licenses and that comply with know your customer (KYC) regulations.
  • Telcos believe that, as digital commerce-related data travels over their networks, they will understand the market better than other players.
  • Retailers believe that they have the customer relationships and that digital commerce offers opportunities to strengthen those relationships and reduce the costs of transactions.

The length and complexity of the digital commerce value chain raises significant questions about whether one entity could and should own the customer relationship and manage customer care across the whole experience. Moreover, there may be a disconnect between elements of the value chain and the overall value proposition. For example, individual retailers may wish to offer fully-customised digital commerce experiences delivered through their own branded apps, but consumers may not want to see the complexity of the existing marketplace, in which they are asked to register and carry multiple loyalty cards, continue in an increasingly digitised world.

While the traditional players jostle for the best positions in the value chain, the door is wide open for market entrants to come with radically disruptive business models. Although telcos have the customer data to be play a pivotal role in digital commerce, other players will work around them unless telcos are prepared to move quickly and partner on equitable terms. In many cases, telcos (and other would-be digital commerce) brokers may have to compromise on margins to seed the market and ultimately gain scale – small merchants (the long tail), which have highly inefficient marketing today, have a greater incentive than large retailers to adopt such solutions. Participants in the Silicon Valley Brainstorm thought that either established Internet players or a start up would ultimately win over the banks and telcos in local commerce.

Who is best placed to win in local commerce April 2013

Consumers are most likely to adopt digital commerce services that offer convenience and breadth. Therefore, such services need to act as open and flexible brokers, which enable a wide range of merchants to use application programming interfaces (APIs) to plug in vouchers and loyalty schemes quickly and easily.

Mobile advertising – still very immature

Immature and messy, the mobile advertising market is still a long way from being as structured as, for instance, television advertising, in terms of standardising metrics for buyers and creating an efficient procurement process. The Brainstorm highlighted the profusion of different technologies and platforms that is making the mobile advertising market highly-fragmented and very resource-intensive for media buyers. In many cases, the advertising industry may be struggling to differentiate between mobile networks, mobile users and mobile devices. For example, a consumer using a tablet on a sofa may be seeing the same adverts as a smartphone user travelling to work on a train.

In essence, the creatives working in advertising agencies are not certain what messages and formats work on a mobile screen, as buyers don’t have reliable ROI data and the advertising networks continue to struggle to deliver precise targeting, stymied by multiple barriers, such as privacy fears, walled gardens and bandwidth constraints. As a result, there is widespread dissatisfaction among both media buyers and consumers with mobile advertising. The mobile advertising market needs robust tools and processes – standardised, proven formats and reliable, trusted metrics – to will enable brands to purchase advertising at scale and with confidence.

Some media buyers are looking for solutions that make the delivery of digital advertising more transparent to consumers, so they have a clearer understanding of why they are seeing a particular advert.

To address these issues, telcos, looking to broker advertising, need to create better platforms that are easy for media buyers to access, offer precise targeting and provide transparent metrics that are straightforward to monitor. Despite the formation of telco marketing and advertising joint ventures in some markets, such as the U.K., some advertising executives believe telcos don’t see a big enough revenue opportunity to build these platforms.

Instead of brand building and customer acquisition, which is the traditional use of mass advertising, it seems likely that the mobile channel will be used primarily for customer loyalty and retention. So-called active advertising (advertising that is designed to enable the individual to complete a specific task) may be well suited to mobile devices, which people typically use to get something done. As attention spans are short and screen space is limited in the mobile medium, the advertising value chain will need to change its mindset to put the needs of the consumer, rather than the brand, front and centre.

Big data – how to monetize?

The Brainstorm reinforced the sense that big data/personal data has the potential to create exceptional insights and disruptive new business models. But most people working in this space only have a high-level, theoretical view of how this might happen, rather than a collection of compelling case studies and use cases. Finding big data projects offering a respectable return on investment is going to be a hit and miss affair, requiring an open mind and the patience to experiment.

Although self-authenticated data could potentially make advertising and marketing more efficient, it may also increase transparency for consumers: The Internet has given consumers more control and is driving deflation in many sectors. The rise of personal data could have negative implications for companies’ profit margins as consumers use vendor relationship management systems to systematically secure the best price.

Many start-ups seem to still be pursuing advertising-funded business models, but big data and personal data business models may depend on a different approach. They should be asking: “How do you fund a search engine that is not ad-funded and can social networks not be ad-funded?” Computational contracts, which machines can execute and people can actually understand, could be part of the answer. Rather than trying to infer interests and movements, a social network might explicitly ask the following question. “If you give me your location and the brands you like, I’ll give you two coupons a day.” This is basically the Placecast model, which seems to be gaining traction in some markets. In any case, telcos and banks could and should use transparent and user-friendly privacy policies as a competitive weapon against Facebook and Google, which currently dominate the online advertising market.

The concept of companies interacting with individuals through the web presence of their objects, such as their car, their bike or their pet, seems sound. Both individuals and companies could benefit from a two-way flow of information around these objects. For example, a consumer with a specific make of printer or camera could benefit from personalised and timely discounts on accessories, such as cartridges and lenses.

Next steps for STL Partners

We will:

  • Continue to research and explore ‘Digital Commerce’ at our Executive Brainstorms, with particular emphasis on practical steps to create the Digital Wallet, enable ‘SoMoLo’, and the key role of personal data and trust frameworks;
  • Look further into the needs and applications of ‘Big Data’ into the field, as well as continuing our involvement in the World Economic Forum’s (WEF) work on Trust Networks for personal data;
  • Publish further research on the business case for personal data, and a full Strategy Report on the Digital Commerce area.


To read the note in full, including the following sections detailing additional analysis…

  • Closing the loop between advertising and payments
  • First stimulus presentation
  • Second stimulus presentation
  • Innovation showcase
  • Brainstorm
  • Key takeaways
  • Advertising & Marketing: Radical Game Change Ahead
  • First and Second stimulus presentations
  • Final stimulus presentation
  • Brainstorm
  • Key takeaways
  • Session 3: Big Data – Exploiting the New Oil for the New Economy
  • Stimulus Speakers and Panellists
  • Stimulus presentations
  • Voting, feedback, discussions
  • Key takeaways

…and the following figures…

  • Figure 1 – Customer Data is at the centre of Digital Commerce
  • Figure 2 – What will North American consumers value most from digital commerce?
  • Figure 3- Leading players’ strengths and weaknesses upstream and downstream
  • Figure 4 – The key elements of the digital commerce flywheel
  • Figure 5 – Vast majority of commerce is still offline
  • Figure 6 – Linking location-based offers to payment cards
  • Figure 7 – Participants’ views on likely winners in ‘local’ digital commerce
  • Figure 8 – Mobile ad spend doesn’t reflect the time people spend in this medium
  • Figure 9 – What does the advertising industry need to do to stay relevant?
  • Figure 10 – Why personal data isn’t like oil
  • Figure 11 – A strawman process for personal data
  • Figure 12 – A decentralised architecture for the Internet of My Things
  • Figure 13 – Kynetx: companies can connect through ‘things’

Members of the Telco 2.0 Executive Briefing Subscription Service and the Dealing with Disruption Stream can download the full 35 page report in PDF format here. Non-Members, please subscribe here. Digital Commerce strategies and the findings of this report will also be explored in depth at the EMEA Executive Brainstorm in London, 5-6 June, 2013. For this or any other enquiries, please email contact@telco2.net / call +44 (0) 207 247 5003.

Background & Further Information

Produced and facilitated by business innovation firm STL Partners, the Silicon Valley 2013 event brought together 150 specially-invited senior executives from across the communications, media, retail, banking and technology sectors, including:

  • Apigee, Arete Research, AT&T,ATG, Bain & Co, Beecham Research, Blend Digital Group, Bloomberg, Blumberg Capital, BMW, Brandforce, Buongiorno, Cablelabs, CenturyLink, Cisco, CITI Group, Concours Ventures, Cordys, Cox Communications, Cox Mobile, CSG International, Cycle Gear, Discovery, DoSomething.Org, Electronic Transactions Association, EMC Corporation, Epic, Ericsson, Experian, Fraun Hofer USA, GE, GI Partners, Group M, GSMA, Hawaiian Telecom, Huge Inc, IBM, ILS Technology, IMI Mobile Europe, Insight Enterprises, Intel, Ketchum Digital, Kore Telematics, Kynetx, MADE Holdings, MAGNA Global, Merchant Advisory Group, Message Systems, Microsoft, Milestone Group, Mimecast, MIT Media Lab, Motorola, MTV, Nagra, Nokia, Oracle, Orange, Panasonic, Placecast, Qualcomm, Rainmaker Capital, ReinCloud, Reputation.com, SalesForce, Samsung, SAP, Sasktel, Searls Group, Sesame Communications, SK Telecom Americas, Sprint, Steadfast Financial, STL Partners/Telco 2.0, SystemicLogic Ltd., Telephone & Data Systems, Telus, The Weather Channel, TheFind Inc, T-Mobile USA, Trujillo Group LLC, UnboundID, University of California Davis, US Cellular Corp, USC Entertainment Technology Center, Verizon, Virtustream, Visa, Vodafone, Wavefront, WindRiver, Xtreme Labs.

Around 40 of these executives participated in the ‘Digital Commerce’ session.

The Brainstorm used STL’s unique ‘Mindshare’ interactive format, including cutting-edge new research, case studies, use cases and a showcase of innovators, structured small group discussion on round-tables, panel debates and instant voting using on-site collaborative technology.

We’d like to thank the sponsors of the Brainstorm:
Silicon Valley 2013 Sponsors

Digital Commerce: Show me the (Mobile) Money

Introduction

STL defines Digital Commerce 2.0 as the use of new digital and mobile technologies to bring buyers and sellers together more efficiently and effectively. Fast growing adoption of mobile, social and local services is opening up opportunities to provide consumers with highly-relevant advertising and marketing services, underpinned by secure and easy-to-use payment services. By giving people easy access to information, vouchers, loyalty points and electronic payment services, smartphones can be used to make shopping in bricks and mortar stores as interactive as shopping through web sites and mobile apps.

To read the note in full, including the following sections detailing additional analysis…

  • Executive Summary
  • Overcoming the Barriers
  • 1. Understand the marketplace you are operating in
  • 2. Develop compelling service offerings
  • 3. The value network
  • 4. Technology
  • 5. Finance – the high-level business model
  • Conclusions and next steps
  • About STL Partners

…and the following figures…

  • Figure 1 – The Cycle and Functions of Digital Commerce
  • Figure 2 – Mobile wallets will take time to gain traction
  • Figure 3 – The mobile commerce flywheel
  • Figure 4 – The STL Partners Business Model Framework
  • Figure 5 – For banked consumers, digital wallets mainly offer convenience
  • Figure 6 – For the unbanked, digital wallets offer convenience and some savings
  • Figure 7 – For merchants, digital wallets help build deeper customer relationships
  • Figure 8 – Telcos’ potential revenue streams from a digital commerce service
  • Figure 9 – Telcos’ potential major costs in launching a digital commerce service
  • Figure 10 – Telcos’ mobile commerce revenues are likely to be modest
  • Figure 11 – Telcos have regular customer contact and real-time data
  • Figure 12 – Potential strategic actions for telcos
  • Figure 13 – Leading Internet companies have global reach and scale
  • Figure 14 – Potential strategic actions for Internet players
  • Figure 15 – Banks have local knowledge, payment networks trusted brands
  • Figure 16 – Potential strategic actions for banks and payment networks

Facebook Home: what is the impact?


Summary: Facebook has launched ‘Facebook Home’, technically a shell around the Android OS, that in theory creates valuable new advertising inventory on the screens of users’ phones. What will its impact be in practice for Facebook, and on Google, mobile operators, and other device manufacturers? (April 2013, Foundation 2.0, Executive Briefing Service, Dealing with Disruption Stream.) Facebook Home 'Coverfeed' April 2013
  Read in Full (Members only)   To Subscribe click here

Below is an extract from this 15 page Telco 2.0 Briefing Report that can be downloaded in full in PDF format by members of the Telco 2.0 Executive Briefing service and the Dealing with Disruption Stream here. We’ll also be discussing the impact of ‘OTT’ and internet player services on other industries at our Executive Brainstorms on London (5-6 June) and Dubai (12-13 Nov). Non-members can subscribe here and for this and other enquiries, please email contact@telco2.net / call +44 (0) 207 247 5003.

Introduction

On April 4th 2013, Mark Zuckerberg, Facebook’s CEO, launched a new mobile service named Facebook Home. In this executive briefing we examine the new service especially in regard to the impact on Facebook and other players in the mobile value chain.

What is Facebook Home?

Facebook has essentially rewritten the Android user experience giving its services prominence. Technically, it is a shell around Android. In computing circles, this is nothing new. The first version of Windows was effectively a shell above MS-DOS and most versions of the open source Linux have various shells that can be installed.

Facebook Home consists of three main features:

‘Coverfeed’

Figure 1 – Facebook Home ‘Coverfeed’
Facebook Home 'Coverfeed' April 2013

Source: Facebook Home Marketing Material

This feature turns the phone’s home screen into a Facebook news feed, continually updated as friends advertise their status and advertisers promote their wares. Interestingly, none of images show the signal strength, battery life and network operator indicators features on traditional phones.

Chat Heads

Figure 2 – Facebook Home ‘Chat Heads’
Facebook Home ‘Chat Heads’ (April 2013)

Source: Facebook Home Marketing Material

The unimaginatively named ‘Chat Heads’ is basically a messaging service with very similar features to iMessage. ChatHead-to-Chathead messages are sent on the Facebook network free of charge and if a user is not on Chathead then a SMS message is sent. Presumably at some date in future, this feature will be integrated with the desktop version of Facebook, probably with Voice calling features. Basically, it is a competitor to both traditional MNO voice and messaging services and OTT players such as WhatsApp.

App Launcher

Figure 3 – Facebook Home ‘Applauncher’
Home ‘Applauncher’ (April 2013)

Source: Facebook Home Marketing Material

The ‘AppLauncher’ feature is pretty self explanatory and provides access to non-Facebook services. The feature is neither earth shattering in its beauty nor its UI innovation, but Facebook has chosen this approach for a reason.

The advantage for Facebook of AppLauncher is that it can collect more data on other companies’ applications, even those where the users do not use Facebook Login.

Facebook’s strategy

Strategic context

Our consistent view of Facebook is that justifying a sky-high valuation is its biggest problem. Significant actual or realistically anticipated revenue growth is essential to support even our maximum valuation of $30Bn. Facebook current enterprise valuation (EV) is US$54bn which is calculated from a market capitalisation of US$64Bn less US$10Bn in cash. Nothing has substantially changed to alter our view and therefore we still believe Facebook is overvalued.

In our view the development of Facebook Home is effectively an admission that a mobile application alone will not deliver enough revenues. The stagnation of its share price indicates that the stock market is not really convinced at the moment by Facebook’s prospects.

Figure 4 – Facebook Vs Google Valuations


Facebook and Google Share Price April 2013
Souirce: Bigcharts.com

Mark Zuckerberg said in the Facebook Home launch event that Android users spent on average 23% of their time using the Facebook application. At first glance, this appears to be quite a large figure, and it deserves a little attention:

  • Does this figure include the huge base of Chinese Android users where Facebook is banned or is it just a USA figure? 
  • How does Facebook know time spent on other applications?
  • Is it actual traffic or service based? Does Facebook include more traditional phone applications such as voice and messaging in the figure? 

Despite these vagaries, Facebook with its Facebook Home service is effectively making the phone available 100% of the time to advertisers and thereby vastly increasing its inventory.

The value of this inventory is a completely different matter. Increasing supply without an associated increase in demand from brands will only depress unit pricing. Increased demand will only be brought about when the effectiveness of the advertising is proven to the brands. For Facebook, and the nascent mobile advertising industry overall, this is the greatest challenge: proving the effectiveness of mobile advertising to brands so that demand sharply increases.

Distribution

The other side of the equation is distribution – how can Facebook Home gather as many users as possible? We see three possible answers:

  1. By preloading on certain handsets. One of the launch partners is HTC and the Facebook Home shell will be available on some of their models in the USA on AT&T and in parts of Europe on the Orange network. This is the tried and tested ‘slowly but surely’ approach to distribution: convince OEM’s and MNO’s that the Facebook approach adds value and let them bundle the service with hardware and access packages. 
  2. By making the Facebook Home application available in the various App Stores. At the launch, Facebook indicated that the application would be rolled out gradually on a device-by-device basis. This is a major problem with Android fragmentation because developers effectively have to customise each Application for each individual device. Data from Google indicates the level of fragmentation. This data shows two axis of fragmentation: android version and screen size. But there is an additional axis which is the specific OEM API’s which vary by manufacturer and device. Of course, the user also has to be convinced to download the application. 
  3. By making Facebook Home the only way to access Facebook on Android. This was not mentioned at launch, but is the fastest way to ensure adoption. The big risk is of course that users do not like Facebook Home and prefer the old application. The more casual the Facebook user, the higher the risk of them not liking the persistent nature of Coverfeed and therefore Facebook risks alienating these users and driving them to consider alternate social networks. 

Overall, it is our view that Facebook have taken a conservative approach to distribution, but if the data from early adopters is positive then Facebook could shift to the far more aggressive third option.

Privacy concerns: a big issue or not?

Facebook was noticeably silent at the launch event around what data they would be collecting from the service and adding to their social graph or profile of their customers. There are significant privacy concerns with Facebook in some parts of the market that have been illustrated by Om Malik, for example. Facebook Home only strengthens the need for transparency around personal data which we will be exploring further at the EMEA Executive Brainstorm, 5-6 June 2013 in London.

Our view is that Facebook’s current privacy strategy of “Do it now, ask permission later” is fatally flawed and unsustainable. We are already seeing in the marketplace competitors, especially Apple and Microsoft, adopting different stances and the regulators are taking an interest. Change is coming to “Wild West of Internet Privacy” and both Google and Facebook may not like the new sheriffs.

Brendan Lynch, Chief Privacy Officer, Microsoft:

“Because consumers are telling us they care a lot about privacy, there are market forces at play. And we will see a lot more innovation in the privacy space. Our marketing campaign has become an evolution of that – consumers are telling us they are concerned about how data is being used online.” (See here.)

Nellie Kroes, Vice President of the European Commission:

“because of the high value attached to privacy, we are less shocked by default settings that are restrictive than by those which are wide open – especially as regards more vulnerable users. In line with this, we are working with industry to improve the ways default privacy settings can protect children.” (See here.)

To read the note in full, including the following sections detailing additional analysis…

  • How many users can Facebook Home acquire?
  • Cheap and Cheerful is a good way to experiment
  • Impact on other players
  • Google: how to manage the threat to Android?
  • Device Manufacturers: more difficult questions to address
  • Operators: must accelerate mobile advertising plans
  • Conclusions

…and the following figures…

  • Figure 1 – Facebook Home ‘Coverfeed’
  • Figure 2 – Facebook Home ‘Chat Heads’
  • Figure 3 – Facebook Home ‘Applauncher’
  • Figure 4 – Facebook Vs Google Valuations
  • Figure 5 – Facebook Active Users
  • Figure 6 – Facebook Mobile Users – distribution by OS
  • Figure 7 – The Rise and Fall of HTC Revenues


Digital platform strategy: how Google, Apple and Amazon keep winning

From isolated innovations to an integrated platform

For the last six years, STL Partners has been working with telcos and their partners on the development of a new telecoms business model – ‘Telco 2.0’.  We have undertaken a significant amount of research into what Telco 2.0 could look like and explored in ‘The 2-Sided Telecoms Market Opportunity’ and ‘The Roadmap to New Telco 2.0 Business Models’, and other key research, how telcos can:

We have now published Part 1 of A Practical Guide to Implementing Telco 2.0 which focuses principally on how to implement Telco 2.0.  It gathers some of the techniques and lessons that STL Partners has been deploying with clients that are now implementing Telco 2.0.

The following edited extract, available in full to members of the Executive Briefing Service, explains the danger of considering each of the six Telco 2.0 opportunity areas as a separate value source by exploring the platform strategies of the internet players such as Google, Apple, Facebook, Amazon and Microsoft.  It illustrates how some areas lose money and how this ‘loss-lead’ approach makes sense as long as the overall value of the platform rises, and concludes that telcos must think about opportunities in an integrated ‘joined up’ way.

Telcos’ strategic environment is tough

In a tough global economy, with many telco markets rapidly reaching maturity, and facing competition from so-called ‘Over-The-Top’ (OTT) communications services, telcos face some difficult trading conditions.

In Euro telcos: fiddling while the platform burns? we shared an early sight of forecasts we’re working on of core services revenues, showing a fairly pessimistic snapshot of long term revenue decline (in this instance, based on UK revenues). In research conducted for the strategy report Dealing with the ‘Disruptors’: Google, Apple, Facebook, Microsoft/Skype and Amazon we found that many industry senior execs believe that a major cause of the revenue decline were so-called ‘Over-The-Top’ (OTT) players.

Figure 1 – The predicted impact of ‘OTT’ players on telcos’ core business

OTT Players Impact
Source: Dealing with the ‘Disruptors’: Google, Apple, Facebook, Microsoft/Skype and Amazon


Against this tough background, most telco CEOs appreciate that they cannot just cut their businesses to growth (or even maintenance for some) – they need new sources of value creation.

(NB. The concept of ‘Telco 2.0’ is not confined to the potential growth areas, but about enabling the telco business model to adapt and survive overall, as described in detail in Telco 2.0: Killing Ten Misleading Myths and The Roadmap to New Telco 2.0 Business Models.)

Figure 2 – Generic telco strategies

Generic Telco Strategies
Source: A Practical Guide to Implementing Telco 2.0


In this article we focus on new service strategies, and the six coloured columns on the right of the chart above refer to the six Telco 2.0 Opportunity Areas, which as a reminder are:
  • Extending and enhancing existing core services – voice, messaging, data, content – to deliver more value to customers.
  • Developing bespoke communications and IT solutions for specific vertical industries.
  • Leveraging infrastructure more effectively to improve the customer experience (offer greater speed and responsiveness) while reducing cost (offloading traffic onto cheaper networks) and generating new revenue (‘onloading’ traffic from more expensive networks).
  • Distributing existing products and services via new channels and to new customers such as embedding voice and other communications services within enterprise business processes or bundling connectivity in with consumer products (this includes some M2M applications).
  • Deploying assets including identity and authentication capabilities and customer data to both improve customers’ experience of existing core services and develop valuable new enabling services for third-party enterprises and consumers.
  • Developing products and services that are largely own brand ‘OTT’ – independent of the network.


Current telco approach: silos of growth

As we have also illustrated previously, there are many new services within the six Telco 2.0 opportunity areas which can generate value for telcos.

Figure 3 – Examples of the six Telco 2.0 Opportunity Types

Examples of the six Telco 2.0 Opportunity Types
Source: The Roadmap to New Telco 2.0 Business Models

But it is highly unlikely that every service, even if ‘successful’ in terms of becoming big and popular, will directly generate revenue.  Indeed, some services should be designed from the outset to be free and loss-making for the telco. Why?  Because by doing this the telco can generate more value in other areas. Google does this with free search for consumers – it makes more money from advertisers owing to high search volumes.

Many telco managers simply do not appreciate this point.  In telcos, each and every service tends to evaluated independently and if it does not meet stringent business case benchmarks, it is not progressed.  This tends to lead to some creative use of pricing and volume assumptions in many business cases to ensure that services get over the hurdle.

To see why this is misguided, it is helpful to think of current and future telco services as part of a digital value chain (as in Figure 4 below). There are devices, operating systems and applications (first segment of the value chain) that use data connectivity (second segment) for a range of applications and services such as advertising and marketing, the sale of physical goods and digital content, making payments and delivering enterprise solutions.  Voice and messaging too is increasingly become another data service and this is set to increase as IP networks become end-to-end on fixed and mobile.

As already noted, each of the telco opportunity areas contain services that can be offered in different segments of the value chain:

  • Voice and messaging are the traditional Core Services and digital content is the area into which many telcos have sought to extend.
  • Vertical Industry Solutions seek to mash-up data and voice and messaging with enterprise IT systems to develop bespoke services.
  • In Infrastructure Services, telcos will seek to make their data networks and voice and messaging capabilities available to other telcos on a wholesale basis.
  • Data and voice and messaging, as well as enterprise applications will similarly be made available to businesses seeking to integrate them into their core offerings in Embedded Communications.
  • Telcos are seeking to leverage their customer data and media inventory to offer advertising  and marketing solutions and their authentication and collection capabilities to deliver payment services as Third-party Business Enablers.
  • Finally, software skills will be required to offer a range of digital solutions similar to those from the OTT players in Own-brand OTT Services.

Essentially, telcos can theoretically offer a one-stop shop for consumers and enterprises across the digital value chain.  The challenge at the moment is that telcos think of each service, and each stage of the value chain, as a profitable new revenue source.  Services are thus created in silos with little thought given to the customer experience across the value chain and, importantly, to the creation of value across all stages of the chain.

As Figure 4 shows, telcos see opportunities for value creation in every single value chain segment (although not every opportunity area covers every segment).

Figure 4 – Telcos see opportunities to create value in every value chain segment

Telcos see opportunities to create value in every value chain segment
Source: A Practical Guide to Implementing Telco 2.0

1. Devices, OS, apps & software have been placed in brackets because the handset subsidies that telcos offer for devices could be construed as a source of profitable revenue or as an enabler of data and voice and messaging revenues depending how they are priced and accounted for.

Why does it matter that telcos are seeking to generate profitable growth in each segment of the value chain?  After all, profit for shareholders is the ultimate goal.  The problem with this strategy stems from the integrated platform strategies of the internet players – and the challenges of competing with them.

Content:
  • From isolated innovations to an integrated platform
  • Telcos’ strategic environment is tough
  • Current telco approach: silos of growth
  • The integrated platforms of the internet co-opetition
  • Conclusions – key lessons for telcos
  • Figure 1 – The predicted impact of ‘OTT’ players on telcos’ core business
  • Figure 2 – Generic telco strategies
  • Figure 3 – Examples of the six Telco 2.0 Opportunity Types
  • Figure 4 – Telcos see opportunities to create value in every value chain segment
  • Figure 5 – Internet giants are pursuing platform strategies
  • Figure 6 – Time is running out for telcos

Mobile TV: going ‘Round The Side’ of telco networks?

Summary: Dyle TV, a new mobile TV broadcast network (supported by Fox), was presented at the Silicon Valley Brainstorm against the backdrop of Cisco’s VNI (Visual Networking Index) research on forecast growth in mobile video traffic. It was argued that Dyle’s model can both take the pressure off mobile operator data capacity by taking video traffic ‘round the side’ and make good use of TV Broadcasters’ spectrum. Could this model work, not only in the US but elsewhere around the world? (May 2012, Executive Briefing Service)

Dyle Mobile TV Image Telco 2.0

  Read in Full (Members only)  Buy a single user license online  To Subscribe click here

Below is an extract from this 19 page Telco 2.0 Report that can be downloaded in full in PDF format by members of the Telco 2.0 Executive Briefing service here. Non-members can subscribe here, buy a Single User license for this report online here for £595 (+VAT for UK buyers), or for multi-user licenses or other enquiries, please email contact@telco2.net / call +44 (0) 207 247 5003. We’ll also be discussing our findings at the London (12-13 June) New Digital Economics Brainstorm.

To share this article easily, please click:


Background

This is an extract of the analysis of a session at the Digital Entertainment 2.0 stream of the Silicon Valley New Digital Economics Executive Brainstorm, that took place on the 28th March, 2012. Using a widely acclaimed interactive format called ‘Mindshare’, the Digital Entertainment 2.0 stream enabled specially-invited senior executives from across the communications, entertainment and technology sectors to discuss and explore key strategic issues on the theme of ‘New Business Models in a multi-screen, 3D/HD, mobile world’. Presentations from the event can be found here and further STL Partners research on entertainment and content can be found here.

Mobile Video: How to Reduce Complexity

The hypothesis explored at this session (one of three) was that content owners and carriers want to deliver live video content to their customers but face significant barriers: hundreds of device types, various network conditions, bandwidth congestion, hundreds of simultaneous sessions, and a painful workflow.

Key questions:

  • How are new devices, formats and enabling technologies improving the situation?
  • What use cases are most compelling – for different markets, in different geographies?
  • What are the viable cost models? 
 
Presenters and Panellists:
  • Chris Osika, Senior Director IBSG, Cisco Systems presented an overview of Cisco’s VNI study of the future impact of video on communications networks;
  • Erik Moreno, SVP, Corporate Development, Fox Networks Group, presented on Dyle TV, a new innovation in Mobile TV in the US market; 
  • Andre James, Partner, Media Practice, Bain, also joined the panel.

The session was hosted and moderated by Andrew Collinson, Research Director, STL Partners. This Briefing summarises some of the high-level findings and includes the verbatim output of the brainstorm.

Stimulus presentations

Cisco’s VNI Study

Opening the session, Chris Osika, Senior Director IBSG, Cisco Systems, gave some background to mobile broadband data growth and especially video traffic, citing Cisco’s own VNI (Visual Networking Index) forecasts. As well as a summary of top-level findings below, here is a video of his presentation in full.


He covered changing end-user behaviours and business models in the TV and video sectors, citing tablets, multi-tasking and “TV Everywhere” services as catalysts of change, and you can see a video of this presentation below.

Figure 1 – Cisco VNI forecast growth of mobile data traffic

Mobile TV 'Round the Side' Telco 2.0 image

Source: Cisco
[Note: STL Partners will shortly be issuing its own analysis of the new Cisco VNI mobile data forecasts]

Counter-intuitively, he disagreed with part of the central notion of “Social TV”, stating that while consumers might use two devices simultaneously, it will likely be for two different experiences, not a single converged one. He also touched on the risks of video “breaking the network”, and subtly introduced the idea of using WiFi for offload, suggesting that this might be part of a service provider’s arsenal (rather than driven by the user, as is currently typical).

Figure 2 – Adoption of tablets & other examples of new consumer behaviour

Mobile TV 'Round the Side' Telco 2.0 image Fig 2

Source: Cisco

Dyle TV

Next, Erik Moreno, SVP Corporate Development, Fox Networks Group, introduced Dyle, a new partnership for mobile TV which Fox is working on with partners such as Comcast/xfinity. (Currently, five out of the top 7 US broadcast networks are participating – excluding ABC and CBS at present). It intends to use existing broadcasting technology to provide live TV onto mobile devices (including tablets & automotive screens). In essence, this is another attempt to create a mobilised version of broadcast (this technology is called ATSC-MH), complete with new chipsets to be included into handsets, and apps to decrypt and play back content. 

Figure 3 – An introduction to the Dyle mobile TV business model & technology

Mobile TV 'Round the Side' Telco 2.0 image Fig 3

Source: Fox Networks

However, unlike previous misadventures in mobile TV (think DVB-H in Europe, and Qualcomm’s MediaFlo network in the US), this time Dyle might be able to exploit a changing consumer behaviour mindset about on-the-go content (e.g. on tablets), coupled with different economics to 3G/4G usage – i.e. no data caps – as well as smarter and more user-friendly devices. Also, initially Dyle will be free-to-air, rather than demanding upfront monthly subscriptions, which has proven a major obstacle for occasional users.

He discussed the complexities of getting the service to market, juggling 11 different partnerships, cutting deals with content publishers, obtaining the first ATSC-MH integrated handset (from Samsung), starting build-out in 32 initial markets, gaining a distribution deal with MetroPCS and outlining its future roadmap such as an iPad antenna accessory from Belkin.

Figure 4 – Dyle mobile TV form-factors

Mobile TV 'Round the Side' Telco 2.0 image Fig 4

Source: Dyle

He sees four potential future revenue streams

  • Direct to consumer, which he thinks is “hard”
  • Wrapped up into MVPD services from cable companies wanting to offer TV Everywhere propositions
  • Targeted advertising – potentially location-based as well as individualised.
  • Distributed as an add-on to telcos’ voice and data plans

Figure 5 – Dyle has multiple business & distribution models

Mobile TV 'Round the Side' Telco 2.0 image Fig 5

Source: Fox Networks

Mr Moreno said that for mobile, “IP networks don’t scale” – especially for multiple viewers of live TV in the same location.

As part of the business rationale for Dyle, STL Partners thinks that it could help the TV industry justify continued ownership of spectrum in the face of a concerted effort by the telecoms industry to push regulators to repurpose it for mobile broadband.

To read this report in full, including…

  • Background
  • Mobile Video: How to Reduce Complexity
  • Stimulus presentations
  • Cisco’s VNI Study
  • Dyle TV
  • Panel Discussion & Delegate Input
  • Audience Q&As on presentations
  • Panel Discussion
  • Will Dyle work in the US and elsewhere? (Votes by region)
  • Verbatim delegate questions
  • What are the compelling mobile device video use cases? 
  • Conclusions and next steps
  • Key takeaways
  • Next steps

… and the following figures….

  • Figure 1 – Cisco VNI forecast growth of mobile data traffic
  • Figure 2 – Adoption of tablets & other examples of new consumer behaviour
  • Figure 3 – An introduction to the Dyle mobile TV business model & technology
  • Figure 4 – Dyle mobile TV form-factors
  • Figure 5 – Dyle has multiple business & distribution models
  • Figure 6 – Vote on Dyle model in the US
  • Figure 7 – Vote on Dyle model in Europe
  • Figure 8 – Vote on Dyle model in Asia

Members of the Telco 2.0 Executive Briefing Subscription Service can download the full 24 page report in PDF format hereNon-Members, please subscribe here, buy a Single User license for this report online here for £595 (+VAT for UK buyers), or for multi-user licenses or other enquiries, please email contact@telco2.net / call +44 (0) 207 247 5003.

Key terms referenced: Cisco, Dyle. Mobile TV, mobile operators, telcos, US, Europe, Asia, MediaFlo, VNI.

Broadband 2.0: Mobile CDNs and video distribution

Summary: Content Delivery Networks (CDNs) are becoming familiar in the fixed broadband world as a means to improve the experience and reduce the costs of delivering bulky data like online video to end-users. Is there now a compelling need for their mobile equivalents, and if so, should operators partner with existing players or build / buy their own? (August 2011, Executive Briefing Service, Future of the Networks Stream).
Telco 2.0 Mobile CDN Schematic Small
  Read in Full (Members only)    Buy This Report    To Subscribe

Below is an extract from this 25 page Telco 2.0 Report that can be downloaded in full in PDF format by members of the Telco 2.0 Executive Briefing service and Future Networks Stream here. Non-members can buy a Single User license for this report online here for £595 (+VAT) or subscribe here. For multiple user licenses, or to find out about interactive strategy workshops on this topic, please email contact@telco2.net or call +44 (0) 207 247 5003.

To share this article easily, please click:

//

Introduction

As is widely documented, mobile networks are witnessing huge growth in the volumes of 3G/4G data traffic, primarily from laptops, smartphones and tablets. While Telco 2.0 is wary of some of the headline shock-statistics about forecast “exponential” growth, or “data tsunamis” driven by ravenous consumption of video applications, there is certainly a fast-growing appetite for use of mobile broadband.

That said, many of the actual problems of congestion today can be pinpointed either to a handful of busy cells at peak hour – or, often, the inability of the network to deal with the signalling load from chatty applications or “aggressive” devices, rather than the “tonnage” of traffic. Another large trend in mobile data is the use of transient, individual-centric flows from specific apps or communications tools such as social networking and messaging.

But “tonnage” is not completely irrelevant. Despite the diversity, there is still an inexorable rise in the use of mobile devices for “big chunks” of data, especially the special class of software commonly known as “content” – typically popular/curated standalone video clips or programmes, or streamed music. Images (especially those in web pages) and application files such as software updates fit into a similar group – sizeable lumps of data downloaded by many individuals across the operator’s network.

This one-to-many nature of most types of bulk content highlights inefficiencies in the way mobile networks operate. The same data chunks are downloaded time and again by users, typically going all the way from the public Internet, through the operator’s core network, eventually to the end user. Everyone loses in this scenario – the content publisher needs huge servers to dish up each download individually. The operator has to deal with transport and backhaul load from repeatedly sending the same content across its network (and IP transit from shipping it in from outside, especially over international links). Finally, the user has to deal with all the unpredictability and performance compromises involved in accessing the traffic across multiple intervening points – and ends up paying extra to support the operator’s heavier cost base.

In the fixed broadband world, many content companies have availed themselves of a group of specialist intermediaries called CDNs (content delivery networks). These firms on-board large volumes of the most important content served across the Internet, before dropping it “locally” as near to the end user as possible – if possible, served up from cached (pre-saved) copies. Often, the CDN operating companies have struck deals with the end-user facing ISPs, which have often been keen to host their servers in-house, as they have been able to reduce their IP interconnection costs and deliver better user experience to their customers.

In the mobile industry, the use of CDNs is much less mature. Until relatively recently, the overall volumes of data didn’t really move the needle from the point of view of content firms, while operators’ radio-centric cost bases were also relatively immune from those issues as well. Optimising the “middle mile” for mobile data transport efficiency seemed far less of a concern than getting networks built out and handsets and apps perfected, or setting up policy and charging systems to parcel up broadband into tiered plans. Arguably, better-flowing data paths and video streams would only load the radio more heavily, just at a time when operators were having to compress video to limit congestion.

This is now changing significantly. With the rise in smartphone usage – and the expectations around tablets – Internet-based CDNs are pushing much more heavily to have their servers placed inside mobile networks. This is leading to a certain amount of introspection among the operators – do they really want to have Internet companies’ infrastructure inside their own networks, or could this be seen more as a Trojan Horse of some sort, simply accelerating the shift of content sales and delivery towards OTT-style models? Might it not be easier for operators to build internal CDN-type functions instead?

Some of the earlier approaches to video traffic management – especially so-called “optimisation” without the content companies’ permission of involvement – are becoming trickier with new video formats and more scrutiny from a Net Neutrality standpoint. But CDNs by definition involve the publishers, so potentially any necessary compression or other processing can be collaboratively, rather than “transparently” without cooperation or willingness.

At the same time, many of the operators’ usual vendors are seeing this transition point as a chance to differentiate their new IP core network offerings, typically combining CDN capability into their routing/switching platforms, often alongside the optimisation functions as well. In common with other recent innovations from network equipment suppliers, there is a dangled promise of Telco 2.0-style revenues that could be derived from “upstream” players. In this case, there is a bit more easily-proved potential, since this would involve direct substitution of the existing revenues already derived from content companies, by the Internet CDN players such as Akamai and Limelight. This also holds the possibility of setting up a two-sided, content-charging business model that fits OK with rules on Net Neutrality – there are few complaints about existing CDNs except from ultra-purist Neutralists.

On the other hand, telco-owned CDNs have existed in the fixed broadband world for some time, with largely indifferent levels of success and adoption. There needs to be a very good reason for content companies to choose to deal with multiple national telcos, rather than simply take the easy route and choose a single global CDN provider.

So, the big question for telcos around CDNs at the moment is “should I build my own, or should I just permit Akamai and others to continue deploying servers into my network?” Linked to that question is what type of CDN operation an operator might choose to run in-house.

There are four main reasons why a mobile operator might want to build its own CDN:

  • To lower costs of network operation or upgrade, especially in radio network and backhaul, but also through the core and in IP transit.
  • To improve the user experience of video, web or applications, either in terms of data throughput or latency.
  • To derive incremental revenue from content or application providers.
  • For wider strategic or philosophical reasons about “keeping control over the content/apps value chain”

This Analyst Note explores these issues in more details, first giving some relevant contextual information on how CDNs work, especially in mobile.

What is a CDN?

The traditional model for Internet-based content access is straightforward – the user’s browser requests a piece of data (image, video, file or whatever) from a server, which then sends it back across the network, via a series of “hops” between different network nodes. The content typically crosses the boundaries between multiple service providers’ domains, before finally arriving at the user’s access provider’s network, flowing down over the fixed or mobile “last mile” to their device. In a mobile network, that also typically involves transiting the operator’s core network first, which has a variety of infrastructure (network elements) to control and charge for it.

A Content Delivery Network (CDN) is a system for serving Internet content from servers which are located “closer” to the end user either physically, or in terms of the network topology (number of hops). This can result in faster response times, higher overall performance, and potentially lower costs to all concerned.

In most cases in the past, CDNs have been run by specialist third-party providers, such as Akamai and Limelight. This document also considers the role of telcos running their own “on-net” CDNs.

CDNs can be thought of as analogous to the distribution of bulky physical goods – it would be inefficient for a manufacturer to ship all products to customers individually from a single huge central warehouse. Instead, it will set up regional logistics centres that can be more responsive – and, if appropriate, tailor the products or packaging to the needs of specific local markets.

As an example, there might be a million requests for a particular video stream from the BBC. Without using a CDN, the BBC would have to provide sufficient server capacity and bandwidth to handle them all. The company’s immediate downstream ISPs would have to carry this traffic to the Internet backbone, the backbone itself has to carry it, and finally the requesters’ ISPs’ access networks have to deliver it to the end-points. From a media-industry viewpoint, the source network (in this case the BBC) is generally called the “content network” or “hosting network”; the destination is termed an “eyeball network”.

In a CDN scenario, all the data for the video stream has to be transferred across the Internet just once for each participating network, when it is deployed to the downstream CDN servers and stored. After this point, it is only carried over the user-facing eyeball networks, not any others via the public Internet. This also means that the CDN servers may be located strategically within the eyeball networks, in order to use its resources more efficiently. For example, the eyeball network could place the CDN server on the downstream side of its most expensive link, so as to avoid carrying the video over it multiple times. In a mobile context, CDN servers could be used to avoid pushing large volumes of data through expensive core-network nodes repeatedly.

When the video or other content is loaded into the CDN, other optimisations such as compression or transcoding into other formats can be applied if desired. There may also be various treatments relating to new forms of delivery such as HTTP streaming, where the video is broken up into “chunks” with several different sizes/resolutions. Collectively, these upfront processes are called “ingestion”.

Figure 1 – Content delivery with and without a CDN

Mobile CDN Schematic, Fig 1 Telco 2.0 Report

Source: STL Partners / Telco 2.0

Value-added CDN services

It is important to recognise that the fixed-centric CDN business has increased massively in richness and competition over time. Although some of the players have very clever architectures and IPR in the forms of their algorithms and software techniques, the flexibility of modern IP networks has tended to erode away some of the early advantages and margins. Shipping large volumes of content is now starting to become secondary to the provision of associated value-added functions and capabilities around that data. Additional services include:

  • Analytics and reporting
  • Advert insertion
  • Content ingestion and management
  • Application acceleration
  • Website security management
  • Software delivery
  • Consulting and professional services

It is no coincidence that the market leader, Akamai, now refers to itself as “provider of cloud optimisation services” in its financial statements, rather than a CDN, with its business being driven by “trends in cloud computing, Internet security, mobile connectivity, and the proliferation of online video”. In particular, it has started refocusing away from dealing with “video tonnage”, and towards application acceleration – for example, speeding up the load times of e-commerce sites, which has a measurable impact on abandonment of purchasing visits. Akamai’s total revenues in 2010 were around $1bn, less than half of which came from “media and entertainment” – the traditional “content industries”. Its H1 2011 revenues were relatively disappointing, with growth coming from non-traditional markets such as enterprise and high-tech (eg software update delivery) rather than media.

This is a critically important consideration for operators that are looking to CDNs to provide them with sizeable uplifts in revenue from upstream customers. Telcos – especially in mobile – will need to invest in various additional capabilities as well as the “headline” video traffic management aspects of the system. They will need to optimise for network latency as well as throughput, for example – which will probably not have the cost-saving impacts expected from managing “data tonnage” more effectively.

Although in theory telcos’ other assets should help – for example mapping download analytics to more generalised customer data – this is likely to involve extra complexity with the IT side of the business. There will also be additional efforts around sales and marketing that go significantly beyond most mobile operators’ normal footprint into B2B business areas. There is also a risk that an analysis of bottlenecks for application delivery / acceleration ends up simply pointing the finger of blame at the network’s inadequacies in terms of coverage. Improving delivery speed, cost or latency is only valuable to an upstream customer if there is a reasonable likelihood of the end-user actually having connectivity in the first place.

Figure 2: Value-added CDN capabilities

Mobile CDN Schematic - Functionality Chart - Telco 2.0 Report

Source: Alcatel-Lucent

Application acceleration

An increasingly important aspect of CDNs is their move beyond content/media distribution into a much wider area of “acceleration” and “cloud enablement”. As well as delivering large pieces of data efficiently (e.g. video), there is arguably more tangible value in delivering small pieces of data fast.

There are various manifestations of this, but a couple of good examples illustrate the general principles:

  • Many web transactions are abandoned because websites (or apps) seem “slow”. Few people would trust an airline’s e-commerce site, or a bank’s online interface, if they’ve had to wait impatiently for images and page elements to load, perhaps repeatedly hitting “refresh” on their browsers. Abandoned transactions can be directly linked to slow or unreliable response times – typically a function of congestion either at the server or various mid-way points in the connection. CDN-style hosting can accelerate the service measurably, leading to increased customer satisfaction and lower levels of abandonment.
  • Enterprise adoption of cloud computing is becoming exceptionally important, with both cost savings and performance enhancements promised by vendors. Sometimes, such platforms will involve hybrid clouds – a mixture of private (Internal) and public (Internet) resources and connectivity. Where corporates are reliant on public Internet connectivity, they may well want to ensure as fast and reliable service as possible, especially in terms of round-trip latency. Many IT applications are designed to be run on ultra-fast company private networks, with a lot of “hand-shaking” between the user’s PC and the server. This process is very latency-dependent, and especially as companies also mobilise their applications the additional overhead time in cellular networks may otherwise cause significant problems.

Hosting applications at CDN-type cloud acceleration providers achieves much the same effect as for video – they can bring the application “closer”, with fewer hops between the origin server and the consumer. Additionally, the CDN is well-placed to offer additional value-adds such as firewalling and protection against denial-of-service attacks.

To read the 25 note in full, including the following additional content…

  • How do CDNs fit with mobile networks?
  • Internet CDNs vs. operator CDNs
  • Why use an operator CDN?
  • Should delivery mean delivery?
  • Lessons from fixed operator CDNs
  • Mobile video: CDNs, offload & optimisation
  • CDNs, optimisation, proxies and DPI
  • The role of OVPs
  • Implementation and planning issues
  • Conclusion & recommendations

… and the following additional charts…

  • Figure 3 – Potential locations for CDN caches and nodes
  • Figure 4 – Distributed on-net CDNs can offer significant data transport savings
  • Figure 5 – The role of OVPs for different types of CDN player
  • Figure 6 – Summary of Risk / Benefits of Centralised vs. Distributed and ‘Off Net’ vs. ‘On-Net’ CDN Strategies

……Members of the Telco 2.0 Executive Briefing Subscription Service and Future Networks Stream can download the full 25 page report in PDF format here. Non-Members, please see here for how to subscribe, here to buy a single user license for £595 (+VAT), or for multi-user licenses and any other enquiries please email contact@telco2.net or call +44 (0) 207 247 5003.

Organisations and products referenced: 3GPP, Acision, Akamai, Alcatel-Lucent, Allot, Amazon Cloudfront, Apple’s Time Capsule, BBC, BrightCove, BT, Bytemobile, Cisco, Ericsson, Flash Networks, Huawei, iCloud, ISPs, iTunes, Juniper, Limelight, Netflix, Nokia Siemens Networks, Ooyala, OpenWave, Ortiva, Skype, smartphone, Stoke, tablets, TiVo, Vantrix, Velocix, Wholesale Content Connect, Yospace, YouTube.

Technologies and industry terms referenced: acceleration, advertising, APIs, backhaul, caching, CDN, cloud, distributed caches, DNS, Evolved Packet Core, eyeball network, femtocell, fixed broadband, GGSNs, HLS, HTTP streaming, ingestion, IP network, IPR, laptops, LIPA, LTE, macro-CDN, micro-CDN, middle mile, mobile, Net Neutrality, offload, optimisation, OTT, OVP, peering proxy, QoE, QoS, RNCs, SIPTO, video, video traffic management, WiFi, wireless.

Strategy 2.0: What Skype + Microsoft means for telcos

Summary: in theory, Microsoft and Skype have the resources, the brands, the customer base and the know-how to shape the future of telecoms and become a strategic counterweight to Apple and Google. Can they do it – and what should telcos’ strategy be? (June 2011, Executive Briefing Service, Dealing with Disruption Stream).

Microsoft Skype Logo Image Medium


This page contains an excerpt from the report, plus detailed contents, figures and tables, and a summary of the companies, products, technologies and issues covered.


Read in Full (Members only)    Buy This Report    To Subscribe

(The 35 page PDF format report is available in full to Members of the Telco 2.0 Executive Briefing Service and the Telco 2.0 Dealing with Disruption Stream here. Non-members can buy a Single User license for this report online here for £995 (+VAT) or subscribe here. For multiple user licenses or other enquiries please email contact@telco2.net or call +44 (0) 207 247 5003.)

To share this article easily, please click:

//

Introduction: Skype, the Original ‘Voice 2.0’

Everyone knows Skype as the original Voice 2.0 company – providing free phone calls, free video, status updates, all delivered using an innovative peer-to-peer architecture, and with the unique selling point of VoIP that just worked. This report describes its business model, technology strategy, its acquisition by Microsoft, and the consequences for the telecoms industry.

A little history

Founded in 2003 by Janus Friis and Niklas Zennström, Skype was acquired by eBay in 2005 for $2.6bn. eBay ownership was a period of stagnation – although eBay also owns PayPal, it only made half-hearted efforts to integrate the two. In November 2009, eBay sold 65% of Skype to an investor group led by Silver Lake for approximately $1.9bn in cash, valuing Skype at $2.75bn.

With Skype preparing for an IPO, Microsoft announced in May 2011 that it had agreed to buy the company for $8.5bn, giving the investor group a massive return and ensuring future potentially-disruptive start-ups will also attract plenty of funding. Many commentators have suggested that Microsoft is paying too much for the VOIP company, although the price-earnings ratio is actually no higher than that of Cisco’s acquisition of WebEx. So, what exactly is Microsoft getting for its billions? Let’s take a closer look.

A Dive into Skype’s Accounts

Microsoft has acquired what is essentially a global telephony company with 663 million registered users and very significant gross profitability. Skype contributed more net new minutes of international voice than the rest of the industry put together in 2010, according to Telegeography. Skype has never struggled to achieve growth, but its profitability has often been criticised, as has its ability to generate growth in ARPU. The following chart (figure 1) summarises Skype’s operational key performance indicators (KPIs) since 2006.

Figure 1: Skype’s KPIs: users, usage, and ARPU

Telco 2.0 Skype KPIs Users and ARPU June 2011 Graph Chart v1

Source: Skype’s S-1, May 2011

Questions have been raised about Skype’s performance in converting registered or even active users into paying users. This is critical, as ARPU is relatively flat. However, a monthly ARPU for paying users of $8 would be considered very reasonable for an emerging-market GSM operator and such an operator would tie up far more capital than Skype does. As all Skype users contribute to the system’s peer-to-peer (P2P) infrastructure, the marginal cost of serving non-paying users is essentially nothing.

Another way of looking at the KPIs is to consider their growth rates, as we have done in the following chart (figure 2). Although the growth of paying users is nowhere near as fast as that of free minutes of use, 40% growth per annum in revenue-generating subscribers is still very impressive.

Figure 2: Growth rates of Skype KPIs.

Telco 2.0 Skype KPIs Growth June 2011 Graph Chart

Source: Skype’s S-1, May 2011

In fact, there is very little wrong with Skype at the operating level. The following chart (figure 3) shows that, if we consider the primary challenge for Skype to be converting free users into paying users, it is actually doing rather well. Revenue and EBITDA are advancing and margins are holding up well.

Figure 3: Revenue and EBITDA growth is strong

Telco 2.0 Skype KPIs 5 Years Revenue and EBITDA June 2011 Graph Chart

Source: Skype S-1, May 2011

With 509 million active users available for conversion, ARPU may not be that relevant – just converting users of the free service into paying users has so far provided strong growth in gross profits and could do for the foreseeable future.

Figure 4: Conversion of free users at steady ARPU drives gross profit.

Telco 2.0 Skype Gross Profits June 2011 Graph Chart

Source: Skype S-1, May 2011

Skype doesn’t make money on free calls (not even from advertising or customer analytics/insights, yet), and has to pay interconnection fees and operate some infrastructure in order to provide SkypeOut (calls to conventional telephone numbers, rather than other Skype clients), and SkypeIn (calls from the PSTN to Skype users).

Skype sceptics have argued that eventually termination charges will catch up with the company and destroy its profitability. It is true that most of Skype’s revenues are generated (over 80%) by SkypeOut call charges and that Skype’s cost of net revenue is dominated (over 60%) by the cost of terminating these calls. However, termination as a percentage of Skype’s cost of net revenue is falling and Skype’s gross margin is rising, as its enormous volume growth enables it to extract better bulk pricing from interconnect operators (see Figure 5).

To see Figure 5, the conclusion of our analysis of Skype’s finances, and…

  • Is Skype Accumulating “Technical Debt”?
  • Future Plans: The Core Business, The Enterprise & Facebook
  • Telcos and Skype
  • Enter Microsoft
  • Windows Phone 7: Relevant again?
  • Microsoft’s other mobile allies: Nokia, RIM
  • How Microsoft will deploy Skype
  • Developers, developers, developers
  • Key Risks and Questions: execution, regulatory, partners, advertisers & payments
  • Answers: How Telcos should deal with Skype…and Microsoft

…plus these additional figures & fables…

  • Figure 5: How Skype’s spending is changing
  • Figure 6: Why Skype is making a loss
  • Figure 7: Commoditisation is for everybody!
  • Figure 8: 3UK benefits from its deal with Skype
  • Figure 9: Skype’s Deals with Carriers
  • Figure 10: Skype is a good fit for many Microsoft products
  • Figure 11: A unifying Skype API is critical for integration into the Microsoft empire
  • Figure 12: Telco strategy options matrix


Members of the Telco 2.0 Executive Briefing Subscription Service and the Telco 2.0 Dealing with Disruption Stream can download the full 35 page report in PDF format here. Non-Members, please see here for how to subscribe, here to buy a single user license for for £995, or for multi-user licenses and any other enquiries please email contact@telco2.net or call +44 (0) 207 247 5003.

Organisations, products and people referenced in the report: 3UK, AdSense, Android, Apple, AT&T, Au, Avaya, Ben Horowitz, BlackBerry Messenger, Cisco, Dynamics CRM, EasyBits, eBay, Exchange Server, Facebook, Facetime, Google, Google Talk, Google Voice, GSMA, Happy Pipe, Hutchison, iOS, iPhone, Jajah, Janus Friis, KDDI Mobile, Kinect, KPN, Lync, Mango, Marchex, Microsoft, Microsoft-Nokia deal, MXit, MySpace, Niklas Zennström, Nokia, Ofcom, Office Live, Outlook, PayPal, PowerPoint, Qik, RIM, Silver Lake, Skype, SkypeConnect, SkypeIn, SkypeKit, SkypeOut, SkypePhone, Steve Ballmer, Telefonica, Teredo, Tony Jacobs, Tropo, Twitter, Verizon Wireless, Virgin, Visual Studio, WebEx, WhatsApp, Windows Mobile, Windows Phone 7, WP7, Xbox, X-Series.

Technologies referenced: GSM, HD voice, HTTP/S, IM, IMS MMTel, IP networks, IPv4, IPv6, LTE, Mobile, NAT, P2P, PSTN, RCS, SILK V3, SIP, SMS, SS7, super node, URI, video telephony, Voice 2.0, VoIP, XMPP.

Cloud 2.0: Telcos to grow Revenues 900% by 2014

Summary: Telcos should grow Cloud Services revenues nine-fold and triple their overall market share in the next three years according to delegates at the May 2011 EMEA Executive Brainstorm. But which are the best opportunities and strategies? (June 2011, Executive Briefing Service, Cloud & Enterprise ICT Stream)

NB Members can download a PDF of this Analyst Note in full here. Cloud Services will also feature at the Best Practice Live! Free global virtual event on 28-29 June 2011.

To share this article easily, please click:

//

Introduction

STL Partners’ New Digital Economics Executive Brainstorm & Developer Forum EMEA took place from 11-13 May in London. The event brought together 250 execs from across the telecoms, media and technology sectors to take part in 6 co-located interactive events: the Telco 2.0, Digital Entertainment 2.0, Mobile Apps 2.0, M2M 2.0 and Personal Data 2.0 Executive Brainstorms, and an evening AppCircus developer forum.

Building on output from the last Telco 2.0 events and new analysis from the Telco 2.0 Initiative – including the new strategy report ‘The Roadmap to New Telco 2.0 Business Models’ – the Telco 2.0 Executive Brainstorm explored latest thinking and practice in growing the value of telecoms in the evolving digital economy.

This document gives an overview of the output from the Cloud session of the Telco 2.0 stream.

Companies referenced: Aepona, Amazon Web Services, Apple, AT&T, Bain, BT, Centurylink, Cisco, Dropbox, Embarq, Equinix, Flexible 4 Business, Force.com, Google Apps, HP, IBM, Intuit, Microsoft, Neustar, Orange, Qwest, Salesforce.com, SAP, Savvis, Swisscom, Terremark, T-Systems, Verizon, Webex, WMWare.

Business Models and Technologies covered: cloud services, Enterprise Private Cloud (EPC), Virtual Private Cloud (VPC), Infrastucture as a service (IaaS), Platform as a Service (PaaS), Software as a Service (SaaS).

Cloud Market Overview: 25% CAGR to 2013

Today, Telcos have around a 5% share of nearly $20Bn p.a. cloud services revenue, with 25% compound annual growth rate (CAGR) forecast to 2013. Most market forecasts are that the total cloud services market will reach c.$45-50Bn revenue by 2013 / 2014, including the Bain forecast previewed at the Americas Telco 2.0 Brainstorm in April 2011.

At the EMEA brainstorm, delegates were presented with an overview of the component cloud markets and examples of different cloud services approaches, and were then asked for their views on what share telcos could take of cloud revenues in each. In total, delegates’ views amounted to telcos taking in the region of 18% by revenue of cloud services at the end of the next three years.

Applying these views to an extrapolated ‘mid-point’ forecast view of the Cloud Market in 2014, implies that Telcos will take just under $9Bn revenue from Cloud by 2014, thus increasing today’s c$1Bn share nine-fold. [NB More detailed methodology and sources are in the full paper available to members here.]

Figure 1 – Cloud Services Market Forecast & Players

Cloud 2.0 Forecast 2014 - Telco 2.0

Source: Telco 2.0 Presentation

Although already a multi-$Bn market already, there is still a reasonable degree of uncertainty and variance in Cloud forecasts as might be expected in a still maturing market, so this market could be a lot higher – or perhaps lower, especially if the consequences of the recent Amazon AWS breakdown significantly reduce CIO’s appetites for Cloud.

The potential for c.30% IT cost savings and speed to market benefits that can be achieved by telcos implementing Cloud internally previously shown by Cisco’s case study were highlighted but not explored in depth at this session.

Which cloud markets should telcos target?

Figure 2 – Cloud Services – Telco Positioning

Cloud 2.0 Market Positioning - Telco 2.0

Source: Cisco/Orange Presentation, 13th Telco 2.0 Executive Brainstorm, London, May 2011

An interesting feature of the debate was which areas telcos would be most successful in, and the timing of market entry strategies. Orange and Cisco argued that the area of ‘Virtual Private Cloud’, although neither the largest nor predicted to be the fastest growing area, should be the first market for some telcos to address, appealing to some telcos strong ‘trust’ credentials with CIOs and building on ‘managed services’ enterprise IT sales and delivery capabilities.

Orange described its value proposition ‘Flexible 4 Business’ in partnership with Cisco, VMWare virtualisation, and EMC2 storage, and although could not at this early stage give any performance metrics described strong demand and claimed satisfaction with progress to date.

Aepona described a Platform-as-a-Service (PaaS) concept that they are launching shortly with Neustar that aggregates telco APIs to enable the rapid creation and marketing of new enterprise services.

Figure 3 – Aepona / Neustar ‘Intelligent Cloud’ PaaS Concept

C;oud 2.0 - Intelligent Cloud PaaS Concept - Telco 2.0

In this instance, the cloud component makes the service more flexible, cheaper and easier to deliver than a traditional IT structure. This type of concept is sometimes described as a ‘mobile cloud’ because many of the interesting uses relate to mobile applications, and are not reliant on continuous high-grade mobile connectivity required for e.g. IaaS: rather they can make use of bursts of connectivity to validate identities etc. via APIs ‘in the cloud’.

To read the rest of this Analyst Note, containing…

  • Forecasts of telco share of cloud by VPC, IaaS, PaaS and SaaS
  • Telco 2.0 take-outs and next steps
  • And detailed Brainstorm delegate feedback

Members of the Telco 2.0TM Executive Briefing Subscription Service and the Cloud and Enterprise ICT Stream can access and download a PDF of the full report here. Non-Members, please see here for how to subscribe. Alternatively, please email contact@telco2.net or call +44 (0) 207 247 5003 for further details.

Mobile Broadband Economics: LTE ‘Not Enough’

Summary: Innovation appears to be flourishing in the delivery of mobile broadband. We saw applications that allow users to monitor and control their network usage and services, ‘dynamic pricing’, and other innovative pricing strategies at the EMEA Executive Brainstorm. Despite growing enthusiasm for LTE, delegates considered offloading traffic and network sharing at least as important commercial strategies for managing costs.

Members of the Telco 2.0 Subscrioption Service and Future Networks Stream can download a more comprehensive version of this report in PDF format here. Please email contact@telco2.net or call +44 (0) 207 247 5003 to contact Telco 2.0 or STL Partners for more details.

To share this article easily, please click:

//

Introduction

STL Partners’ New Digital Economics Executive Brainstorm & Developer Forum EMEA took place from 11-13 May in London. The event brought together 250 execs from across the telecoms, media and technology sectors to take part in 6 co-located interactive events: the Telco 2.0, Digital Entertainment 2.0, Mobile Apps 2.0, M2M 2.0 and Personal Data 2.0 Executive Brainstorms, and an evening AppCircus developer forum.

Building on output from the last Telco 2.0 events and new analysis from the Telco 2.0 Initiative – including the new strategy report ‘The Roadmap to New Telco 2.0 Business Models’ – the Telco 2.0 Executive Brainstorm explored latest thinking and practice in growing the value of telecoms in the evolving digital economy.

This document gives an overview of the output from the Mobile Broadband Economics session of the  Telco 2.0 stream.

Putting users in control

A key theme of the presentations in this session was putting users in more control of their mobile broadband service, by helping them to both understand what data they have used in an interactive environment, and giving them the option to choose to buy additional data capabilities on-demand when they need and can use it.

Delegates perceptions that key obstacles to building revenue were internal industry issues, and key cost issues involve better collaboration rather than technology (specifically, LTE) were both refreshing and surprising.

Ericsson presented a mobile Broadband Data ‘Fuel gauge’ app to show how users could be better informed of their usage and be interactively offered pricing and service offers.

Figure 1 – Ericsson’s Mobile Broadband ‘Fuel Gauge’

Telco 2.0 - Mobile Broadband Fuel Gauge

Source: Ericsson, 13th Telco 2.0 Executive Brainstorm, London, May 2011

Deutsche Telekom showed its new ‘self-care’ customer app, complete with WiFi finder, Facebook integration, and ad-funding options, and how they are changing from a focus on complex tariffs to essentially Small/Medium/Large options, with tiers of speed, caps, WiFi access, and varying levels of added-on bundled services.

While we admired the apparent simplicity of the UI design of many of the elements of the services shown, we retain doubts on the proposed use of RCS and various other operator-only “enablers”, and will be further examining the pros and cons of RCS in future analysis.

New pricing approaches

In addition to Ericsson’s concept of dynamic pricing, making offers to customers at times of most need and suitability, Openwave showed numerous innovative new approaches to charging by application, time/day, user group and event (e.g. ‘Movie Pass’), segmentation of plans by user type, and how to use data plan sales to sell other services.

Figure 2 – Innovative Mobile Broadband Offers

Telco 2.0 - Mobile Broadband Pricing Options

Source: Openwave, 13th Telco 2.0 Executive Brainstorm, London, May 2011

No single ‘Killer’ obstacle to growth – but lots of challenges

Delegates voted on the obstacles to mobile broadband revenues and the impact of various measures on the control of costs.

Figure 3 – Obstacles to growing Mobile Broadband Revenues

Telco 2.0 - Mobile Broadband Revenue Obstacles

Source: Delegate Vote, 13th Telco 2.0 Executive Brainstorm, London, May 2011

Our take on these results is that:

  • Overall, there appears to be no single ‘killer obstacle’ to growth;
  • Net Neutrality is increasingly seen as a lesser issue in EMEA, certainly than in the US;
  • Whilst securing the largest number of ’major issue’ votes, we are not certain that all delegates fully know the views, needs, expectations and knowledge of upstream customers, and although their expectations are seen as an issue, it does not particularly appear more challenging than organisational or technical ones;
  • Manageable technical and organisational issues (e.g. integration, organisational complexity) appear a bigger obstacle than unmanageable ones (e.g. inability to control devices), although;
  • Implementation issues vary by operator, as can be seen by the relatively large proportions who either do not see integration as an issue at all or see it as a major issue.

Managing Costs: Network Sharing, Offloads as important as LTE 

Figure 4 – Impact of Mobile Broadband Cost Reduction Strategies

Telco 2.0 - Mobile Broadband Cost Strategies

Source: Delegate Vote, 13th Telco 2.0 Executive Brainstorm, London, May 2011

Our take on these results is that the approaches fall into three groups:

  • Strategic, long-term solutions including network sharing, LTE and offloading;
  • Strategies with a potentially important but more moderate impact including pricing, network outsourcing, and video traffic optimisation;
  • And lower impact initiatives such as refreshing the 3G network.

It is interesting that network sharing deals were seen as a more strategic solution to long term cost issues than migration to LTE, although there is logic to this at the current stage of market development with the capital investments and longer time required to build out LTE networks. Similarly, data offload is currently an important cost management strategy.

We found it particularly interesting that network sharing (collaboration) deals are seen as significantly more effective than network outsourcing deals, and will be exploring this further in future analysis.

Next Steps

  • Further research and analysis in this area, including a report on the pros and cons of ‘Under the Floor’ (outsourced network) strategies.
  • More detailed Mobile Broadband sessions at upcoming Telco 2.0 Executive Brainstorms.


The Roadmap to New Telco 2.0 Business Models

$375Bn per annum Growth or Brutal Retrenchment? Which route will Telcos take?

Over the last three years, the Telco 2.0 Initiative has identified new business model growth opportunities for telcos of $375Bn p.a. in mature markets alone (see the ‘$125Bn Telco 2.0 ‘Two-Sided’ Market Opportunity’ and ‘New Mobile, Fixed and Wholesale Broadband Business Models’ Strategy Reports). In that time, most of the major operators have started to integrate elements of Telco 2.0 thinking into their strategic plans and some have begun to communicate these to investors.

But, as they struggle with the harsh realities of the seismic shift from being predominantly voice-centric to data-centric businesses, telcos now find themselves:

  • Facing rapidly changing consumer behaviours and powerful new types of competitors;
  • Investing heavily in infrastructure, without a clear payback;
  • Operating under less benign regulatory environments, which constrain their actions;
  • Being milked for dividends by shareholders, unable to invest in innovation.

As a result, far from yet realising the innovative growth potential we identified, many telcos around the world seem challenged to make the bold moves needed to make their business models sustainable, leaving them facing retrenchment and potentially ultimately utility status, while other players in the digital economy prosper.

In our new 284 page strategy report – ‘The Roadmap to Telco 2.0 Business Models’ – we describe the transformational path the telecoms industry needs to take to carve out a more valuable role in the evolving ‘digital economy’. Based on the output from 5 intensive senior executive ‘brainstorms’ attended by over 1000 industry leaders, detailed analysis of the needs of ‘upstream’ industries and ‘downstream’ end users markets, and with the input from members and partners of the Telco 2.0 Initiative from across the world, the report specifically describes:

  • A new ‘Telco 2.0 Opportunity Framework’ for planning revenue growth;
  • The critical changes needed to telco innovation processes;
  • The strategic priorities and options for different types of telcos in different markets;
  • Best practice case studies of business model innovation.

The ‘Roadmap’ Report Builds on Telco 2.0’s Original ‘Two-Sided’ Telecoms Business Model

Updated Telco 2.0 Industry Framework

Source: The Roadmap to New Telco 2.0 Business Models


Who should read this report

The report is for strategy decision makers and influences across the TMT (Telecoms, Media and Technology) sector. In particular, CxOs, Strategists, Technologists, Marketers, Product Managers, and Legal and Regulatory leaders in telecoms operators, vendors, consultants, and analyst companies. It will also be valuable to those managing or considering medium to long-term investment in the telecoms and adjacent industries, and to regulators and legislators.

It provides fresh, creative ideas to:

Grow revenues beyond current projections by:

  • Protecting revenues from existing customers;
  • Extending services to new customers;
  • Generating new service offering and revenues.

Stay relevant with customers through:

  • A broader range of services and offers;
  • More personalised services;
  • Greater interaction with customers.

Evolve business models by:

  • Moving from a one-sided to a two-sided business model;
  • Generating cross-platform network effects – between service providers and customers;
  • Exploiting existing latent assets, skills and relationships.


The Six Telco 2.0 Opportunity Areas

Six Telco 2.0 Opportunity Types

Source: The Roadmap to New Telco 2.0 Business Models

What are the Key Questions the Report Answers?

For Telcos:

  • Where should your company be investing for growth?
  • What is ‘best practice’ in telecoms Telco 2.0 business model innovation and how does your company compare to it?
  • Which additional strategies should you consider, and which should you avoid?
  • What are the key emerging trends to monitor?
  • What actions are required in the areas of value proposition, technology, value / partner network, and finances?

For Vendors and Partners:

  • How to segment telecoms operators?
  • How well does your offering support Telco 2.0 strategies and transformation needs in your key customers?
  • What are the most attractive new areas in which you could support telcos in business model innovation?

For Investors and Regulators:

  • What are and will be the main new categories of telcos/CSPs?
  • What are the principle opportunity areas for operators?
  • What are and will be operator’s main strategic considerations with respect to new business models?
  • What are the major regulatory considerations of new business models?
  • What are the main advantages and disadvantages that telcos have in each opportunity area?

Contents

  • Executive Summary & Introduction
  • Pressures on Operators
  • The new Telco 2.0 Framework
  • Principles of Innovation and Services Delivery
  • – Strategic Positioning
  • – Design
  • – Development and delivery
  • Categorising telcos
  • Category 1: Leading international operators
  • Category 2: Regional leaders
  • Category 3: Wholesale and business-focused telcos
  • Category 4: Challengers & disruptors
  • Category 5: Smaller national leaders
  • Conclusions and Recommendations


Public Wifi: Destroying LTE/Mobile Value?

Summary: By building or acquiring Public WiFi networks for tens of $Ms, highly innovative fixed players in the UK are stealthily removing $Bns of value from 3G and 4G mobile spectrum as smartphone and other data devices become increasingly carrier agnostic. What are the lessons globally?

Below is an extract from this 15 page Telco 2.0 Analyst Note that can be downloaded in full in PDF format by members of the Telco 2.0 Executive Briefing service and Future Networks Stream using the links below.

Read in Full (Members only)        To Subscribe

The mobile broadband landscape is a key session theme at our upcoming ‘New Digital Economics’ Brainstorm (London, 11-13 May). Please use the links or email contact@telco2.net or call +44 (0) 207 247 5003 to find out more.

To share this article easily, please click:

//

Two recent announcements have reignited interest in the UK Public WiFi space: Sky buying The Cloud for a reputed figure just short of £50m and Virgin Media announcing their intention to invest in building a metro WiFi network based around their significant outdoor real estate in the major conurbations.

These can be seen narrowly as competitive reactions to the success of the BT Openzone public WiFi product, which is a clear differentiator for the BT home broadband offer in the eyes of the consumer. The recent resurgence of BT market share in the home broadband market hints that public WiFi is an ingredient valued by consumers, especially when the price is bundled into the home access charges and therefore perceived as “free” by the consumer.

This trend is being accelerated by the new generation of Smartphones sensing whether private and public WiFi access or mobile operator network access offer the best connection for the end-user and then making the authentication process much easier. Furthermore, the case of the mobile operators is not helped by laptops and more importantly tablets and other connected devices such as e-readers offering WiFi as a default means of access with mobile operator 3G requiring extra investment in both equipment and access with a clumsy means of authentication.

In a wider context, the phenomena should be extremely concerning for the UK mobile operators. There has been a two decade trend of voice traffic inside the home moving from fixed to mobile networks with a clear revenue gain for the mobile operators. In the data world, it appears that the bulk of the heavy lifting appears to being served within the home by private WiFi and outside of the home in nomadic spots served by public WiFi.

With most of the public WiFi hotspots in the UK being offered by fixed operators, there is a potential value shift from mobile to fixed networks reversing that two decade trend. As the hotspots grow and critically, once they become interconnected, there is an increasing risk to mobile operators in terms of the value of investment in expensive ‘4G’ / LTE spectrum.

Beyond this, a major problem for mobile operators is that the current trend for multi-mode networking (i.e. combination of WiFi and 3G access) limits the ability of operators to provide VAS services and/or capture 2-sided business model revenues, since so much activity is off-network and outside of the operator’s control plane.

The history of WiFi presents reality lessons for Mobile Operators, namely:

  • With Innovation, it not always the innovators who gain the most;
  • Similarly, with Standards setting, it not always the people who set the standards who gain the most; and
  • WiFi is a classic case of Apple driving mass adoption and reaping the benefits – to this day, Apple still seems to prefer WiFi over 3G.

This analyst note explains the flurry of recent announcements in the context of:

  • The unique UK market structure;
  • Technology Adoption Cycles;
  • How intelligence at the edge of the network will drive both private and public WiFi use;
  • How public WiFi in the UK might evolve;
  • The longer term value threat to the mobile operators;
  • How O2 and Vodafone are taking different strategies to fight back; and
  • Lessons for other markets.

Unique Nature of the UK Market Structure

In May 2002, BT Cellnet, the mobile arm of BT, soon to be renamed O2, demerged from BT leaving the UK market as one of few markets in the world where the incumbent PTT did not have a mobile arm. Ever since BT has tried to get into the mobility game with varying degrees of success:

  • In the summer of 2002, it launched its public WiFi service called OpenZone;
  • In September 2003 it announced plans for WiFi in all public phone boxes ;
  • In May 2004, it launched an MVNO with Vodafone with plans for the doomed BT Fusion UMA (Bluetooth then WiFi ) phone;
  • In May 2006, with Metro WiFi plans in partnership with local authorities in 12 cities; and
  • In Oct 2007, in partnership with FON to put public WiFi in each and every BT home routers.

After trying out different angles in the mobility business for five years, BT finally discovered a workable business model with public WiFi around the FON partnership. BT now effectively bundle free public WiFi to its broadband users in return for establishing a public hotspot within their own home.

Huge Growth in UK Public Wifi Usage

Approximately 2.6m or 47% customers of a total of 5.5m BT broadband connections have taken this option. This creates the image of huge public WiFi coverage and clearly currently differentiates BT from other home broadband providers. And, the public WiFi network is being used much more: 881 million minutes in the current quarter compared to 335 million minutes in the previous year.

The other significant element of the BT public WiFi network is the public hotspots they have built with hotels, restaurants, airports. The hotspots number around 5k, of which 1.2k are wholesale arrangements with other public WiFi hotspot providers. While not significant in number, these provide the real incremental value to the BT home broadband user who can connect for “free” in these high traffic locations.

BT was not alone in trying to build a public WiFi business. The Cloud was launched in the UK in 2003 and tried to build a more traditional public WiFi business building upon a combination of direct end user revenues and wholesale and interconnect arrangements. That Sky are paying “south of £50m” for The Cloud compared to the “€50m invested” over the years by the VC backers implies the traditional public WiFi business model just doesn’t work. A different strategy will be taken by Sky going forward.

Sky is the largest pay-tv provider in the UK currently serving approximately 10m homes by satellite DTH. In 2005, Sky decided upon a change of strategy and decided that in addition to offering its customers video services, they needed to offer broadband and phone services. Sky has subsequently invested approximately £1bn in buying an altnet, Easynet, for £211m, in building a LLU network on top of BT infrastructure and acquiring 3m broadband customers. If the past is anything to go by, Sky will be planning on investing considerable further sums in The Cloud to make it at a minimum a comparable service to BT Openzone for its customers.

Virgin Media is the only cable operator of any significance in the UK with a footprint of around 50% of the UK mainly in the dense conurbations. Virgin Media is the child of many years of cable consolidation and historically suffered from disparate metro cable networks of varying quality and an overleveraged balance sheet. The present management has a done a good job of tidying up the mess and upgrading the networks to DOCSIS 3.0 technology. In the last year, Virgin Media has started to expand its footprint again and investing in new products with plans for building a metro WiFi network based around its large footprint of cabinets in the street.

Virgin Media has a large base of 4.3m home broadband users to protect and an even larger base of potential homes to sell services into. In addition, Virgin Media is the largest MVNO in the UK with around 3m mobile subscribers. In recent years, Virgin Media have focused upon selling mobile services into their current cable customers. Although, Virgin Media’s public WiFi strategy is not in the public domain, it is clear that they plan on investing in 2011.

TalkTalk is the only other significant UK Home Broadband player with 4.2m home broadband users and currently has no declared public WiFi strategies.

The mobile operators which have invested in broadband, namely O2 and Orange, have failed to gain traction in the marketplace.

The key trend here is that the fixed broadband network providers are moving outside of the home and providing more value to their customers on the move.

Technology Adoption Cycles

Figure 1: Geoffrey Moore’s Technology Adoption Cycle

Geoffrey Moore documented technology adoption cycles, originally in the “Crossing the Chasm” book and subsequently in the “Living in the Fault Line” book. These books described the pain in products crossing over from early adopters to the mass market. Since publication, they have established themselves as the bible for a generation of Technology marketers. Moore distinguishes six zones, which are adopted to describe the situation of public WiFi in the UK.

  1. The early market: a time of great excitement when visionaries are looking to get on board. In the public WiFi market this period was clearly established in mid-2005 era when public WiFi networks where promoted as real alternatives to private MNOs.
  2. The chasm: a time of great despair as initial interest wanes and the mainstream is not comfortable with adoption. The UK WiFi market has been stagnating for the previous few years as investment in public WiFi has declined and customer adoption has not accelerated beyond the techno-savvy.
  3. The bowling alley: a period of niche adoption ahead of the general marketplace. The UK market is currently in this period. The two key skittles to fall were the BT FON deal changing the public WiFi business model, and the launch of the iPhone with auto-sensing and easy authentication of public WiFi.
  4. The tornado: a period of mass-market adoption. The UK market is about to enter in this phase as public WiFi investment is reinvigorated deploying providing “bundled” access to most home broadband users.
  5. Main street: Base infrastructure has been deployed and the goal is to flesh out the potential. We are probably a few years away from this and this phase will focus on ease-of-use, interconnect of public WiFi networks, consolidation of smaller players and alternate revenue sources such as advertising.
  6. Total Assimilation: Everyone is using the technology and the market is ripe for another wave of disruption. For UK WiFi, this is probably at least a decade away, but who know what the future holds?

Flashback: How Private WiFi crossed the Chasm

It is worthwhile at this point to revisit the history of WiFi as it provides some perspective and pointers for the future, especially who the winners and losers will be in the public WiFi space.

Back in 1985 when deregulation was still in fashion, the USA FCC opened up some spectrum to provide an innovation spurt to US industry under a license exempt and “free-to-use” regime. This was remarkable in itself given that previously spectrum, whether for radio and television broadcasting or public and private communications, had been exclusively licensed. Any applications in the so-called ISM (Industrial, Scientific and Medical) bands would have to deal with contention from other applications using the spectrum and therefore the primary use was seen as indoor and corporate applications.

Retail department stores, one of the main clients of NCR (National Cash Registers), tended to reconfigure their floor space on a regular basis and the cost of continual rewiring of point-of-sales equipment was a significant expense. NCR saw an opportunity to use the ISM bands to solve this problem and started a R&D project in the Netherlands to create wireless local area networks which required no cabling.

At this time, the IEEE were leading the standardization effort for local area networks and the 802.3 Ethernet specification initially approved in 1987 still forms the basis of the most wired LAN implementations today. NCR decided that the standards road was the route to take and played a leading role in the eventual creation of 802.11 wireless LAN standards in 1997. Wireless LAN was considered too much of a mouthful and was reinvented as WiFi in 1999 with the help of a branding agency.

Ahead of the standards approval, NCR launched products under the WaveLAN brand in 1990 but the cost of the plug-in cards at US$1,400 were very expensive compared to the wired ethernet cards which were priced at around US$400. Product take-up was slow outside of early adopters.

In 1991 an early form of Telco-IT convergence emerged as AT&T bought NCR. An early competitor for the ISM bandwidth emerged with AT&T developing a new generation of digital cordless phones using the 2.4GHz band. To this day, in the majority of UK and worldwide households, DECT handsets in the home compete with WiFi for spectrum. Product development of the cards continued and was made consumer friendly easier with the adoption on the PCMIA card slots in PCs.

By 1997, WiFi technology was firmly stuck in the chasm. The major card vendors (Proxim, Aironet, Xircom and AT&T) all had non-standardized products and the vendors were at best marginally profitable struggling to grow the market.
AT&T had broken up and the WiFi business became part of Lucent Technologies. The eyes and brains of the big communications companies (Alcatel, Ericsson, Lucent, Motorola, Nokia, Nortel and Siemens) were focused on network solutions with 3G holding the promise for the future.

All that was about to change in early 1998 with a meeting between Steve Jobs of Apple and Richard McGinn, CEO of Lucent:

  • Steve Jobs declared “Wireless LANs are the greatest thing on earth, Apple wants a radio card for US$50, which Apple will retail at US$99”;
  • Rich McGinn declared 1999 to be the year of DSL and asked if Apple would be ready; and
  • Steve Jobs retort was revealing to this day “Probably not next, maybe the year after; depends upon whether there is one standard worldwide”.

Figure 2: The Apple Airport

In early 1998 the cost of the cards was still above US$100 and needed a new generation of chips to bring the cost down to the Apple price point. Further, Apple wanted to use the 11Mbit/s standard which had just been developed rather than the current 2Mbit/s. However, despite the challenges the product was launched in July 1999 as the Apple Airport with the PCMCIA card at US$99 and the access point at US$299. Apple was the first skittle to fall as private WiFi crossed the chasm. The Windows based OEMs rushed to follow.

By 2001, Lucent had spun out its chip making arm as Agere Systems which had a market share of 50% of a US$1bn WiFi market, which would have been nothing but a pin prick on either the AT&T or Lucent profit and loss had Agere remained as part of them.

The final piece in the WiFi jigsaw fell into place when Intel acquired Xircom in 1999 and developed the Xircom technology and used their WiFi patents as protection against competitors. In 2003, Intel launched its Centrino chipset with built in WiFi functionality for laptops supported by a US$300m worldwide marketing campaign. Effectively for the consumer WiFi had become part the laptop bundle.

Agere Systems and all its WiFi heritage was finished and they discontinued its WiFi activities in 2004.

There are three clear pointers for the future:

  • The players who take a leading role in the early market will not necessary be the ones to succeed in Main Street;
  • Apple took a leading role in the adoption of WiFi and still seems massively committed to WiFi technology to this day;
  • Technology adoption cycles tend to be longer than expected.

Intelligence at the edge of the Network

As early as 2003, Broadcom and Phillips were launching specialized WiFi chips aimed at mobile phones. Several cellular handsets were launched with WiFi combined with 2G/3G connectivity, but the connectivity software was clunky for the user.

The launch of the iPhone in 2007 began a new era where the device automatically attempts to connect to any WiFi network if the signal strength is better than the 2G/3G network. The era of the home or work WiFi network being the preferred route for data traffic was ushered in.

Apple is trying to make authentication as simple as possible: enter the key for any WiFi network once and it will be remembered for the handset’s lifetime and connect automatically when a user returns in range. However, in dense urban networks with multiple WiFi access points, it is quite annoying to be prompted for key after key. The strength of the federated authentication system in cellular networks is therefore still a critical advantage.

The iPhone also senses that some applications can only be used when WiFi connections are available. The classic example is Apple’s own Facetime (video calling) application. Mobile Operators seem happy in the short run that bandwidth intensive applications are kept off their networks. But, there is a longer term value statement with the users being continually being reminded that WiFi networks are superior to mobile operators’ networks.

Other mobile operating systems, such as Android and Windows Phone 7, have copied the Apple approach and today there is no going back: multi-modal mobile phones are here to stay and the devices themselves decide which network to use unless the user over-rides this choice.

One of underlying rules of the internet is that intelligence moves to the edge of the network. The edges are probably in the eyes of Apple and Google the handsets and their server farms. It is not beyond the realms of possibility that future Smartphones will be supplied with automatic authentication for both WiFi and Cellular networks with least-cost routing software determining the best price for the user. As intelligence moves to the edge so does value.

Public WiFi Hotspots – the Business Model challenges

The JiWire directory estimates that there are c. 414k public WiFi locations across the globe at the end of 2010, and there are WiFi hotspots currently located 26.5k in the UK. Across the globe, there is a shift from a paid-for model to a free-model with the USA being top of the free chart with 54% of public WiFi locations being free.

For a café chain offering free access to WiFi is a good model to follow. The theory is that people will make extra visits to buy a coffee just to check their email or some other light internet visit. Starbucks started the trend by offering free WiFi access, all the rest felt compelled to follow. Nowadays, all the major chains whether Costa Coffee, Café Nero and even McDonalds offer free WiFi access provided by either BT Openzone or Sky’s The Cloud. A partnership with a public WiFi provider is perfect as the café chain doesn’t have to provide complicated networking support or regulatory compliance. The costs for the public WiFi provider are relativity small especially if they are amortized across a large base of broadband users.

For hotels and resorts, the business case is more difficult as most hotels are quite large and multiple access points are required to provide decent coverage to all rooms. Furthermore, hotels traditionally have made additional revenues from most services and therefore complexity is added with billing systems. For most hotels and resorts a revenue share agreement is negotiated with the WiFi service provider.

For public places, such as airports and train stations, the business case is also complicated by the owners knowing these sites are high in footfall and therefore demand a premium for any activity whether retail or service based. It is a similar problem that mobile operators face when trying to provide coverage in major locations: access to prime locations is expensive. In the UK, the entry of Sky into the public WiFi and its long association with Sports brings an intriguing possible partnership with the UK’s major venues.

These three types of locations currently account for 75% of current public WiFi usage according to JiWire.

To read the rest of the article, including:

  • How will UK Public WiFi Evolve?
  • Challenge to Mobile Operators
  • O2 Tries an Alternative
  • Vodafone Goes with Femtos
  • Lessons for Other Markets

Members of the Telco 2.0TM Executive Briefing Subscription Service and Future Networks Stream can access and download a PDF of the full report here. Non-Members, please see here for how to subscribe. Alternatively, please email contact@telco2.net or call +44 (0) 207 247 5003 for further details. ‘Growing the Mobile Internet’ and ‘Lessons from Apple: Fostering vibrant content ecosystems’ are also featured at our AMERICAS and EMEA Executive Brainstorms and Best Practice Live! virtual events.