Winning Strategies: Differentiated Mobile Data Services

Introduction

Verizon’s performance in the US

Our work on the US cellular market – for example, in the Disruptive Strategy: “Uncarrier” T-Mobile vs VZW, AT&T, and Free.fr  and Free-T-Mobile: Disruptive Revolution or a Bridge Too Far?  Executive Briefings – has identified that US carrier strategies are diverging. The signature of a price-disruption event we identified with regard to France was that industry-wide ARPU was falling, subscriber growth was unexpectedly strong (amounting to a substantial increase in penetration), and there was a shakeout of minor operators and MVNOs.

Although there are strong signs of a price war – for example, falling ARPU industry-wide, resumed subscriber growth, minor operators exiting, and subscriber-acquisition initiatives such as those at T-Mobile USA, worth as much as $400-600 in handset subsidy and service credit – it seems that Verizon Wireless is succeeding while staying out of the mire, while T-Mobile, Sprint, and minor operators are plunged into it, and AT&T may be going that way too. Figure 1 shows monthly ARPU, converted to Euros for comparison purposes.

Figure 1: Strategic divergence in the US

Figure 1 Strategic Divergence in the US
Source: STL Partners, themobileworld.com

We can also look at this in terms of subscribers and in terms of profitability, bringing in the cost side. The following chart, Figure 2, plots margins against subscriber growth, with the bubbles set proportional to ARPU. The base year 2011 is set to 100 and the axes are set to the average values. We’ve named the four quadrants that result appropriately.

Figure 2: Four carriers, four fates

Figure 2 Four carriers four fate
Source: STL Partners

Clearly, you’d want to be in the top-right, top-performer quadrant, showing subscriber growth and growing profitability. Ideally, you’d also want to be growing ARPU. Verizon Wireless is achieving all three, moving steadily north-west and climbing the ARPU curve.

At the same time, AT&T is gradually being drawn into the price war, getting closer to the lower-right “volume first” quadrant. Deep within that one, we find T-Mobile, which slid from a defensive crouch in the upper-left into the hopeless lower-left zone and then escaped via its price-slashing strategy. (Note that the last lot of T-Mobile USA results were artificially improved by a one-off spectrum swap.) And Sprint is thrashing around, losing profitability and going nowhere fast.

The usual description for VZW’s success is “network differentiation”. They’re just better than the rest, and as a result they’re reaping the benefits. (ABI, for example, reckons that they’re the world’s second most profitable operator on a per-subscriber basis  and the world’s most profitable in absolute terms.) We can restate this in economic terms, saying that they are the most efficient producer of mobile service capacity. This productive capacity can be used either to cut prices and gain share, or to increase quality (for example, data rates, geographic coverage, and voice mean-opinion score) at higher prices. This leads us to an important conclusion: network differentiation is primarily a cost concept, not a price concept.

If there are technical or operational choices that make network differentiation possible, they can be deployed anywhere. It’s also possible, though, that VZW is benefiting from structural factors, perhaps its ex-incumbent status, or its strong position in the market for backbone and backhaul fibre, or perhaps just its scale (although in that case, why is AT&T doing so much worse?). And another possibility often mooted is that the US is somehow a better kind of mobile market. Less competitive (although this doesn’t necessarily show up in metrics like the Herfindahl index of concentration), supposedly less regulated, and undoubtedly more profitable, it’s often held up by European operators as an example. Give us the terms, they argue, and we will catch up to the US in LTE deployment.

As a result, it is often argued in lobbying circles that European markets are “too competitive” or in need of “market repair”, and therefore, the argument runs, the regulator ought to turn a blind eye to more consolidation or at least accept a hollowing out of national operating companies. More formally, the prices (i.e. ARPUs) prevailing do not provide a sufficient margin over operators’ fixed costs to fund discretionary investment. If this was true, we would expect to find little scope for successful differentiation in Europe.

Further, if the “incumbent advantage” story was true of VZW over and above the strategic moves that it has made, we might expect to find that ex-incumbent, converged operators were pulling into the lead across Europe, benefiting from their wealth of access and backhaul assets. In this note, we will try to test these statements, and then assess what the answer might be.

How do European Operators compare?

We selected a clutch of European mobile operators and applied the same screen to identify what might be happening. In doing so we chose to review the UK, German, French, Swedish, and Italian markets jointly with the US, in an effort to avoid a purely European crisis-driven comparison.

Figure 3: Applying the screen to European carriers

Figure 3 Applying the screen to European carriers

Source: STL Partners

Our first observation is that the difference between European and American carriers has been more about subscriber growth than about profitability. The axes are set to the same values as in Figure 2, and the data points are concentrated to their left (showing less subscriber growth in Europe) not below them (less profitability growth).

Our second observation is that yes, there certainly are operators who are delivering differentiated performance in the EU. But they’re not the ones you might expect. Although the big converged incumbents, like T-Mobile Germany, have strong margins, they’re not increasing them and on the whole their performance is average only. Nor is scale a panacea, which brings us to our next observation.

Our third observation is that something is visible at this level that isn’t in the US: major opcos that are shrinking. Vodafone, not a company that is short of scale, gets no fewer than three of its OpCos into the lower-left quadrant. We might say that Vodafone Italy was bound to suffer in the context of the Italian macro-economy, as was TIM, but Vodafone UK is in there, and Vodafone Germany is moving steadily further left and down.

And our fourth observation is the opposite, significant growth. Hutchison OpCo 3UK shows strong performance growth, despite being a fourth operator with no fixed assets and starting with LTE after first-mover EE. Their sibling 3 Sweden is also doing well, while even 3 Italy was climbing up until the last quarter and it remains a valid price warrior. They are joined in the power quadrant with VZW by Telenor’s Swedish OpCo, Telia Mobile, and O2 UK (in the last two cases, only marginally). EE, for its part, has only marginally gained subscribers, but it has strongly increased its margins, and it may yet make it.

But if you want really dramatic success, or if you doubt that Hutchison could do it, what about Free? The answer is that they’re literally off the chart. In Figure 4, we add Free Mobile, but we can only plot the first few quarters. (Interestingly, since then, Free seems to be targeting a mobile EBITDA margin of exactly 9%.)

The distinction here is between the pure-play, T-Mobile-like price warriors in the lower right quadrant, who are sacrificing profitability for growth, and the group we’ve identified, who are improving their margins even as they gain subscribers. This is the signature of significant operational improvement, an operator that can move traffic more efficiently than its competitors. Because the data traffic keeps coming, ever growing at the typical 40% annual clip, it is necessary for any operator to keep improving in order to survive. Therefore, the pace of improvement marks operational excellence, not just improvement.

Figure 4: Free Mobile, a disruptive force that’s literally off the charts

Figure 4 Free Mobile a disruptive force thats literally off the charts

Source: STL Partners

We can also look at this at the level of the major multinational groups. Again, Free’s very success presents a problem to clarity in this analysis – even as part of a virtual group of independents, the ‘Indies’ in Figure 5, it’s difficult to visualise. T-Mobile USA’s savage price cutting, though, gets averaged out and the inclusion of EE boosts the result for Orange and DTAG. It also becomes apparent that the “market repair” story has a problem in that there isn’t a major group committed to hard discounting. But Hutchison, Telenor, and Free’s excellence, and Vodafone’s pain, stand out.

Figure 5: The differences are if anything more pronounced within Europe at the level of the major multinationals

Figure 5 The differences are if anything more pronounced within Europe at the level of the major multinationals

Source: STL Partners

In the rest of this report we analyse why and how these operators (3UK, Telenor Sweden and Free Mobile) are managing to achieve such differentiated performance, identify the common themes in their strategic approaches and the lessons from comparison to their peers, and the important wider consequences for the market.


  • Executive Summary
  • Introduction
  • Applying the Screen to European Mobile
  • Case study 1: Vodafone vs. 3UK
  • 3UK has substantially more spectrum per subscriber than Vodafone
  • 3UK has much more fibre-optic backhaul than Vodafone
  • How 3UK prices its service
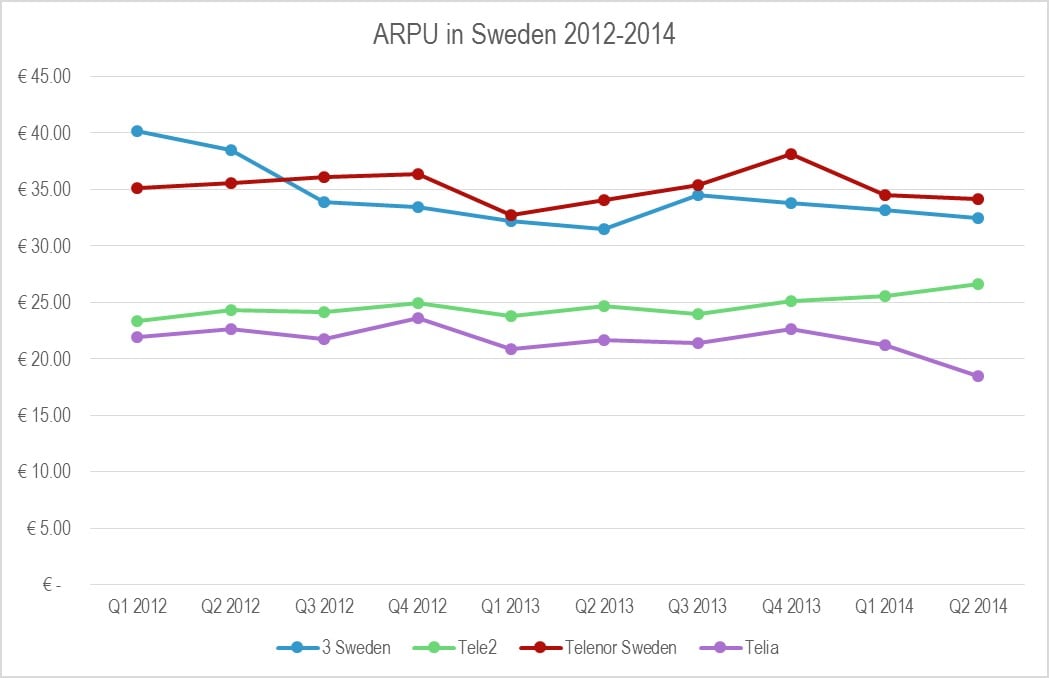
  • Case study 2: Sweden – Telenor and its competitors
  • The network sharing issue
  • Telenor Sweden: heavy on the 1800MHz
  • Telenor Sweden was an early adopter of Gigabit Ethernet backhaul
  • How Telenor prices its service
  • Case study 3: Free Mobile
  • Free: a narrow sliver of spectrum, or is it?
  • Free Mobile: backhaul excellence through extreme fixed-mobile integration
  • Free: the ultimate in simple pricing
  • Discussion
  • IP networking metrics: not yet predictive of operator performance
  • Network sharing does not obviate differentiation
  • What is Vodafone’s strategy for fibre in the backhaul?
  • Conclusions


  • Figure 1: Strategic divergence in the US
  • Figure 2: Four carriers, four fates
  • Figure 3: Applying the screen to European carriers
  • Figure 4: Free Mobile, a disruptive force that’s literally off the charts
  • Figure 5: The differences are if anything more pronounced within Europe at the level of the major multinationals
  • Figure 6: Although Vodafone UK and O2 UK share a physical network, O2 is heading for VZW-like territory while VF UK is going nowhere fast
  • Figure 7: Strategic divergence in the UK
  • Figure 8: 3UK, also something of an ARPU star
  • Figure 9: 3UK is very different from Hutchison in Italy or even Sweden
  • Figure 10: 3UK has more spectrum on a per-subscriber basis than Vodafone
  • Figure 11: Vodafone’s backhaul upgrades are essentially microwave; 3UK’s are fibre
  • Figure 12: 3 Europe is more than coping with surging data traffic
  • Figure 13: 3UK service pricing
  • Figure 14: The Swedish market shows a clear winner…
  • Figure 15: Telenor.se is leading on all measures
  • Figure 16: How Swedish network sharing works
  • Figure 17: Network sharing does not equal identical performance in the UK
  • Figure 18: Although extensive network sharing complicates the picture, Telenor Sweden has a strong position, especially in the key 1800MHz band
  • Figure 19: If the customers want more data, why not sell them more data?
  • Figure 20: Free Mobile, network differentiator?
  • Figure 21: Free Mobile, the price leader as always
  • Figure 22: Free Mobile succeeds with remarkably little spectrum, until you look at the allocations that are actually relevant to its network
  • Figure 23: Free’s fixed-line network plans
  • Figure 24: Free leverages its FTTH for outstanding backhaul density
  • Figure 25: Free: value on 3G, bumper bundler on 4G
  • Figure 26: The carrier with the most IPv4 addresses per subscriber is…
  • Figure 27: AS_PATH length – not particularly predictive either
  • Figure 28: The buzzword count. “Fibre” beats “backhaul” as a concern
  • Figure 29: Are Project Spring’s targets slipping?


Strategy 2.0: What Skype + Microsoft means for telcos

Summary: in theory, Microsoft and Skype have the resources, the brands, the customer base and the know-how to shape the future of telecoms and become a strategic counterweight to Apple and Google. Can they do it – and what should telcos’ strategy be? (June 2011, Executive Briefing Service, Dealing with Disruption Stream).

Microsoft Skype Logo Image Medium


This page contains an excerpt from the report, plus detailed contents, figures and tables, and a summary of the companies, products, technologies and issues covered.


Read in Full (Members only)    Buy This Report    To Subscribe

(The 35 page PDF format report is available in full to Members of the Telco 2.0 Executive Briefing Service and the Telco 2.0 Dealing with Disruption Stream here. Non-members can buy a Single User license for this report online here for £995 (+VAT) or subscribe here. For multiple user licenses or other enquiries please email contact@telco2.net or call +44 (0) 207 247 5003.)

To share this article easily, please click:

//

Introduction: Skype, the Original ‘Voice 2.0’

Everyone knows Skype as the original Voice 2.0 company – providing free phone calls, free video, status updates, all delivered using an innovative peer-to-peer architecture, and with the unique selling point of VoIP that just worked. This report describes its business model, technology strategy, its acquisition by Microsoft, and the consequences for the telecoms industry.

A little history

Founded in 2003 by Janus Friis and Niklas Zennström, Skype was acquired by eBay in 2005 for $2.6bn. eBay ownership was a period of stagnation – although eBay also owns PayPal, it only made half-hearted efforts to integrate the two. In November 2009, eBay sold 65% of Skype to an investor group led by Silver Lake for approximately $1.9bn in cash, valuing Skype at $2.75bn.

With Skype preparing for an IPO, Microsoft announced in May 2011 that it had agreed to buy the company for $8.5bn, giving the investor group a massive return and ensuring future potentially-disruptive start-ups will also attract plenty of funding. Many commentators have suggested that Microsoft is paying too much for the VOIP company, although the price-earnings ratio is actually no higher than that of Cisco’s acquisition of WebEx. So, what exactly is Microsoft getting for its billions? Let’s take a closer look.

A Dive into Skype’s Accounts

Microsoft has acquired what is essentially a global telephony company with 663 million registered users and very significant gross profitability. Skype contributed more net new minutes of international voice than the rest of the industry put together in 2010, according to Telegeography. Skype has never struggled to achieve growth, but its profitability has often been criticised, as has its ability to generate growth in ARPU. The following chart (figure 1) summarises Skype’s operational key performance indicators (KPIs) since 2006.

Figure 1: Skype’s KPIs: users, usage, and ARPU

Telco 2.0 Skype KPIs Users and ARPU June 2011 Graph Chart v1

Source: Skype’s S-1, May 2011

Questions have been raised about Skype’s performance in converting registered or even active users into paying users. This is critical, as ARPU is relatively flat. However, a monthly ARPU for paying users of $8 would be considered very reasonable for an emerging-market GSM operator and such an operator would tie up far more capital than Skype does. As all Skype users contribute to the system’s peer-to-peer (P2P) infrastructure, the marginal cost of serving non-paying users is essentially nothing.

Another way of looking at the KPIs is to consider their growth rates, as we have done in the following chart (figure 2). Although the growth of paying users is nowhere near as fast as that of free minutes of use, 40% growth per annum in revenue-generating subscribers is still very impressive.

Figure 2: Growth rates of Skype KPIs.

Telco 2.0 Skype KPIs Growth June 2011 Graph Chart

Source: Skype’s S-1, May 2011

In fact, there is very little wrong with Skype at the operating level. The following chart (figure 3) shows that, if we consider the primary challenge for Skype to be converting free users into paying users, it is actually doing rather well. Revenue and EBITDA are advancing and margins are holding up well.

Figure 3: Revenue and EBITDA growth is strong

Telco 2.0 Skype KPIs 5 Years Revenue and EBITDA June 2011 Graph Chart

Source: Skype S-1, May 2011

With 509 million active users available for conversion, ARPU may not be that relevant – just converting users of the free service into paying users has so far provided strong growth in gross profits and could do for the foreseeable future.

Figure 4: Conversion of free users at steady ARPU drives gross profit.

Telco 2.0 Skype Gross Profits June 2011 Graph Chart

Source: Skype S-1, May 2011

Skype doesn’t make money on free calls (not even from advertising or customer analytics/insights, yet), and has to pay interconnection fees and operate some infrastructure in order to provide SkypeOut (calls to conventional telephone numbers, rather than other Skype clients), and SkypeIn (calls from the PSTN to Skype users).

Skype sceptics have argued that eventually termination charges will catch up with the company and destroy its profitability. It is true that most of Skype’s revenues are generated (over 80%) by SkypeOut call charges and that Skype’s cost of net revenue is dominated (over 60%) by the cost of terminating these calls. However, termination as a percentage of Skype’s cost of net revenue is falling and Skype’s gross margin is rising, as its enormous volume growth enables it to extract better bulk pricing from interconnect operators (see Figure 5).

To see Figure 5, the conclusion of our analysis of Skype’s finances, and…

  • Is Skype Accumulating “Technical Debt”?
  • Future Plans: The Core Business, The Enterprise & Facebook
  • Telcos and Skype
  • Enter Microsoft
  • Windows Phone 7: Relevant again?
  • Microsoft’s other mobile allies: Nokia, RIM
  • How Microsoft will deploy Skype
  • Developers, developers, developers
  • Key Risks and Questions: execution, regulatory, partners, advertisers & payments
  • Answers: How Telcos should deal with Skype…and Microsoft

…plus these additional figures & fables…

  • Figure 5: How Skype’s spending is changing
  • Figure 6: Why Skype is making a loss
  • Figure 7: Commoditisation is for everybody!
  • Figure 8: 3UK benefits from its deal with Skype
  • Figure 9: Skype’s Deals with Carriers
  • Figure 10: Skype is a good fit for many Microsoft products
  • Figure 11: A unifying Skype API is critical for integration into the Microsoft empire
  • Figure 12: Telco strategy options matrix


Members of the Telco 2.0 Executive Briefing Subscription Service and the Telco 2.0 Dealing with Disruption Stream can download the full 35 page report in PDF format here. Non-Members, please see here for how to subscribe, here to buy a single user license for for £995, or for multi-user licenses and any other enquiries please email contact@telco2.net or call +44 (0) 207 247 5003.

Organisations, products and people referenced in the report: 3UK, AdSense, Android, Apple, AT&T, Au, Avaya, Ben Horowitz, BlackBerry Messenger, Cisco, Dynamics CRM, EasyBits, eBay, Exchange Server, Facebook, Facetime, Google, Google Talk, Google Voice, GSMA, Happy Pipe, Hutchison, iOS, iPhone, Jajah, Janus Friis, KDDI Mobile, Kinect, KPN, Lync, Mango, Marchex, Microsoft, Microsoft-Nokia deal, MXit, MySpace, Niklas Zennström, Nokia, Ofcom, Office Live, Outlook, PayPal, PowerPoint, Qik, RIM, Silver Lake, Skype, SkypeConnect, SkypeIn, SkypeKit, SkypeOut, SkypePhone, Steve Ballmer, Telefonica, Teredo, Tony Jacobs, Tropo, Twitter, Verizon Wireless, Virgin, Visual Studio, WebEx, WhatsApp, Windows Mobile, Windows Phone 7, WP7, Xbox, X-Series.

Technologies referenced: GSM, HD voice, HTTP/S, IM, IMS MMTel, IP networks, IPv4, IPv6, LTE, Mobile, NAT, P2P, PSTN, RCS, SILK V3, SIP, SMS, SS7, super node, URI, video telephony, Voice 2.0, VoIP, XMPP.