4G success factors: What’s driving results in APAC?

Introduction: 4G strategies need the right market conditions to take off

Implementing 4G can help operators increase ARPU by reducing churn, offering a platform for new services, and encouraging increased data use. 4G networks also give operators greater control over data traffic management, and can ease pressure on overloaded 3G networks.

However, rates of adoption are not the same in every market. Therefore, for operators to successfully implement 4G and drive high adoption, they need to understand which key factors influence 4G adoption the most, and how they should adapt their strategies accordingly.

The Asia-Pacific (APAC) region encompasses over 30 individual countries and is home to more than half the world’s population. The range of economic, geographic, societal, and technological factors within the region is incredibly diverse: for example, at one end of the scale countries like Japan, Australia and South Korea enjoy high standards of development and technology adoption, and at the other there are countries like Nepal and Bangladesh, which are still developing. The region is also home to China and India, two countries that have undergone incredibly fast economic development over the past few decades, and emerged as important global markets – several other countries in the region are expected to follow suit in the future. Other influential factors such as government technology policies and market dynamics such as competition also vary widely.

For telcos outside this region looking in, some APAC countries will be trailblazers for new technologies like 5G, and other APAC countries will be attractive investment opportunities because of their potential for rapid development. To understand where opportunities lie – both for investment opportunities and for case studies to learn from – telcos need to study the region at an individual market level.

This report is the first of two that focus on the 4G market in APAC. This report uses quantitative and qualitative analysis to identify:

  • Which economic conditions influence 4G adoption the most
  • Where 30 individual countries are in their 4G adoption journey (and, implicitly, their path to 5G)
  • What prospects these countries have for further 4G growth
  • And what strategies operators should use to encourage 4G adoption

Contents:

  • Executive Summary
  • 1. Introduction: 4G strategies need the right market conditions to take off
  • Methodology
  • 2. APAC – a region of challenge and opportunity
  • Why should operators invest in 4G?
  • A potentially huge 4G market
  • 3. Diversity across the region means a “one size fits all” approach won’t work
  • Urbanisation and GNI per capita have the strongest correlation with 4G adoption…
  • Which countries have the most potential?
  • Qualitative factors also influence 4G adoption
  • 4. Quadrant analysis and country profiles
  • Quadrant I – 5G front-runners and 4G champions
  • Quadrant IV – High growth potential, but can it be realised?
  • Quadrant III – Challenging environment, but some exciting opportunities
  • 5. Recommendations and conclusions

Figures:

  • Figure 1: Comparing 4G penetration to adoption environment
  • Figure 2: APAC has the largest population in the world
  • Figure 3: And has more 4G subscribers by volume
  • Figure 4: But APAC has not yet fulfilled its 4G potential
  • Figure 5: APAC could be a 3 billion subscriber market
  • Figure 6: Analysis of 30 individual countries
  • Figure 7: Comparing 4G penetration to adoption environment
  • Figure 8: Quadrant I 4G adoption
  • Figure 9: Quadrant I heatmap scores
  • Figure 10: Quadrant IV 4G adoption
  • Figure 11: Quadrant IV heatmap scores
  • Figure 12: In eight countries 4G adoption is currently low but could take off
  • Figure 13: Quadrant III, Group 1 heatmap scores
  • Figure 14: Nine countries will continue to have slow 4G adoption
  • Figure 15: Quadrant III, Group 2 heatmap scores

Growing the Digital Economy: Lessons from Brazil, Mexico, and Iran

Introduction

Recent data on the growth of the Internet shows that different public policies have dramatically different impacts. In Latin America, two nations following very similar policies are achieving spectacular success, both in terms of raw quantity and in terms of deeper qualitative improvement, while other countries, sometimes with higher per-capita GDP, pursue different policies and see radically worse results.

In the Middle East, there is evidence of a similar breakout to development in some surprising countries, which turn out to be adopting key elements of the policy mix that has been successful in Latin America.

Renesys, a US company which provides software tools to monitor Border Gateway Protocol BGP routing activity, also collects large amounts of data on the structure of the Internet as a by-product of this activity. In May 2013, they issued a fascinating blog post, which drew attention to the dramatic development gap emerging between – for example – Brazil and Argentina on one hand, and Mexico on the other.

AS numbers: a key metric for Internet participation

What Renesys was looking at was the count of ASNs (Autonomous System Numbers) over time, a measure that we believe gives an excellent and profound indication of the development of the internet.

ASNs identify networks that control their own routing policy and IP address block. The voluntary interconnection of autonomous systems through BGP routing, which is based on AS numbers, makes up the fundamental structure of the Internet. In this sense, counting ASNs is a better metric than counting subscribers, domain names, Web sites, or IP addresses, because it is a measurement of participation in the Internet, not just consumption of cat videos and Google adverts. The creation of new ASNs is evidence that new businesses, organisations, content providers, hosting and cloud computing providers, and ISPs are emerging. It is evidence that technical competence is diffusing through society.

Because an ASN is the entry ticket to Internet peering, it’s also evidence of growing direct interconnection between networks, the fundamental purpose of the Internet, and the source of reliable, resilient, and high-performance service. In important ways, more AS numbers shows not just quantitative growth, but also qualitative improvement.

So how does the scoreboard look?

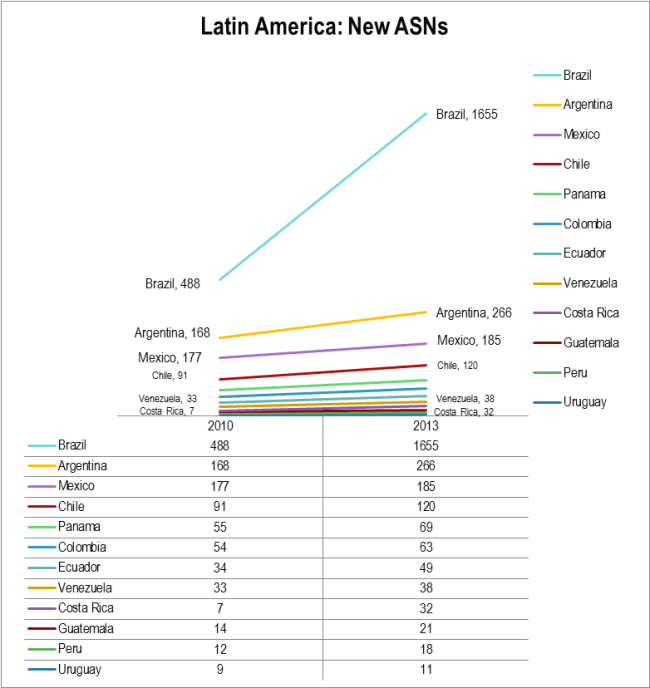
Figure 1: Brazil & Argentina Lead The Way
Latin America: New ASNs Feb 2014

Source: Renesys data, STL Partners visualisation

Argentina is doing well; Brazil is doing incredibly well; Mexico is either stable, or stagnant. We’ve labelled the chart selectively, so you can also see that among the poorer and smaller Latin American nations, Costa Rica is doing very well while Venezuela is doing poorly.

Mexico’s per-capita GDP at purchasing-power parity was calculated at $15,312 in 2012 dollars by the IMF, whereas Argentina’s was $18,112. But this gap doesn’t explain what’s going on here. Brazil’s was $11,875, and the Brazilian Internet is doing even better. Clearly, money is not enough. Every year, Brazil adds as many ASNs as there are in the whole of Mexico. This is a reflection of vastly different government policy and market structure. Similarly, there doesn’t seem to be any reliable link between population, ASN growth, or how many citizens there are for each ASN, as the following chart shows. Even GDP is a very weak predictor.

Figure 2: Policy, not population or GDP, drives Internet growth
It's not population nor GDP Feb 2014

Source: STL, IMF data, ANATEL


  • Executive Summary
  • What did Brazil get right?
  • A More Democratic Internet: Understanding the Problem from a Latin American Viewpoint
  • A Policy Mix That Supports Innovators
  • What did Mexico and others do wrong?
  • Monopolies lead to inertia
  • State Telecoms: not a great strategy either
  • Taking A Similar View On The Middle East
  • Censorship and Internet Development
  • Wholesale Transit as a Weapon
  • Conclusions
  • About STL Partners


  • Figure 1: Brazil & Argentina Lead The Way
  • Figure 2: Policy, not population or GDP, drives Internet growth
  • Figure 3: Brazil has been adding 700+ new local ISPs a year
  • Figure 4: The Middle East by ASN count
  • Figure 5: Iran’s Internet Flourishes Behind the Firewall
  • Figure 6: In the Middle East, it’s policy that matters too