For ‘Personal Data’ to realize its potential as a new class of economic asset there needs to be a global, cross-industry approach that empowers and protects consumer users, enables businesses, and that has scope for appropriate governance. This report is a summary of the significant progress made towards this aim made by the World Economic Forum’s Re-thinking Personal Data ‘Tiger Team’, facilitated by STL Partners with the support of the Personal Data Ecosystem Consortium, MIT Media Lab, Microsoft, Ctrl-Shift and other leading experts, at meetings held in March 2012 in San Jose, and in London in June 2012. (July 2012)
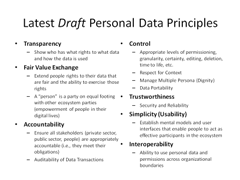
WEF Personal Data principles draft June 2012 small