
Protected: Reversing telco decline: How to grow from next-gen networks and edge
There is no excerpt because this is a protected post.

There is no excerpt because this is a protected post.
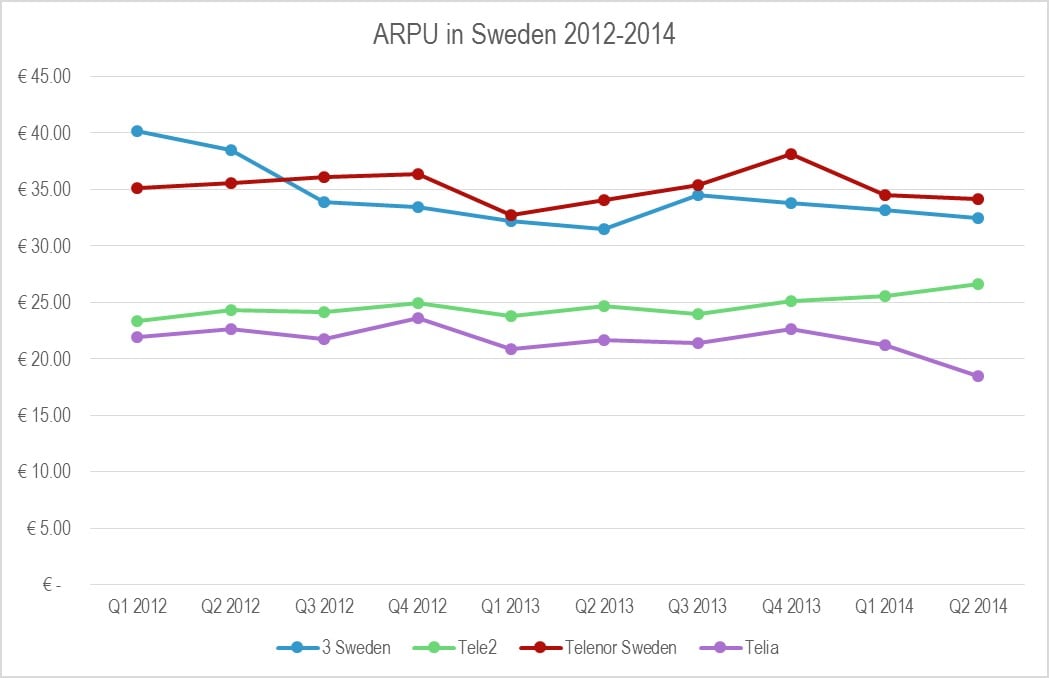
A small and surprising set of national operators are delivering outstanding performance in the challenging European market. Our analysis shows how they’re achieving differentiation with smart strategies that target the hottest customer need, and the considerable ramifications for the rest of the market.
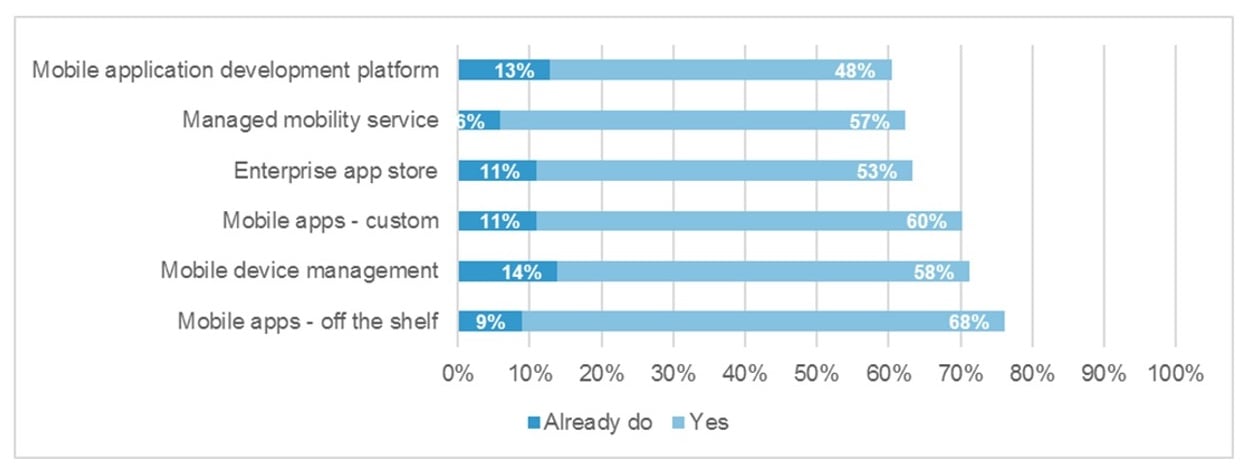
Our new global research among enterprises and telcos shows that many telcos are ideally positioned, but underprepared, to exploit the fast emerging and evolving $50bn Enterprise Mobility opportunity. How can telcos address this gap?
The Cloud market is on the verge of the next wave of market penetration, yet it’s likely that only one in five Cloud Service Providers (CSPs) in today’s marketplace will still be around by 2018, as providers fail or are swallowed up by aggressive competitors. So what do CSPs need to do to survive and prosper? (October 2013, Foundation 2.0, Executive Briefing Service, Cloud & Enterprise ICT Stream.)
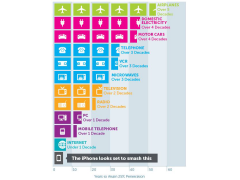
Technology adoption rates Sept 2013