BBVA: Traditional retail bank embraces digital disruption

Introduction

Why are we doing non-telco case studies?

Digital transformation is a phenomenon that is affecting every sector. Many industries have been through a transformation process far more severe than we have seen in telecoms, while others began the process much earlier in time. We believe that there are valuable lessons telcos can learn from these sectors, so we have decided to find and examine the most interesting and useful case studies.

Traditional banking is being disrupted by fintech. This disruption has not happened overnight, but its speed has accelerated in recent years as consumers and enterprises have become more confident using digital tools to manage their finances. Although the fintech market is currently highly fragmented, with fintech companies typically focussing on one or two specific financial products, this can still have an enormous impact on the traditional banking value chain, which relies on a diversified portfolio to create profit. In addition, there is the threat that a digital native company, such as Amazon or Google, will enter the mainstream banking market through a series of acquisitions.

BBVA’s chairman, Francisco Gonzalez, foresaw this threat early-on, and has worked tirelessly to restructure the bank to be competitive in the era of digital banking. This transformation has involved significant changes in leadership, technology, business processes, and the bank’s portfolio. Like telcos, traditional banks are large organisations with legacy technology and processes, and turning the ship around is challenging. Therefore, there are many ways that BBVA’s experience can inform telcos’ own digital transformation strategies.

Enter your details below to request an extract of the report

var MostRecentReportExtractAccess = “Most_Recent_Report_Extract_Access”;
var AllReportExtractAccess = “All_Report_Extract_Access”;
var formUrl = “https://go.stlpartners.com/l/859343/2022-02-16/dg485”;
var title = encodeURI(document.title);
var pageURL = encodeURI(document.location.href);
document.write(‘‘);

General outline of STL Partners’ case study transformation index

We intend to complete more case studies in the future from other industry verticals, with the goal of creating a ‘case study transformation index’, illustrating how selected companies have overcome the challenge of digital disruption. In these case studies we are examining five key areas of transformation, identifying which have been the most challenging, which have generated the most innovative solutions, and which can be considered successes or failures. These five areas are:

  • Market
  • Proposition
  • Value Network
  • Technology
  • Finances

We anticipate that some of these five sections will overlap, and some will be more pertinent to certain case studies than others. But central to the case studies will be analysis of how the transformation process is relevant to the telco industry and the lessons that can be learned to help operators on the path to change.

How digital disruption is threatening banking

Retail banks rely on a two-sided business model

Retail banks make money by using deposits in current or savings accounts made by one group of customers (depositors) to finance loans to other customers (borrowers). The borrower not only pays the bank back its loan, but also interest on top – in effect, paying the bank for the service of providing the loan. The bank pays the depositor a lower interest on savings, and makes money on the spread between the two rates of interest.

Retaining depositors is a vital part of retail banks’ business model

Source: STL Partners

While this is highly simplified, this is the fundamental business model of all traditional retail banks, whose main source of income is created through managing a diversified portfolio of financial products across savings and loans. Banks also make money from applying charges when customers use credit or debit cards, or charging its customers fees such as ATM fees, overdraft fees, late payment fees, penalty fees.

Societal changes have driven digital banking adoption

Digital disruption in banking has taken much longer than in other industries, for example, publishing and media, despite attempts from banks themselves to persuade more customers to use online services. For traditional banks, moving customers to digital channels for most of their banking needs could significantly cut the cost of maintaining and staffing a large network of physical branches. However, when online banking services were first launched in the 1980s and 90s, consumer concerns about security and a lack of confidence in managing accounts themselves online meant that adoption was slow.

Since then the market has changed: For example, in 2000, 80% of banks in the U.S. were offering internet banking services. The launch of the iPhone seven years later caused a paradigm shift, triggering a wave of enormous development and widespread adoption of digital services accessible online and via smartphone apps. Ten years on, consumers are much more confident using digital financial services, and, although younger consumers are leading adoption, older generations are also increasingly using these services.

To read on about how BBVA responded to a changing market, please login and download the report, or contact us to subscribe.

Contents:

  • Executive Summary
  • Six lessons telcos can learn from BBVA
  • BBVA in STL Partners’ transformation index
  • Introduction
  • Why are we doing non-telco case studies?
  • General outline of STL Partners’ case study transformation index
  • How digital disruption is threatening banking 
  • Retail banks rely on a two-sided business model
  • Societal changes have driven digital banking adoption
  • Challenger banks and fintechs are changing the game
  • BBVA’s story
  • Phase one: Investing in technology to catalyse change
  • Phase two: Organisational change
  • Conclusions
  • BBVA in STL Partners’ transformation index
  • Appendix

Figures:

  • Figure 1: BBVA is rated as “Green” (good) in the STL Partners’ Transformation Index
  • Figure 2: Retaining depositors is a vital part of retail banks’ business model
  • Figure 3: The digital banking generation gap is closing
  • Figure 4: The sharing economy has taken off
  • Figure 5: BBVA’s global presence
  • Figure 6: Telcos need to virtualise their core to deliver cloud business models
  • Figure 7: Digital experience needs to be distributed across the organisation for transformation to succeed
  • Figure 8: BBVA’s leadership team is structured to accelerate digital transformation
  • Figure 9: Traditional banks need to adopt agile processes to compete with digital-native competitors
  • Figure 10: Ecosystem markets need new business models
  • Figure 11: BBVA’s co-opetition strategy involves acquisitions, investments and open APIs
  • Figure 12: BBVA’s shares are performing well
  • Figure 13: More smart and mobile device owners in Turkey use their devices for digital banking services than any other country surveyed
  • Figure 14: Turkey leads the way in four out of seven digital banking services
  • Figure 15: Turkish respondents are the most open to automated digital banking services
  • Figure 16: Less than 60% of Turkish adults had a bank account in 2014
  • Figure 17: Turkey is an attractive emerging market for investment
  • Figure 18: BBVA is rated as “Green” (good) in the STL Partners’ Transformation Index

Enter your details below to request an extract of the report

var MostRecentReportExtractAccess = “Most_Recent_Report_Extract_Access”;
var AllReportExtractAccess = “All_Report_Extract_Access”;
var formUrl = “https://go.stlpartners.com/l/859343/2022-02-16/dg485”;
var title = encodeURI(document.title);
var pageURL = encodeURI(document.location.href);
document.write(‘‘);

AccorHotels: From hotelier to digital marketplace

Introduction

Why are we doing non-telco case studies?

Digital transformation is a phenomenon that is affecting every sector. Many industries have been through a transformation process far more severe than we have seen in telecoms, while others began the process much earlier in time. We believe that there are valuable lessons telcos can learn from these sectors, so we have decided to find and examine the most interesting/useful case studies.

In this report, we look at French hotel chain AccorHotels, which has undertaken an ambition transformation from hotel owner and operator into a digital platform for independent hotels. While our previous case study, publisher Axel Springer, has completed its transformation, AccorHotels has achieved significant changes but remains some years away from reaching its longer-term ambitions. However, because hotel groups and telcos share many similarities, such as being in the service industry, owning physical infrastructure and having highly distributed assets, we can draw many useful lessons from AccorHotels’ experience.

Like in previous transformation case studies, the key takeaways from our analysis of AccorHotels’ strategy will be the lessons for telcos to help them make their own transformation process run more smoothly.

General outline of STL Partners’ case study transformation index

We intend to complete more case studies in the future from other industry verticals, with the goal of creating a ‘case study transformation index’, illustrating how selected companies have overcome the challenge of digital disruption. In these case studies we are examining five key areas of transformation, identifying which have been the most challenging, which have generated the most innovative solutions, and which can be considered successes or failures. These five areas are:

  • Market
  • Proposition
  • Value Network
  • Technology
  • Finances

For each section, supporting evidence of good or bad practice will be graded as a positive (tick), a negative (cross) or a work in progress (dash). These ticks, crosses and dashes will then be evaluated to create a “traffic light” rating for each section, which will then be tallied to provide an overall transformation rating for each case study.

We anticipate that some of these five sections will overlap, and some will be more pertinent to certain case studies than others. But central to the case studies will be analysis of how the transformation process is relevant to the telco industry and the lessons that can be learned to help operators on the path to change.

Contents:

  • Executive Summary
  • AccorHotels’ transformation experience – a summary of key lessons
  • The AccorHotels story in brief
  • AccorHotels in STL Partners’ transformation index
  • Introduction
  • Why are we doing non-telco case studies?
  • General outline of STL Partners’ case study transformation index
  • Drawing the parallels between hotels and telecoms
  • What does a hotel business look like?
  • How the Internet changed the hotel industry
  • Accor in context of leading global hotel chains
  • A successful transformation, so far
  • AccorHotels’ transformation strategy
  • Part 1: Separating property and services into distinct business lines
  • Part 2: From digital platform to marketplace
  • Part 3: Cultural transformation
  • Part 4: Invest in innovation
  • Conclusion
  • AccorHotels in STL Partners’ transformation index

Figures:

  • Figure 1: OTAs cut into hotels’ share of the hospitality industry
  • Figure 2: Comparison of leading global hotel chains
  • Figure 3: AccorHotels revenues and profitability are ticking up
  • Figure 4: Accor outperforms on growth of average revenue per room
  • Figure 5: AccorHotels property investments
  • Figure 6: Solid growth in profitability
  • Figure 7: AccorHotels eight digital hospitality programmes
  • Figure 8: Steady growth in loyalty programme subscribers
  • Figure 9: Accor acquires software expertise and reach to challenge OTAs
  • Figure 10: AccorHotels is gaining traction with digital services
  • Figure 11: AccorHotels still has some digital distance to go
  • Figure 12: AccorHotels digital services investment plan
  • Figure 13: AccorHotels acquisitions fuel business innovation
  • Figure 14: Digital M&A investment as a % of service revenue, 2012 – H1 2017
  • Figure 15: AccorHotels scores ‘Green’ on STL Partners’ transformation index

Transformation: Are telcos investing enough?

Introduction

Why are we doing non-telco case studies?

Digital transformation is a phenomenon that is not just affecting the telco sector. Many industries have been through a transformation process far more severe than we have seen in telecoms, while others began the process much earlier in time. We believe that there are valuable lessons telcos can learn from these sectors, so we have decided to find and examine the most interesting/useful case studies.

In this report, we look at German publisher Axel Springer, which has successfully transformed itself from a print-based publisher to an online multimedia platform.

While the focus of this report will be on Axel Springer’s transformation, the key takeaways will be the lessons for telcos to help them make their own transformation process run more smoothly.

STL Partners has done extensive research into the challenge of telco transformation and how to implement effective business model change, most recently in our reports Five telcos changing culture: Lessons from neuroscience, Changing Culture: The Great Barrier and Which operator growth strategies will remain viable in 2017 and beyond?

General outline of STL Partners’ case study transformation index

We intend to complete similar case studies in the future from other industry verticals, with the goal of creating a ‘case study transformation index’, illustrating how selected companies have overcome the challenge of digital disruption. In these case studies we will examine five key areas of transformation, identifying which have been the most challenging, which have generated the most innovative solutions, and which can be considered successes or failures. These five areas are:

  • Market
  • Proposition
  • Value Network
  • Technology
  • Finances

For each section, supporting evidence of good or bad practice will be graded as a positive (tick) or a negative (cross). These ticks and crosses will then be evaluated to create a “traffic light” rating for each section, which will then be tallied to provide an overall transformation rating for each case study.

We anticipate that some of these five sections will overlap, and some will be more pertinent to certain case studies than others. But central to the case studies will be analysis of how the transformation process is relevant to the telco industry and the lessons that can be learned to help operators on the path to change.

Axel Springer’s transformation – a success story

German publishing house Axel Springer began to suffer from declining revenues in the mid-2000’s as changes in consumer behaviour and disruption from new digital rivals such as Google and Yahoo! led to falling readership. Axel Springer identified this threat immediately and reacted swiftly, making the bold move to cannibalise its core printed newspaper and magazine business by repositioning most of its existing content onto online and digital platforms. The company has continued this transformation with an aggressive acquisition strategy, enabling it to expand its footprint into new geographies and content areas.

Even though Axel Springer’s transformation required sweeping technological, strategic and cultural change, it has been a success. Since the disposal of several non-core regional publications in 2012, both revenues and EBITDA have grown on average nearly 5% per year, while the percentage of revenues from digital streams grew to 67% in 2016 from just 42% in 2012.

Why is the Axel Springer case study relevant for telcos?

Much of Axel Springer’s transformation has consisted of (and been driven by) the change from traditional (print) to digital (online) publishing. While telcos have grown up in the digital era, with much of their transformation being driven by changes in consumer behaviour, there are many parallels between Axel Springer and the telco sector. We will look at the key lessons that can be learnt in the following areas:

  • Advances in technology
  • Changes in consumption and customer habits
  • The risk of cannibalisation
  • New opportunities in content
  • Working with social media
  • Platform and partnership opportunities
  • Culture change
  • The importance of data

Content:

  • Executive Summary
  • Axel Springer’s transformation success – a summary of key lessons
  • Axel Springer in STL Partners case study transformation index
  • Introduction
  • Why are we doing non-telco case studies?
  • Axel Springer – background to transformation
  • What was Axel Springer’s business model pre-transformation?
  • Drivers of change – how the market developed and Axel Springer’s reaction
  • Conclusions
  • Axel Springer in STL Partners transformation index
  • Appendices
  • Appendix 1: Axel Springer – company timeline
  • Appendix 2: Axel Springer – recent acquisitions
  • Appendix 3: Axel Springer – recent investments

Figures:

  • Figure 1: Total global internet users
  • Figure 2: Traditional publishing company business model
  • Figure 3: Post-digital publishing company business model
  • Figure 4: Axel Springer total revenues 2003-2016
  • Figure 5: Axel Springer total EBITDA and EBITDA margin 2003-2016
  • Figure 6: The development of news and media consumption
  • Figure 7: Axel Springer 2016 revenues by sector (€ million)
  • Figure 8: Axel Springer percentage of revenues from digital streams
  • Figure 9: Axel Springer revenues by sector 2012-2016
  • Figure 9: Axel Springer investment in acquisitions 2012-H1 2016 in comparison to selected telcos

The Digital Dashboard: How new metrics drive success in telco digital initiatives

Introduction

As core services revenues, margins and cash generation decline quickly, Communications Service Providers (CSPs) are seeking to invest in and grow new (digital) services. STL Partners estimates that digital business should represent 25+% of Telco revenue by 2020 to avoid long-term industry decline. The move to digital is challenging for CSPs.  It will require large established organisations to define and implement new sustainable business models with new services delivered to existing and new customers via new channels and partners underpinned by new technology and supported by new operating, revenue and cost models. This requires a fundamental shift from a traditional infrastructure-based business to a complex amalgam of infrastructure, platform and product innovation businesses:

  • Historically, the telecoms industry has been an infrastructure business. It has invested large amounts of capital on things such as spectrum purchases, fibre and tower deployments. The result has been three largely undifferentiated services and revenue streams that have been ‘bundled in’ with the networks – voice, messaging and data. In the past, being a good communications service provider involved:
    • Making effective capital investment decisions, and then
    • Operating the network efficiently and affectively.
  • The Internet has changed everything by fracturing the integration between the network and services so that voice and messaging are no longer the sole domain of CSPs. CSPs now need to continue to hone their infrastructure business skills (in a world where every dollar of revenue is competed for hard by other operators and by ‘OTT’ players), and must also develop a range of new skills, assets, partnerships, customer relationships and operating and financial models if they are to compete in the new digital service areas.

In our recent survey (see Reality Check: Are operators’ lofty digital ambitions unrealistic given slow progress to date?), Telco practitioners were asked to comment on the importance of nine things that needed to be addressed to complete their digital business model transformation and the progress made to tackle them (see Figure 1).

Figure 1: Digital metrics should be driving change at CSPs but are themselves proving difficult to implement


Source: STL Partners/Telco 2.0 Operator Survey, November 2014

Measurement using new digital operational/financial metrics was highlighted in the global survey as one of the ‘big 6’ challenges that need to be addressed for CSPs to be successful in future. However, to date, it has often been neglected by CSPs (metrics are often an after-thought and not an integral part of the digital transformation process).

In this report, we argue that the reverse is true: effective metrics lie at the heart of change. Without measurement, it is impossible to make decisions and engender change: an organisation continues on its existing path even if that ultimately leads to decline. We will:

  1. Look at why it is important to capture, synthesise and act upon appropriate metrics.
  2. Examine traditional and new approaches to the use of performance metrics and identify the factors that contribute to success and failure.
  3. Highlight ‘telco best-practice’ via a case-study from a leading Asian CSP, Telkom Indonesia.

Why metrics matter

There is a common misconception that start-ups and digital companies do not – and do not need to – measure and report the performance of their businesses and initiatives. Digital start-ups are often portrayed as small creative teams working on ‘exciting stuff’ with no sense of business rigour or control. This could not be further from the truth. Most start-ups follow a LEAN & agile approach to product ideation and development are steered by one motto… “What you cannot measure, you cannot manage”.  This is even more true if they are VC-backed and therefore reliant on hitting specific targets to receive their next round of funding.

Start-ups rely on operational and actionable metrics to measure progress, identify when to pivot as an organisation and translate strategic objectives into daily activities. By applying the “Build – Measure – Learn” concept (see Figure 2), innovators create something (Build), evaluate how well it is received (Measure), and adjust it in response to the feedback they receive (Learn).

Figure 2: “Build – Measure – Learn” concept

Source: LEAN Analytics – Use Data to Build a Better Startup Faster

Metrics evolve over time. Start-ups are continuously searching for the ‘right’ metrics at any given stage of their development because their businesses are constantly evolving – either because they have just started on their journey or because they may have recently changed direction (or ‘pivoted’ from their original value proposition). Metrics are perceived as an operational toolset to quickly iterate to the right product and market before the money runs out. This ‘sword of Damocles’ hanging over entrepreneurs’ heads is a world away from the world inhabited by telcos’ employees.

Indeed, CSPs’ current approach to business targets & funding allocation is unlikely to create a sense of urgency that will drive and stimulate the success of digital initiatives. Based on extensive interviews with CSPs, digital start-ups and VCs, STL Partners concludes that CSPs should focus on:

  • Removing the Telco ‘safety net’. To succeed in creating truly compelling customer experiences CSPs need to mimic a VC-like environment and create a culture of higher-reward in return for higher risk by targeting employees more tightly on their digital initiative’s performance:

    • Reward success more heavily: this could be ‘shadow’ share options in the venture which yield value in the form of shares or cash bonus for hitting targets which would takes an employee’s overall package way beyond what could be earned in the core business.

    • Create risk for individuals: the quid pro quo of a big upside could be a reduced salary to, say, 60% of normal Telco pay (i.e. similar to what might be earned in a typical start-up) or offer contracts that only renew if an initiative hits its targets – if you fall short, you leave the business and are not simply moved elsewhere in the organisation.

  • Adopting ‘start-up culture’ and ways of thinking. For example, when negotiating for funds, employees should be negotiating for their survival, not for a budget or a budget increase. Also, Telcos should start using the vocabulary / parlance commonly used in the digital space as such burn rate, time before cash runs out, cash break-even date, etc.

  • Establishing new processes to manage KPIs and performance metrics. In the fast-paced digital environment, it usually does not make sense to use 18-24 month targets derived from a detailed business case backed by financial metrics (such as revenue, EBITDA, etc.) – particularly for early-stage start-ups.  Google actually identified a move away from this approach to one focused on a stable strategic foundation (make sure the initial proposition is viable by defining a clear problem we are trying to solve and how the solution will differentiate from alternative solutions) + fluid plans as one of the pillars of its success (see Figure 3
    08D0C9EA79F9BACE118C8200AA004BA90B02000000080000000E0000005F005200650066003400310032003500330036003000380034000000

    08D0C9EA79F9BACE118C8200AA004BA90B02000000080000000E0000005F005200650066003400300039003500320034003300340038000000
    )

Figure 3: Business plan and financial metrics are out-of-date in a digital world

Source: How Google works, Eric Schmidt, Jonathan Rosenberg and Alan Eagle

Metrics are a powerful tool that CSPs should use to foster sustainable commercial growth through validated learning. Unfortunately, metrics are often an “after-thought” and very few CSPs have implemented a consistent approach to metrics.  From a series of interviews, undertaken by STL for this research, it became apparent that most initiatives failed to develop regular reporting that engages (or is even understood by) other stakeholders. At best, operators are inconsistent in tracking digital innovation, at worst, negligent.


  • Executive Summary
  • Introduction
  • Why metrics matter
  • Metrics make a difference: 3 case studies from telecoms operators
  • 3 additional reasons why Telcos need digital metrics
  • Alternative approaches to digital metrics for telecoms operators
  • Introduction
  • The corporate approach – the Balanced Scorecard
  • The start-up approach – LEAN & AARRR methodology
  • Telkom Indonesia’s approach to digital metrics
  • Background
  • Telkom’s current digital strengths
  • Telkom Indonesia’s digital metrics system
  • Benefits of the digital metrics system to Telkom Indonesia
  • Conclusions
  • STL Partners and Telco 2.0: Change the Game


  • Figure 1: Digital metrics should be driving change at CSPs but are themselves proving difficult to implement

  • Figure 2: “Build – Measure – Learn” concept

  • Figure 3: Business plan and financial metrics are out-of-date in a digital world

  • Figure 4: Near perfect correlation between number of agents and number of M-Pesa subscribers, R2 = 0.96

  • Figure 5: Metrics reporting by M-Pesa, December 2012

  • Figure 6: Turkcell’s Mobile Marketing Platform Overview

  • Figure 7: Turkcell’s continuous development of it Mobile Marketing portfolio

  • Figure 8: Libon single roadmap enables rapid evolution and rich features

  • Figure 9: Libon – Cost per Monthly Active Users (M)

  • Figure 10: Illustrative Net Synergy Make up (Hypothetical case)

  • Figure 11: Facebook vs. Yield Businesses: Revenue and Enterprise Value (EV)

  • Figure 12: Facebook: Monthly Active Users vs. Valuation

  • Figure 13: Different players’ metrics requirements

  • Figure 14: Balance Scorecard concept

  • Figure 15: AARRR model

  • Figure 16: Pros & Cons – Summary table

  • Figure 17: Telkom Indonesia’s Metrics Approach – Characteristics

  • Figure 18: Telkom Indonesia’s digital strengths

  • Figure 19: Telcos – slow by design?

  • Figure 20: Telkom Indonesia’s TIMES service portfolio

  • Figure 21: LEAN start-up approach

  • Figure 22: Delivering Innovation – Telkom’s internal organisation

  • Figure 23: Telco 2.0 Domain Framework

  • Figure 24: Metrics Prioritisation & Outcomes Example

  • Figure 25: Governance process – Phase 1 & 2

  • Figure 26: Innovation Governance – Case studies examples

Winning Strategies: Differentiated Mobile Data Services

Introduction

Verizon’s performance in the US

Our work on the US cellular market – for example, in the Disruptive Strategy: “Uncarrier” T-Mobile vs VZW, AT&T, and Free.fr  and Free-T-Mobile: Disruptive Revolution or a Bridge Too Far?  Executive Briefings – has identified that US carrier strategies are diverging. The signature of a price-disruption event we identified with regard to France was that industry-wide ARPU was falling, subscriber growth was unexpectedly strong (amounting to a substantial increase in penetration), and there was a shakeout of minor operators and MVNOs.

Although there are strong signs of a price war – for example, falling ARPU industry-wide, resumed subscriber growth, minor operators exiting, and subscriber-acquisition initiatives such as those at T-Mobile USA, worth as much as $400-600 in handset subsidy and service credit – it seems that Verizon Wireless is succeeding while staying out of the mire, while T-Mobile, Sprint, and minor operators are plunged into it, and AT&T may be going that way too. Figure 1 shows monthly ARPU, converted to Euros for comparison purposes.

Figure 1: Strategic divergence in the US

Figure 1 Strategic Divergence in the US
Source: STL Partners, themobileworld.com

We can also look at this in terms of subscribers and in terms of profitability, bringing in the cost side. The following chart, Figure 2, plots margins against subscriber growth, with the bubbles set proportional to ARPU. The base year 2011 is set to 100 and the axes are set to the average values. We’ve named the four quadrants that result appropriately.

Figure 2: Four carriers, four fates

Figure 2 Four carriers four fate
Source: STL Partners

Clearly, you’d want to be in the top-right, top-performer quadrant, showing subscriber growth and growing profitability. Ideally, you’d also want to be growing ARPU. Verizon Wireless is achieving all three, moving steadily north-west and climbing the ARPU curve.

At the same time, AT&T is gradually being drawn into the price war, getting closer to the lower-right “volume first” quadrant. Deep within that one, we find T-Mobile, which slid from a defensive crouch in the upper-left into the hopeless lower-left zone and then escaped via its price-slashing strategy. (Note that the last lot of T-Mobile USA results were artificially improved by a one-off spectrum swap.) And Sprint is thrashing around, losing profitability and going nowhere fast.

The usual description for VZW’s success is “network differentiation”. They’re just better than the rest, and as a result they’re reaping the benefits. (ABI, for example, reckons that they’re the world’s second most profitable operator on a per-subscriber basis  and the world’s most profitable in absolute terms.) We can restate this in economic terms, saying that they are the most efficient producer of mobile service capacity. This productive capacity can be used either to cut prices and gain share, or to increase quality (for example, data rates, geographic coverage, and voice mean-opinion score) at higher prices. This leads us to an important conclusion: network differentiation is primarily a cost concept, not a price concept.

If there are technical or operational choices that make network differentiation possible, they can be deployed anywhere. It’s also possible, though, that VZW is benefiting from structural factors, perhaps its ex-incumbent status, or its strong position in the market for backbone and backhaul fibre, or perhaps just its scale (although in that case, why is AT&T doing so much worse?). And another possibility often mooted is that the US is somehow a better kind of mobile market. Less competitive (although this doesn’t necessarily show up in metrics like the Herfindahl index of concentration), supposedly less regulated, and undoubtedly more profitable, it’s often held up by European operators as an example. Give us the terms, they argue, and we will catch up to the US in LTE deployment.

As a result, it is often argued in lobbying circles that European markets are “too competitive” or in need of “market repair”, and therefore, the argument runs, the regulator ought to turn a blind eye to more consolidation or at least accept a hollowing out of national operating companies. More formally, the prices (i.e. ARPUs) prevailing do not provide a sufficient margin over operators’ fixed costs to fund discretionary investment. If this was true, we would expect to find little scope for successful differentiation in Europe.

Further, if the “incumbent advantage” story was true of VZW over and above the strategic moves that it has made, we might expect to find that ex-incumbent, converged operators were pulling into the lead across Europe, benefiting from their wealth of access and backhaul assets. In this note, we will try to test these statements, and then assess what the answer might be.

How do European Operators compare?

We selected a clutch of European mobile operators and applied the same screen to identify what might be happening. In doing so we chose to review the UK, German, French, Swedish, and Italian markets jointly with the US, in an effort to avoid a purely European crisis-driven comparison.

Figure 3: Applying the screen to European carriers

Figure 3 Applying the screen to European carriers

Source: STL Partners

Our first observation is that the difference between European and American carriers has been more about subscriber growth than about profitability. The axes are set to the same values as in Figure 2, and the data points are concentrated to their left (showing less subscriber growth in Europe) not below them (less profitability growth).

Our second observation is that yes, there certainly are operators who are delivering differentiated performance in the EU. But they’re not the ones you might expect. Although the big converged incumbents, like T-Mobile Germany, have strong margins, they’re not increasing them and on the whole their performance is average only. Nor is scale a panacea, which brings us to our next observation.

Our third observation is that something is visible at this level that isn’t in the US: major opcos that are shrinking. Vodafone, not a company that is short of scale, gets no fewer than three of its OpCos into the lower-left quadrant. We might say that Vodafone Italy was bound to suffer in the context of the Italian macro-economy, as was TIM, but Vodafone UK is in there, and Vodafone Germany is moving steadily further left and down.

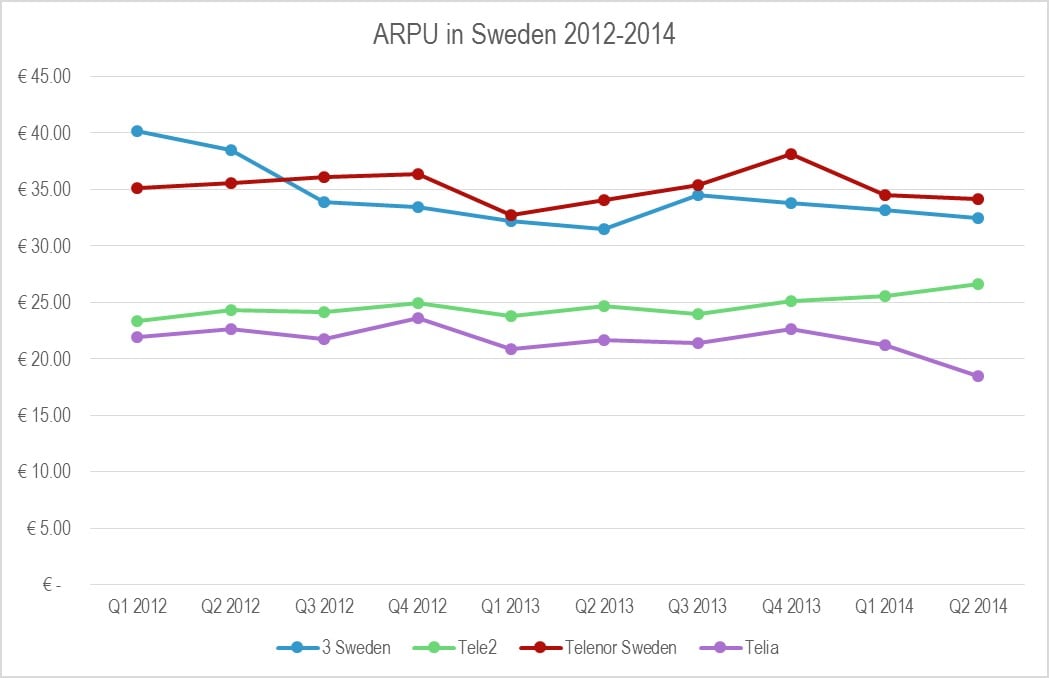
And our fourth observation is the opposite, significant growth. Hutchison OpCo 3UK shows strong performance growth, despite being a fourth operator with no fixed assets and starting with LTE after first-mover EE. Their sibling 3 Sweden is also doing well, while even 3 Italy was climbing up until the last quarter and it remains a valid price warrior. They are joined in the power quadrant with VZW by Telenor’s Swedish OpCo, Telia Mobile, and O2 UK (in the last two cases, only marginally). EE, for its part, has only marginally gained subscribers, but it has strongly increased its margins, and it may yet make it.

But if you want really dramatic success, or if you doubt that Hutchison could do it, what about Free? The answer is that they’re literally off the chart. In Figure 4, we add Free Mobile, but we can only plot the first few quarters. (Interestingly, since then, Free seems to be targeting a mobile EBITDA margin of exactly 9%.)

The distinction here is between the pure-play, T-Mobile-like price warriors in the lower right quadrant, who are sacrificing profitability for growth, and the group we’ve identified, who are improving their margins even as they gain subscribers. This is the signature of significant operational improvement, an operator that can move traffic more efficiently than its competitors. Because the data traffic keeps coming, ever growing at the typical 40% annual clip, it is necessary for any operator to keep improving in order to survive. Therefore, the pace of improvement marks operational excellence, not just improvement.

Figure 4: Free Mobile, a disruptive force that’s literally off the charts

Figure 4 Free Mobile a disruptive force thats literally off the charts

Source: STL Partners

We can also look at this at the level of the major multinational groups. Again, Free’s very success presents a problem to clarity in this analysis – even as part of a virtual group of independents, the ‘Indies’ in Figure 5, it’s difficult to visualise. T-Mobile USA’s savage price cutting, though, gets averaged out and the inclusion of EE boosts the result for Orange and DTAG. It also becomes apparent that the “market repair” story has a problem in that there isn’t a major group committed to hard discounting. But Hutchison, Telenor, and Free’s excellence, and Vodafone’s pain, stand out.

Figure 5: The differences are if anything more pronounced within Europe at the level of the major multinationals

Figure 5 The differences are if anything more pronounced within Europe at the level of the major multinationals

Source: STL Partners

In the rest of this report we analyse why and how these operators (3UK, Telenor Sweden and Free Mobile) are managing to achieve such differentiated performance, identify the common themes in their strategic approaches and the lessons from comparison to their peers, and the important wider consequences for the market.


  • Executive Summary
  • Introduction
  • Applying the Screen to European Mobile
  • Case study 1: Vodafone vs. 3UK
  • 3UK has substantially more spectrum per subscriber than Vodafone
  • 3UK has much more fibre-optic backhaul than Vodafone
  • How 3UK prices its service
  • Case study 2: Sweden – Telenor and its competitors
  • The network sharing issue
  • Telenor Sweden: heavy on the 1800MHz
  • Telenor Sweden was an early adopter of Gigabit Ethernet backhaul
  • How Telenor prices its service
  • Case study 3: Free Mobile
  • Free: a narrow sliver of spectrum, or is it?
  • Free Mobile: backhaul excellence through extreme fixed-mobile integration
  • Free: the ultimate in simple pricing
  • Discussion
  • IP networking metrics: not yet predictive of operator performance
  • Network sharing does not obviate differentiation
  • What is Vodafone’s strategy for fibre in the backhaul?
  • Conclusions


  • Figure 1: Strategic divergence in the US
  • Figure 2: Four carriers, four fates
  • Figure 3: Applying the screen to European carriers
  • Figure 4: Free Mobile, a disruptive force that’s literally off the charts
  • Figure 5: The differences are if anything more pronounced within Europe at the level of the major multinationals
  • Figure 6: Although Vodafone UK and O2 UK share a physical network, O2 is heading for VZW-like territory while VF UK is going nowhere fast
  • Figure 7: Strategic divergence in the UK
  • Figure 8: 3UK, also something of an ARPU star
  • Figure 9: 3UK is very different from Hutchison in Italy or even Sweden
  • Figure 10: 3UK has more spectrum on a per-subscriber basis than Vodafone
  • Figure 11: Vodafone’s backhaul upgrades are essentially microwave; 3UK’s are fibre
  • Figure 12: 3 Europe is more than coping with surging data traffic
  • Figure 13: 3UK service pricing
  • Figure 14: The Swedish market shows a clear winner…
  • Figure 15: Telenor.se is leading on all measures
  • Figure 16: How Swedish network sharing works
  • Figure 17: Network sharing does not equal identical performance in the UK
  • Figure 18: Although extensive network sharing complicates the picture, Telenor Sweden has a strong position, especially in the key 1800MHz band
  • Figure 19: If the customers want more data, why not sell them more data?
  • Figure 20: Free Mobile, network differentiator?
  • Figure 21: Free Mobile, the price leader as always
  • Figure 22: Free Mobile succeeds with remarkably little spectrum, until you look at the allocations that are actually relevant to its network
  • Figure 23: Free’s fixed-line network plans
  • Figure 24: Free leverages its FTTH for outstanding backhaul density
  • Figure 25: Free: value on 3G, bumper bundler on 4G
  • Figure 26: The carrier with the most IPv4 addresses per subscriber is…
  • Figure 27: AS_PATH length – not particularly predictive either
  • Figure 28: The buzzword count. “Fibre” beats “backhaul” as a concern
  • Figure 29: Are Project Spring’s targets slipping?


Full Article: Telenor’s Voice 2.0 Strategy – ‘Mobilt Bedriftsnett’ Case Study

Summary: Telenor’s new ‘Mobile Business Network’ integrates SME’s mobile and fixed phone systems via managed APIs, providing added functionality and delivering greater business efficiency. It uses a ‘two-sided’ business model strategy and targets the market via developers.

Members can download a PDF of this Note here.

Introduction

The enterprise is the key field for new forms of voice and messaging; it’s where the social and economic value of bits exceeds their quantity by the greatest margin, and where the problems of bad voice & messaging are most severe.

People spend hours answering phone calls and typing information into computers – calls they take from people sitting behind computers that are internetworked with the ones they sit behind. Quite often, the answer is to send the caller on to someone else. Meanwhile, other people struggle to avoid calls from enterprises.

mb%20screenshot.jpg

It’s got to change, and here’s a start: Mobilt Bedriftsnett or the ‘Mobile Business Network’ from Telenor.

‘Telenor 2.0’

Telenor are a large, Norwegian integrated telecoms operator, and a pioneer and early adopter of some Telco 2.0 ideas. As long ago as 2001, their head of strategy Lars Godell, was working on an early implementation of some of the ideas we’ve been promoting. They also have an active ‘Telenor 2.0′ strategic transformation programme.

Content Provider Access – CPA – established a standard interface for the ingestion, delivery, billing, and settlement of mobile content of any description that would be delivered to Telenor subscribers, and was the first service of this kind to share revenue from content sales with third parties and to interwork with other mobile and fixed line operators, years before the iPhone or even NTT’s pioneering i-Mode. Later, they added a developer sandbox (Playground) as well.

So, what would they do when they encountered the need for better voice & messaging? The importance of this line of business, and its focus on enterprises, has been part and parcel of Telco 2.0 since its inception (here’s a note on “digital workers” from the spring of 2007, and another on better telephony from the same period), and we’ve only become more convinced of its importance as a wave of disruptive innovators have entered the field.

We spoke to Telenor’s product manager for charging APIs, Elisabeth Falck, and strategy director Frank Elter; they think MB is “our latest move towards Telco 2.0”.

Voice 2.0: despite the changing value proposition…

In the Voice & Messaging 2.0 strategy report, we identified a fundamental shift in the value proposition of telephony; in the past, telephony was scarce relative to labour. That stopped being true between 1986 and 2001 in the US, when the price per minute of telephony fell below that of people’s time (the exact crossover points are 1986 for unskilled workers and landline calls, 1998 for graduates and mobile calls, and finally 2001 for unskilled workers and mobile calls).

Now, telephony is relatively plentiful; this is why there are now call-centre help desks and repair centres rather than service engineers and local repair shops. It’s no longer worth employing workers to avoid telephone calls; rather, it’s worth delivering services to the customer by phone rather than having a field sales or service force. The chart below visualises this relationship.

mb%20mins%20change%20value%20dec%202009.jpg

…and changing position in the value chain…

We also identified two other major trends in voice – commoditisation and fragmentation.

Voice is increasingly commoditised – that is to say, it’s a bulk product, cheap, and largely homeogenous. These are also the classic conditions of a product in perfect competition; despite the name and the ideological baggage, this isn’t a good thing, as in this situation economic theory predicts that profit margins will be competed away down to the absolute minimum required to keep the participants from giving up.

The provision of Voice is also increasingly fragmented and diverse – there are more and more producers, and more and more different applications, networks, and hardware devices incorporate some form of telephony. For example, games consoles like the Xbox have a voice chat capability, and CRM systems like Salesforce.com can be integrated with click-to-call services.

As a result, there’s less and less value in the telephone call itself – the period between the ringing tone and the click, when the circuit is established and bearer traffic is flowing. This bit is now cheap or free, and although Skype hasn’t eaten the world as it seemed it might in 2005, this is largely because the industry has reacted by bundling – i.e. slashing prices. Of course, neither the disruptors nor the traditional telcos can base a business on a permanent price war – eventually, prices go to zero. We’ve seen the results of this; several VoIP carriers whose business was based on offering the same features as the PSTN, but cheaper, have already gone under.

The outlook of Telco 2.0 Executive Brainstorm delegates as far back as 2007 demonstrates the widespread acceptance of these trends in the industry, and the increasing proliferation of diverse means of delivery of voice as show in the following chart.

call%20mins%20mb%20dec%202009.jpg

… Voice is still the biggest game in Telcotown…

So why bother with voice? The short answer is that there are three communications products the public gladly pays for – voice, SMS, and IP access.

Telenor’s CPA, one of the most successful and longest-running mobile content plays, is proud of $100m in revenues. In comparison, the business voice market in Norway is NOK6.9bn – $1.22bn. Even in 10 years’ time, voice will comprise the bulk of Telco revenue streams. However grim the prospects, defending Voice is only optional in the sense that survival is optional.

Moreover the emergence of the first wave of internet voice players – Skype, Vonage, etc., and the subsequent fight back by Operators, demonstrates that there is still much scope for innovation in voice and messaging, and that the option of better voice and messaging is still open.

…although the rules are changing…

Specifically, the possible zone of value is now adjacent to the call – features like presence-and-availability, dynamic call routing, speech-to-text, collaboration, history, and integration with the field of CEBP (Communications-Enabled Business Processes). There may also be some scope for improving the bearer quality – HD voice is currently gaining buzz – although the challenge there is that the Internet Players can use better voice codecs as well (Skype already does).

…and the Enterprise market is where the smart money is

The crucial market for better voice & messaging is the enterprise, because that’s where the money is. Nowhere else does the economic value of bits exceed their quantity and cost so much.

For large enterprises, the answer will almost certainly come from custom developments. They are already extensive users of VoIP internally, and increasingly externally as well. They tend to have large customised IT and unified communications installations, and the money and infrastructure to either do their own development or hire software/systems integration firms to do it for them. The appropriate telco play is something like BT Global Services – the systems integration/managed services wing of BT.

But using the toolkit of Voice 2.0 is technically challenging. It’s been said that free software is usually only free if you value your time at zero; small and medium-sized businesses can never afford to do that.

Telenor’s ‘Mobile Enterprise Network’: Mobilt Bedriftsnett

Mobilt Bedriftsnett (MB) is Telenor’s response to this situation, aimed at Small and Medium Enterprises (SMEs). Its primary benefit is to improve business efficiency by extending the functions of an internal PBX and/or unified communications system to include all the companies’ mobile phones.

Telenor’s internal business modelling estimates the cost of CRM failures – missed appointments, rework of mistakes, complaints, lost sales – to a potential SME customer at between $500 and $2,000 a year. This is the economic ‘friction’ that the product is designed to address.

telefonkonferanse.jpg

The Core Product is based on Telenor APIs…

The product is based on a suite of APIs into Telenor infrastructure, one of which replicates a hosted IP-PBX, i.e. IP Centrex, solution. It’s aimed at SMEs, and in particular, at integrating with their existing PBX, unified communications, and CRM installations. There’s a browser-based end user interface, which lets nontechnical customers manage their services.

There is also considerable scope for further development, and MB also provides four other APIs, which provide a click-to-call capability, bulk or programmatic SMS, location information, and “Status Push”. This last one provides information on whether a user is currently in coverage, power level, bandwidth, etc, and will be extended to carry presence-and-availability information and integrate with groupware and CRM systems in Q1 2010.

…and integrated with PBX/UC Vendor Client Solutions

Extensive work has been carried out with PBX/UC vendors, notably Alcatel-Lucent and Microsoft, to ensure integration. For example, one of the current use cases for the click-to-call API permits a user to launch a conference call from within MS Outlook or a CRM application. The voice switch receives an event from the SOAP API, initiates a call to the user’s mobile device, then bridges in the target number.

The ‘two-sided’ Enterprise ‘App Store’

MB is also the gateway to a business-focused app store, which markets the work of third-party software developers using the MB API to their base of SME customers. This element qualifies it as a two-sided business model. Telenor is thereby facilitating trade that wouldn’t otherwise occur, by sharing revenue from its customers with upstream producers and also by bringing SMEs that might not otherwise attract any interest from the developer community into contact with it. Developers either pay per use or receive a 70% revenue share depending on the APIs in use.

Telenor are using the existing infrastructure created for CPA to pay out the revenue share and carry out the digital logistics, and targeting the developer community they’re already building under their iLabs project. So far, third-party applications include integration with Microsoft’s Office Communication Server line of products, integration with Alcatel-Lucent and some other proprietary IP-PBXs, and a mobile-based CRM solution, WebOfficeOne.

Route to Market: Enterprise ICT Specialists

In a twist on the two-sided business model, MB services are primarily marketed to systems integrators, independent software developers, and CRM and IP telephony vendors, who act as a channel to market for core Telenor products such as voice, messaging, presence & availability, and location. This differs quite sharply from their experience with CPA, whose business is dominated by content providers.

Pricing is based on a freemium model; some API usage is free, businesses that choose to use the CPA payments system pay through the revenue sharing mechanism, and ones that don’t but do use the APIs heavily pay by usage.

Technical Architecture: migrating to industry standards

Telco 2.0 has previously articulated the seven questions concept – seven key customer questions that can be answered using telecom’s operator’s data assets as shown in the following diagram.

seven_questions_dec_2009.jpg

Telenor’s API layer consists of Simple Object Access Protocol (SOAP) and Web service interfaces between the customer needs on the left of the diagram, and a bank of service gateways which communicate with various elements of in the core network on the right.

At the moment, the click-to-call and status push interfaces are implemented using the proprietary Computer-Support Telecoms Applications (CSTA) standard, in order to integrate more easily with the Alcatel-Lucent range of PBXs. So far, they don’t implement Parlay-X (or OneAPI as the GSMA calls it), but they intend to migrate to the standard in the future. Like Microsoft OCS, Asterisk, and much else, the industry standard IETF SIP is used for the core voice, messaging, and availability functions.

MB_systems_dec%202009.jpg.png

Early days, high hopes…

Telenor is unwilling to describe what it would consider to constitute success with Mobilt Bedriftsnett; however, they do say that they expect it to be a “great source of income”. MB has only been live since June 2009, and traffic to CPA inevitably dwarfs that to the MB APIs at present.

…and part of a bigger strategic plan

Mobilt Bedriftsnett makes up the Voice & Messaging 2.0 element of Telenor’s transformation towards Telco 2.0. The other components of ‘Telenor 2.0’ are:

  • CPA, the platform enabling 3rd party mobile content transactions
  • the iLabs/Playground developer community
  • increasing strategic interest in M2M applications
  • a recently launched Content Delivery Network (or CDN – a subject gaining salience again, after the recent Arbor Networks study that showed them accounting for 10-15% of global Internet traffic )
  • Mobile Payments, Money transfer and Banking at Grameenphone in Bangladesh.

Lessons from Telenor 2.0

With Mobilt Bedriftsnett, Telenor has carried on its tradition of pioneering Telco 2.0 style business model innovations, though it is relatively early to judge the success of the ‘Telenor 2.0′ strategy.

At this stage of market development, Telenor’s approach therefore shows three important lessons to other industry players.

1)     They are taking serious steps to create and try ‘two-sided’ telecoms business models.

2)     The repeated mentions of CPA’s role in MB point to an important truth about Telco 2.0 – the elements of it are mutually supporting. It becomes dramatically easier to create a developer community, bill for sender-pays data, operate an app store, etc, if you already have an effective payments and revenue-sharing solution. Similarly, an effective identification/authorisation capability underlies billing and payments. Telenor understands and is acting on this network principle.