
Telecoms 2030 Part 2: Understanding the forces of change
Part two of this three-part report series examines the influence and impact of external forces that will shape telcos’ journeys as they adapt to survive and compete in the future.

Part two of this three-part report series examines the influence and impact of external forces that will shape telcos’ journeys as they adapt to survive and compete in the future.

Based on its deep industry knowledge, STL Partners is sharing its vision on how telcos can reverse the trend of stagnating consumer revenues by focusing on innovation, new ventures and excellent customer experience.

Telcos and policymakers need new metrics to power evidence-based decisions. New tools and data sources can help build greater understanding and transparency in telecoms.

Operators are packaging together a variety of lifestyle services across finance, commerce, entertainment and a range of household services as a way to diversify and build revenue streams outside the traditional telco business. Will it stick?

Why did AT&T buy, and then sell, DirecTV and Time Warner after only six years? This report looks at AT&T’s decisions, actions and their consequences, and the lessons for others attempting adjacent market moves and M&A.

This is part 1 of a 3-part series taking an in-depth look at how 5G pioneers have evolved their approaches to commercialisation since launch, navigating a maze of factors such as handset availability, technology immaturity and more. What should others take from their experience to date?

Recently, Orange passed 22 million homes, Telefónica 20 million, and AT&T is now reaching five million more every year. The Chinese have over 300 million FTTH connections. What does FTTH do for ARPU, churn, OPEX and 5G that makes it so compelling?

Our latest adjacent market case study analyses Axel Springer’s successful 10 year digital transformation from print to online publisher, and holds many lessons for telcos, not least of which are the pitfalls of under commitment, and the required level of investment in M&A.
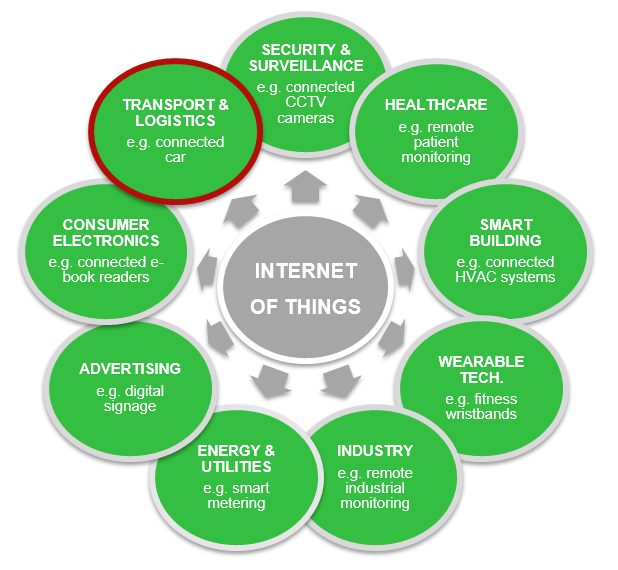
Connected cars are set to revolutionise the automotive industry as we know it, turning the car into the ‘ultimate mobile device’ and driving the growth of M2M in a big way. With Apple, Google, telcos and many others in the chase, we analyse the growth drivers, value chain, and key battles for control of this increasingly complex ecosystem, and outline a new connected car services framework.