Understanding the unconnected
£1,000.00 excl VAT
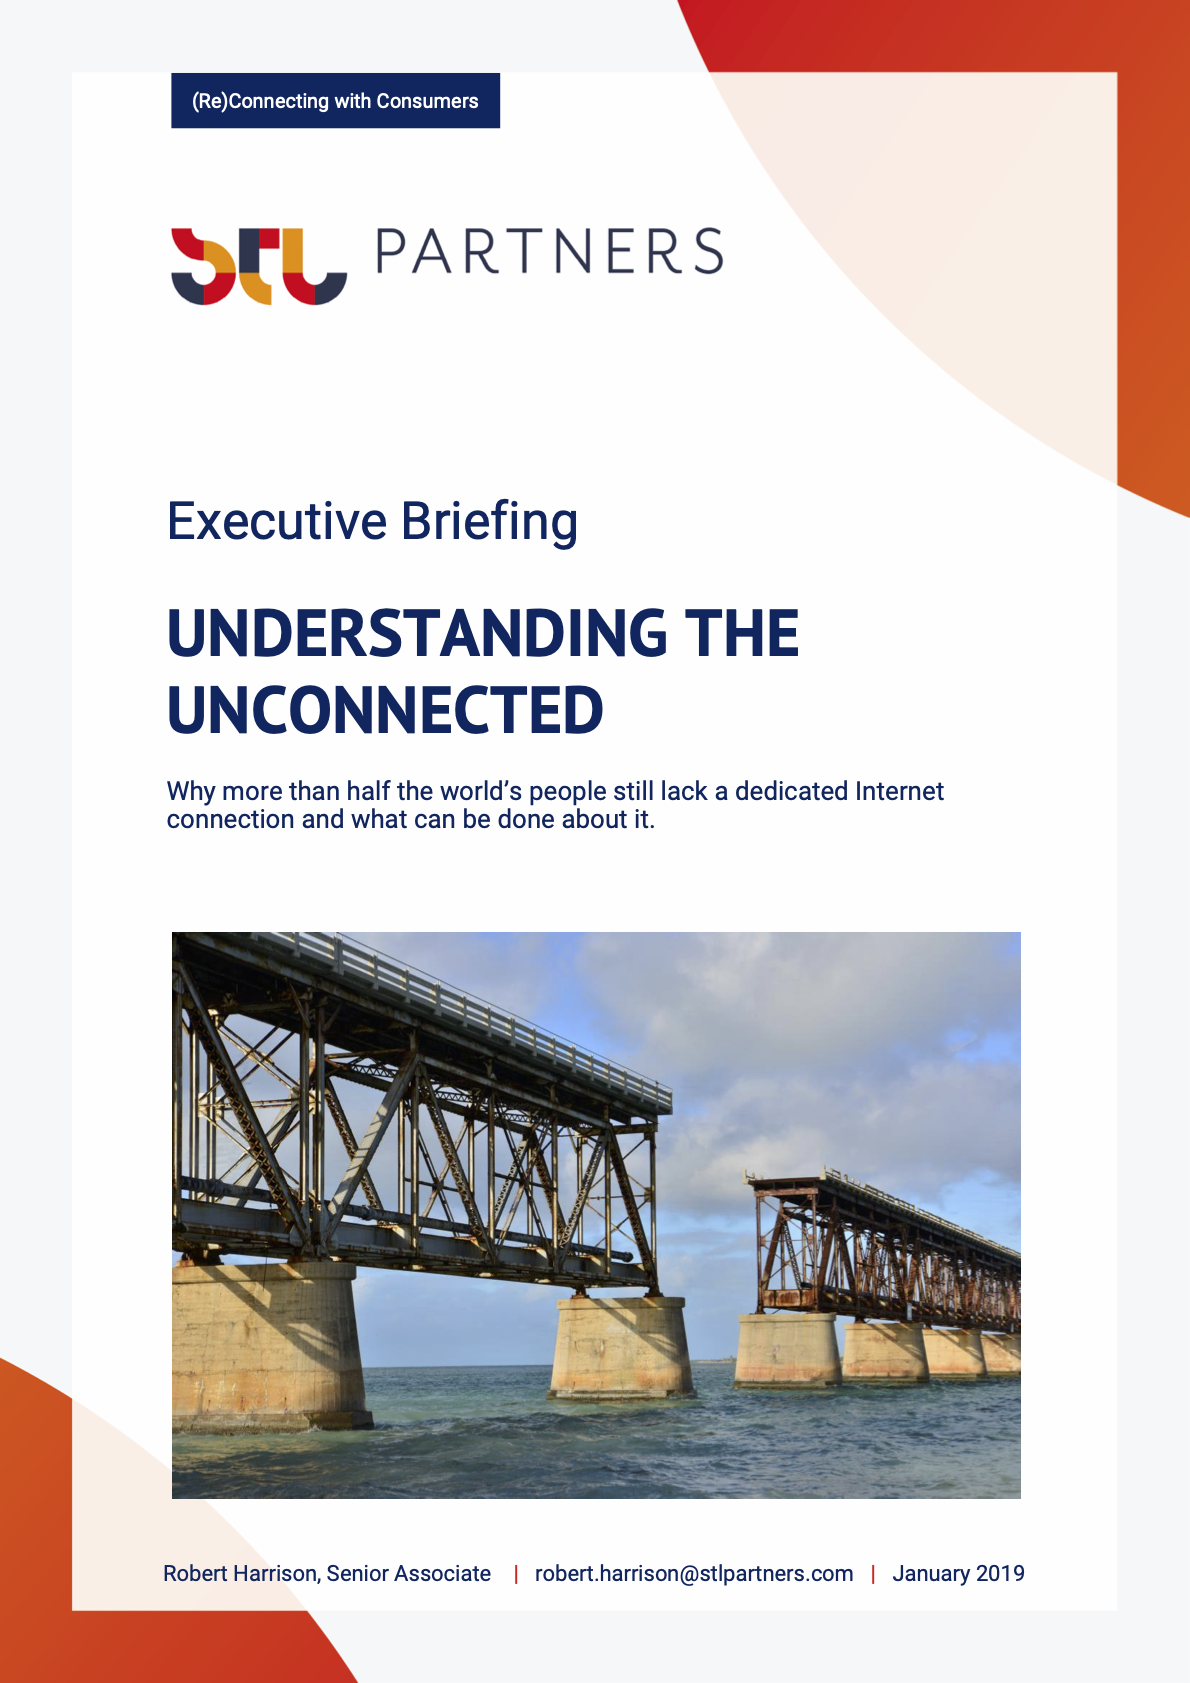
Despite the growing maturity of the communications industry, why do more than half the world’s people still lack a dedicated Internet connection? And what can be done about it, by whom?
Description
Format: PDF filePages: 52 pagesCharts: 40Author: Robert HarrisonPublication Date: August 2019
Table of contents
-
- Executive Summary
- Introduction
- Economic benefits of broadband
- The growth in Internet usage
- Counting the addressable unconnected
- The reasons why people aren’t online
- Social and economic drivers of Internet access
- Regional Internet usage patterns
- Structural, social and economic differences
- Reasons why people are not connected
- Why do people not use mobile broadband?
- Infrastructure; mobile broadband coverage and electricity
- Cost of smartphones and mobile data
- Local content and services
- Social and cultural factors and education
- Conclusions and areas for action
- The connected and the unconnected
- Infrastructure
- Connecting the covered
- Are governments prepared to act?
- Annex: Regional and country data
- Asia Pacific
- Eastern Europe
- Latin America
- Middle East and North Africa (MENA)
- North America
- Sub-Saharan Africa
- Western Europe
Table of Figures
Figures:
Figure 1: Less than half the world’s people have a dedicated Internet connection
Figure 2: About 2.8 billion people aged over 11 not using the Internet
Figure 3: The growth in the population covered by 3G/4G
Figure 4: Relative impact on GDP of different communications technologies
Figure 5: Total and mobile Internet users by world region
Figure 6: Mobile connected and unconnected population by region
Figure 7: Internet penetration of total population by world sub-region
Figure 8: HDI and its constituents
Figure 9: Global variations in human development
Figure 10: Average household sizes by country
Figure 11: Key factors influencing broadband take up
Figure 12: Global GSMA Mobile Connectivity Index
Figure 13: Mobile network coverage by major region
Figure 14: Fixed broadband penetration
Figure 15: Electricity – percentage access by region
Figure 16: Availability of electricity supply in Sub-Saharan Africa (% pop)
Figure 17: African countries with largest populations; those with no electricity
Figure 18: Smartphone and mobile penetration
Figure 19: Examples of cheapest smartphones
Figure 20: Affordability index for cheapest Internet-enabled handsets
Figure 21: Relative cost of mobile data plans (on a 100-point index) vs. penetration
Figure 22: Availability of local services on a 100-point index vs. Internet penetration
Figure 23: Literacy and Internet and social media use by sub-region
Figure 24: Female access to mobile phone and Internet
Figure 25: Proportion of women with access to the Internet in selected MENA states
Figure 26: Proportion of women with access to the Internet in Sub-Saharan Africa
Figure 27: Asia Pacific overview
Figure 28: Asia Pacific country data
Figure 29: Eastern Europe overview
Figure 30: Eastern Europe country data
Figure 31: Latin America overview
Figure 32: Latin America country data
Figure 33: MENA overview
Figure 34: MENA country data
Figure 35: North America overview
Figure 36: North America country data
Figure 37: Sub-Saharan Africa overview
Figure 38: Sub-Saharan Africa country data
Figure 39: Western Europe overview
Figure 40: Western Europe country data
Keywords: affordability index, electricity, literacy, local content, Middle East, Mobile Broadband, mobile coverage, mobile penetration, regional comparison, smartphone cost, sub-saharan africa, taxation

