5G: Bridging hype, reality and future promises

The 5G situation seems paradoxical

People in China and South Korea are buying 5G phones by the million, far more than initially expected, yet many western telcos are moving cautiously. Will your company also find demand? What’s the smart strategy while uncertainty remains? What actions are needed to lead in the 5G era? What questions must be answered?

New data requires new thinking. STL Partners 5G strategies: Lessons from the early movers presented the situation in late 2019, and in What will make or break 5G growth? we outlined the key drivers and inhibitors for 5G growth. This follow on report addresses what needs to happen next.

The report is informed by talks with executives of over three dozen companies and email contacts with many more, including 21 of the first 24 telcos who have deployed. This report covers considerations for the next three years (2020–2023) based on what we know today.

“Seize the 5G opportunity” says Ke Ruiwen, Chairman, China Telecom, and Chinese reports claimed 14 million sales by the end of 2019. Korea announced two million subscribers in July 2019 and by December 2019 approached five million. By early 2020, The Korean carriers were confident 30% of the market will be using 5G by the end of 2020. In the US, Verizon is selling 5G phones even in areas without 5G services,  With nine phone makers looking for market share, the price in China is US$285–$500 and falling, so the handset price barrier seems to be coming down fast.

Yet in many other markets, operators progress is significantly more tentative. So what is going on, and what should you do about it?

Enter your details below to request an extract of the report

5G technology works OK

22 of the first 24 operators to deploy are using mid-band radio frequencies.

Vodafone UK claims “5G will work at average speeds of 150–200 Mbps.” Speeds are typically 100 to 500 Mbps, rarely a gigabit. Latency is about 30 milliseconds, only about a third better than decent 4G. Mid-band reach is excellent. Sprint has demonstrated that simply upgrading existing base stations can provide substantial coverage.

5G has a draft business case now: people want to buy 5G phones. New use cases are mostly years away but the prospect of better mobile broadband is winning customers. The costs of radios, backhaul, and core are falling as five system vendors – Ericsson, Huawei, Nokia, Samsung, and ZTE – fight for market share. They’ve shipped over 600,000 radios. Many newcomers are gaining traction, for example Altiostar won a large contract from Rakuten and Mavenir is in trials with DT.

The high cost of 5G networks is an outdated myth. DT, Orange, Verizon, and AT&T are building 5G while cutting or keeping capex flat. Sprint’s results suggest a smart build can quickly reach half the country without a large increase in capital spending. Instead, the issue for operators is that it requires new spending with uncertain returns.

The technology works, mostly. Mid-band is performing as expected, with typical speeds of 100–500Mbps outdoors, though indoor performance is less clear yet. mmWave indoor is badly degraded. Some SDN, NFV, and other tools for automation have reached the field. However, 5G upstream is in limited use. Many carriers are combining 5G downstream with 4G upstream for now. However, each base station currently requires much more power than 4G bases, which leads to high opex. Dynamic spectrum sharing, which allows 5G to share unneeded 4G spectrum, is still in test. Many features of SDN and NFV are not yet ready.

So what should companies do? The next sections review go-to-market lessons, status on forward-looking applications, and technical considerations.

Early go-to-market lessons

Don’t oversell 5G

The continuing publicity for 5G is proving powerful, but variable. Because some customers are already convinced they want 5G, marketing and advertising do not always need to emphasise the value of 5G. For those customers, make clear why your company’s offering is the best compared to rivals’. However, the draw of 5G is not universal. Many remain sceptical, especially if their past experience with 4G has been lacklustre. They – and also a minority swayed by alarmist anti-5G rhetoric – will need far more nuanced and persuasive marketing.

Operators should be wary of overclaiming. 5G speed, although impressive, currently has few practical applications that don’t already work well over decent 4G. Fixed home broadband is a possible exception here. As the objective advantages of 5G in the near future are likely to be limited, operators should not hype features that are unrealistic today, no matter how glamorous. If you don’t have concrete selling propositions, do image advertising or use happy customer testimonials.

Table of Contents

  • Executive Summary
  • Introduction
    • 5G technology works OK
  • Early go-to-market lessons
    • Don’t oversell 5G
    • Price to match the experience
    • Deliver a valuable product
    • Concerns about new competition
    • Prepare for possible demand increases
    • The interdependencies of edge and 5G
  • Potential new applications
    • Large now and likely to grow in the 5G era
    • Near-term applications with possible major impact for 5G
    • Mid- and long-term 5G demand drivers
  • Technology choices, in summary
    • Backhaul and transport networks
    • When will 5G SA cores be needed (or available)?
    • 5G security? Nothing is perfect
    • Telco cloud: NFV, SDN, cloud native cores, and beyond
    • AI and automation in 5G
    • Power and heat

Enter your details below to request an extract of the report

The European Telecoms market in 2020, Report 2: 4 scenarios and 7 predictions

Introduction

The second report in The European Telecoms market in 2020, this document uses the framework introduced in Report 1 to develop four discrete scenarios for the European telecoms market in 2020.  Although this report can be read on its own, STL Partners suggests that more value will be derived from reading Report 1 first.

The role of this report

Strategists (and investors) are finding it very difficult to understand the many and varied forces affecting the telecoms industry (Report 1), and predict the structure of, and returns from, the European telecoms market in 2020 (the focus of this Report 2).  This, in turn, makes it challenging to determine how operators should seek to compete in the future (the focus of a STL Partners report in July, Four strategic pathways to Telco 2.0).

In summary, The European Telecoms market in 2020 reports therefore seek to:

  • Identify the key forces of change in Europe and provide a useful means of classifying them within a simple and logical 2×2 framework (Report 1);
  • Help readers refine their thoughts on how Europe might develop by outlining four alternative ‘futures’ that are both sufficiently different from each other to be meaningful and internally consistent enough to be realistic (Report 2);
  • Provide a ‘prediction’ for the future European telecoms market based on our own insights plus two ‘wisdom of crowds’ votes conducted at a recent STL Partners event for senior managers from European telcos (Report 2).

Four European telecoms market scenarios for 2020

The second report in The European Telecoms market in 2020, this document uses the framework introduced in Report 1 to develop four discrete scenarios for the European telecoms market in 2020.  Although this report can be read on its own, STL Partners suggests that more value will be derived from reading Report 1 first.

Overview

STL Partners has identified the following scenarios for the European market in 2020:

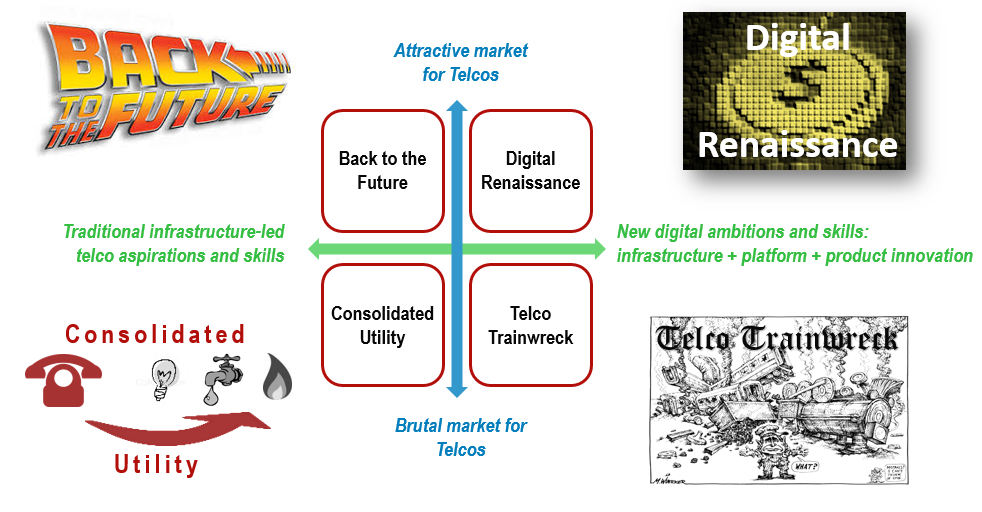
  1. Back to the Future. This scenario is likely to be the result of a structurally attractive telecoms market and one where operators focus on infrastructure-led ‘piping’ ambition and skills.
  2. Consolidated Utility. This might be the result of the same ‘piping’ ambition in a structurally unattractive market.
  3. Digital Renaissance. A utopian world resulting from new digital ambitions and skills developed by operators coupled with an attractive market.
  4. Telco Trainwreck. As the name suggests, a disaster stemming from lofty digital ambitions being pursued in the face of an unattractive telco market.

The four scenarios are shown on the framework in Figure 1 and are discussed in detail below.

Figure 1: Four European telecoms market scenarios for 2020

Source: STL Partners/Telco 2.0

How each scenario is described

In addition to a short overview, each scenario will be examined by exploring 8 key characteristics which seek to reflect the combined impact of the internal and external forces laid out in the previous section:

  1. Market Structure. The absolute and relative size and overall number of operators in national markets and across the wider EU region.
  2. Operator service pricing and profits. The price levels and profit performance of telecoms operators (and the overall industry) and the underlying direction (stable, moving up, moving down).
  3. The role of content in operators’ service portfolios. The importance of IPTV, games and applications within operators’ consumer offering and the importance of content, software and applications within operators’ enterprise portfolio.
  4. The degree to which operators can offer differentiated services. How able operators are to offer differentiated network services to end users and, most importantly, upstream service providers based on such things as network QoS, guaranteed maximum latency, speed, etc.
  5. The relationships between operators and NEP/IT players. Whether NEP and IT players continue to predominantly sell their services to and through operators (to other enterprises) or whether they become ‘Under the Floor’ competitors offering network services directly to enterprises.
  6. Where service innovation occurs – in the network/via the operator vs at the edge/via OTT players. The extent to which services continue to be created ‘at the edge’ – with little input from the network – or are ‘network-reliant’ or, even, integrated directly into the network. The former clearly suggests continued dominance by OTT players and the latter a swing towards operators and the telecoms industry.
  7. The attitude of the capital markets (and the availability of capital). The willingness of investors to have their capital reinvested for growth by telecoms operators as opposed to returned to them in the form of dividends. Prospects of sustained growth from operators will lead to the former whereas profit stasis or contraction will result in higher yields.
  8. Key industry statistics. Comparison between 2020 and 2015 for revenue and employees – tangible numbers that demonstrate how the industry has changed.

The European macro-economy – a key assumption

The health and structure of all industries in Europe is dependent, to a large degree, on the European macro-economy. Grexit or Brexit, for example, would have a material impact on growth throughout Europe over the next five years.  Our assumption in these scenarios is that Europe experiences a stable period of low-growth and that the economic positions of the stretched Southern European markets, particularly Italy and Spain, improves steadily.  If the European economic position deteriorates then opportunities for telecoms growth of any sort is likely to disappear.


  • Executive Summary
  • Introduction
  • The role of this report
  • Four European telecoms market scenarios for 2020
  • Overview
  • How each scenario is described
  • The European macro-economy – a key assumption
  • Back to the Future
  • Consolidated Utility
  • Digital Renaissance
  • Telco Trainwreck
  • Risk and returns in the scenarios
  • Making predictions
  • Wisdom of crowds: 2 approaches
  • Approach 1: Aggregating individual forces – ‘Sum-of-the-parts’
  • Approach 2: Picking a scenario
  • STL Partners’ prediction for the European telecoms market in 2020
  • STL Partners and Telco 2.0: Change the Game


  • Figure 1: Four European telecoms market scenarios for 2020
  • Figure 2: Back to the Future – key characteristics
  • Figure 3: Consolidated Utility – key characteristics
  • Figure 4: Digital Renaissance – key characteristics
  • Figure 5: Telco Trainwreck – key characteristics
  • Figure 6: Risk and returns in the four scenarios
  • Figure 7: Europe’s future based on aggregating individual forces – ‘Sum-of-the-parts’
  • Figure 8: Europe’s future – results of the two approaches compared

Disruptive Strategy: ‘Uncarrier’ T-Mobile vs. AT&T, VZW, and Free.fr

Introduction

Ever since the original Softbank bid for Sprint-Nextel, the industry has been awaiting a wave of price disruption in the United States, the world’s biggest and richest mobile market, and one which is still very much dominated by the dynamic duo, Verizon Wireless and AT&T Mobility.

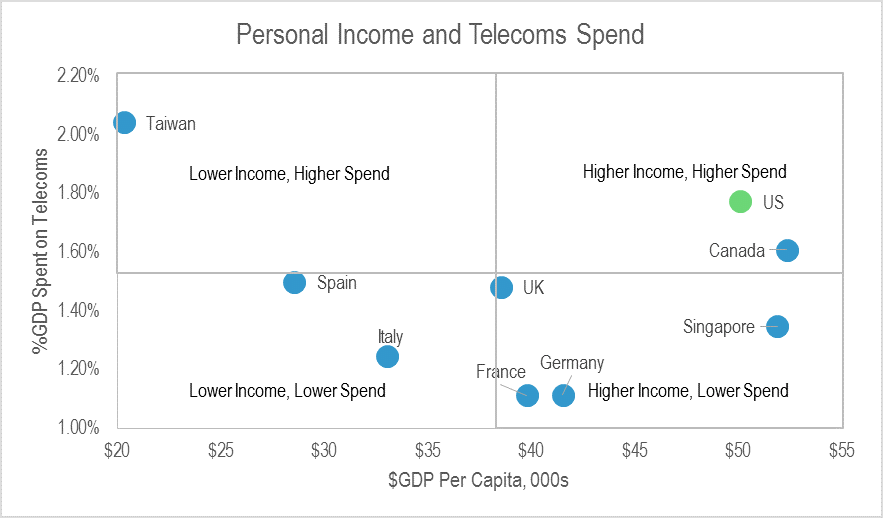
Figure 1: The US, a rich and high-spending market

The US a rich and high-spending market

Source: Onavo, Ofcom, CMT, BNETZA, TIA, KCC, Telco accounts, STL Partners

However, the Sprint-Softbank deal saga delayed any aggressive move by Sprint for some time, and in the meantime T-Mobile USA stole a march, implemented its own very similar ‘uncarrier’ proposition strategy, and achieved a dramatic turnaround of their customer numbers.

As Figure 2 shows, the duopoly marches on, with Verizon in the lead, although the gap with AT&T has closed a little lately. Sprint, meanwhile, looks moribund, while T-Mobile has closed half the gap with the duopolists in an astonishingly short period of time.

Figure 2: The duopolists hold a lead, but a new challenger arises…

The duopolists hold a lead but a new challenger arises
Source: STL Partners

Now, a Sprint-T-Mobile merger is seriously on the cards. Again, Softbank CEO Masayoshi Son is on record as promising to launch a price war. But to what extent is a Free Mobile-like disruption event already happening? And what strategies are carriers adopting?

For more STL analysis of the US cellular market, read the original Sprint-Softbank EB , the Telco 2.0 Transformation Index sections on Verizon  and AT&T , and our Self-Disruption: How Sprint Blew It EB . Additional coverage of the fixed domain can be found in the Triple-Play in the USA: Infrastructure Pays Off EB  and the Telco 2.0 Index sections mentioned above

The US Market is Changing

In our previous analysis Self-Disruption: How Sprint Blew It, we used the following chart, Figure 3, under the title “…And ARPU is Holding Up”. Updating it with the latest data, it becomes clear that ARPU – and in this case pricing – is no longer holding up so well. Rather than across-the-board deflation, though, we are instead seeing increasingly diverse strategies.

Figure 3: US carriers are pursuing diverse pricing strategies, faced with change

US carriers are pursuing diverse pricing strategies, faced with change

Source: STL Partners

AT&T’s ARPU is being very gradually eroded (it’s come down by $5 since Q1 2011), while Sprint’s plunged sharply with the shutdown of Nextel (see report referenced above for more detail). Since then, AT&T and Sprint have been close to parity, a situation AT&T management surely can’t be satisfied with. T-Mobile USA has slashed prices so much that the “uncarrier” has given up $10 of monthly ARPU since the beginning of 2012. And Verizon Wireless has added almost as much monthly ARPU in the same timeframe.

Each carrier has adopted a different approach in this period:

  • T-Mobile has gone hell-for-leather after net adds at any price.
  • AT&T has tried to compete with T-Mobile’s price slashing by offering more hardware and bigger bundles and matching T-Mobile’s eye-catching initiatives, while trying to hold the line on headline pricing, perhaps hoping to limit the damage and wait for Deutsche Telekom to tire of the spending. For example, AT&T recently increased its device activation fee by $4, citing the increased number of smartphone activations under its early-upgrade plan. This does not appear in service-ARPU or in headline pricing, but it most certainly does contribute to revenue, and even more so, to margin.
  • Verizon Wireless has declined to get involved in the price war, and has concentrated on maintaining its status as a premium brand, selling on coverage, speed, and capacity. As the above chart shows, this effort to achieve network differentiation has met with a considerable degree of success.
  • Sprint, meanwhile, is responding tactically with initiatives like its “Framily” tariff, while sorting out the network, but is mostly just suffering. The sharp drop in mid-2012 is a signature of high-value SMB customers fleeing the shutdown of Nextel, as discussed in Self-Disruption: How Sprint Blew It.

Figure 4: Something went wrong at Sprint in mid-2012

Something went wrong at Sprint in mid-2012

Source: STL Partners, Sprint filings


  • Executive Summary
  • Contents
  • Introduction
  • The US Market is Changing
  • Where are the Customers Coming From?
  • Free Mobile: A Warning from History?
  • T-Mobile, the Expensive Disruptor
  • Handset subsidy: it’s not going anywhere
  • Summarising change in the US and French cellular markets
  • Conclusions


  • Figure 1: The US, a rich and high-spending market
  • Figure 2: The duopolists hold a lead, but a new challenger arises…
  • Figure 3: US carriers are pursuing diverse pricing strategies, faced with change
  • Figure 4: Something went wrong at Sprint in mid-2012
  • Figure 5: US subscriber net-adds by source
  • Figure 6: The impact of disruption – prices fall across the board
  • Figure 7: Free’s spectacular growth in subscribers – but who was losing out?
  • Figure 8: The main force of Free Mobile’s disruption didn’t fall on the carriers
  • Figure 9: Disruption in France primarily manifested itself in subscriber growth, falling ARPU, and the death of the MVNOs
  • Figure 10: T-Mobile has so far extended $3bn of credit to its smartphone customers
  • Figure 11: T-Mobile’s losses on device sales are large and increasing, driven by smartphone volumes
  • Figure 12: Size and profitability still go together in US mobile – although this conceals a lot of change below the surface
  • Figure 13: Fully-developed disruption, in France
  • Figure 14: Quality beats quantity. Sprint repeatedly outspent VZW on its network

Europe’s brutal future: Vodafone and Telefonica hit hard

Introduction


Even in the UK and Germany, the markets with the brightest future, STL Partners forecasts a respective 19% and 20% decline in mobile core services (voice, messaging and data) revenues by 2020. The UK has less far to fall simply because the market has already contracted over the last 2-3 years whereas the German market has continued to grow.

We forecast a decline of 34% in France over the same period.

In Italy and, in particular, Spain we forecast a brutal decline of 47% and 61% respectively. Overall, STL Partners anticipates a reduction of 36% or €30 billion in core mobile service revenues by 2020. This equates to around €50 billion for Europe as a whole.


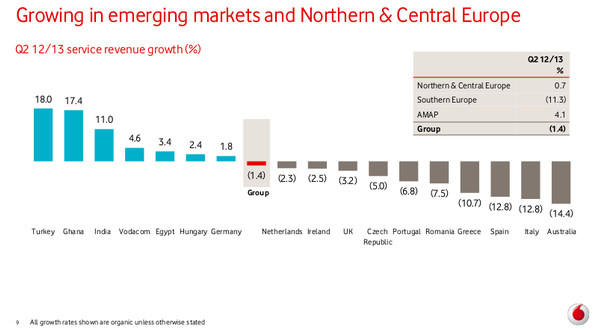
Like the medical profession, we don’t always like being correct when our diagnoses are pessimistic. So it is with some regret that we note that our forecasts are being borne out by the latest reports from southern Europe. Vodafone has been forced into a loss for H1 2012, after it wrote down the value of its Spanish and Italian OpCos by £5.9bn. Here’s why:

eurobloodbath.png

The writedown is of course non-cash, and those of us who remember Chris Gent’s Vodafone will be familiar with the sensation. But the reasons for it could not be more real. Service revenue has fallen sickeningly, down 7.9% across Europe, 1.4% across the group.

Vodafone has enjoyed a decent performance from the company’s assets in Africa, Asia, Turkey, and the Pacific, and a hefty dividend from Verizon Wireless. It is the performance in Europe which is dreadful and the situation in southern Europe especially bad.

For while service revenue in Gernany was up 1.8%, it was down a staggering 12.8% in both Spain and Italy. And margins were sacrificed for volume; EBITDA was down 16.6% in Italy, and 13.8% in “Other Southern Europe”, that is to say mostly Greece and Portugal. Even the UK saw service revenues fall -2.1%, while the Netherlands was down -1.9%. Vodafone’s investments across Europe seem to have landed in an arc of austerity running from the Norwegian Sea to the Aegean, the long way around.

Vodafone’s enterprise line of business has helped the Italian division defy gravity for a while. Until recently, OneNet was racking up the same 6% growth rates in Italy that it saw in Germany and contributing substantially to service revenue, even though the wider business was shrinking. In Q2, service revenue in Italy was down 4.1% but enterprise was up 5.8%.

But strategy inevitably beats tactics. Tellingly, the half-year statement from Vodafone management went a little coy about enterprise’s performance. Numbers are only given for Germany and Turkey, and for group-wide One Net seats. They are good, but you wonder about the numbers that aren’t given. We are told that One Net is “performing well” in Italy, but that’s not a number.

Meanwhile, Telefonica saw its European revenues fall 6.4% year-on-year. The problem is in Spain, where the plummet was 12.9%. Mobile was worse still, with revenues thumped downwards by 16.2%.

The damage, for both carriers, is concentrated in mobility, in southern Europe, and in voice and messaging. Telefonica blames termination rate cuts (as does Vodafone – both carriers are big enough that they tend to terminate more calls from other carriers than they pay out on), but this isn’t really going to wash. As Vodafone’s own statement makes clear, MTRs are coming down everywhere. And Telefonica’s wireline revenues were horrible, too, down 9.6%.

But the biggest hit to revenue for Vodafone was in messaging, and then in voice. Data revenue is growing. In the half to 30th September 2011, Vodafone.es subscribers generated £156 million in messaging revenues. In the corresponding half this year, it was £99 million. Part of this is accounted for by movement in the euro-sterling exchange rate, so Vodafone reports it as a 30% hit to messaging and a 20% hit to voice. Italy saw an 11.4% hit to messaging and a 16% hit to voice. The upshot to Vodafone is a 29.7% cut to the division’s operating profits. Brutal indeed.

Obviously, a lot of this is being driven by the European economic crisis. It is more than telling that Vodafone’s German and Turkish operations are powering ahead, while it’s not just the Mediterranean economies under the European Union’s “troika” management (EC, ECB and IMF) that are suffering. The UK, under its own voluntary austerity plan, was down 2.1% for Telefonica, and the Netherlands, having gone from being the keenest pupil in the class to another austerity case in the space of one unexpectedly bad budget, is off 1.9%. Even if you file Turkey under “emerging market”, the comparison between the Mediterranean disaster area, the OK-ish position in North-Western Europe, and the impressive (£2.4bn) dividend from Verizon Wireless in the States is compelling.

But disruption is a fact. We should not expect that things will snap back as soon as the macro-economy takes a turn for the better. One of the reasons for our grim prediction was that as well as weak economies, the Southern European markets exhibited surprisingly high prices for mobile service.

The impact of the crisis is likely to permanently reset customer behaviour, technology adoption, and price expectations. The Southern price premium is likely to be permanently eroded, whether by price war or by regulatory action. Customers are observably changing their behaviour in order to counter-optimise the carriers’ tariff plans.

Vodafone observes plummeting messaging revenues, poor voice revenues, and heavy customer retention spending, specifically on handset subsidies for smartphones. In fact, Vodafone admits that it has tried to phase out subsidy in Spain and been forced to turn back. This suggests that customers are becoming very much more aware of the high margin on SMS, are rationing it, and are deliberately pressing for any kind of smartphone in order to make use of alternatives to SMS. Once they are hooked on WhatsApp, they are unlikely to go back to carrier messaging if the economy looks up.

Another customer optimisation Vodafone encounters is that the customers love their integrated fixed/mobile plan. Unfortunately, this may mean they are shifting data traffic off the cellular network in the home-zone and onto WLAN. Further, as Vodafone is a DSL unbundler, the margin consequences of moving revenue this way may not be so great. In Italy, although the integrated tariffs sold well, a “fall in the non-ULL customer base” is blamed for a 5.6% drop in fixed service revenue. Are the customers fleeing the reseller lines because Vodafone can’t match TI or Fastweb’s pricing, or is it that the regulatory position means margins on unbundled lines are worse?

Vodafone’s response to all this is its RED tariff plan. This essentially represents a Telco 2.0 Happy Pipe strategy, providing unlimited voice and messaging in order to slow down the adoption of alternative communications, and setting data bundles at levels intended to be above the expected monthly usage, so the subscribers feel able to use them, but not far enough above it that the bandwidth-hog psychology takes hold.

vf-red.png

With regard to devices, RED offers three options with tiered pricing: SIM only, basic smartphone, and iPhone. The idea is to make the subsidy costs more evident to the customer, to slow up the replacement cycle on flagship smartphones via SIM-only, and to channel the smartphone hunters into the cheaper devices. Overall, the point is to drive data and smartphone adoption down the diffusion curve, so as to help the transition from a metered voice-centric to a data-centric business model.

The CEO, Vittorio Colao, says as much:

The reason why the whole industry is on a difficult trend…is because we historically voice priced really high and data priced really low.

Vodafone’s competitors face a serious challenge. They are typically still very dependent on prepaid voice minutes, a market which is suffering. Even in Northern Europe, it’s off 10%. Telcos loved PAYG because everything in it is incremental. Now, the challenge is how to create a RED-like tariff for the PAYG market.

Euro Voice Brutal Image 2 Chart Euro 5 Oct 2012.png

Those in North and South America, MENA and Asia-Pacific may be looking at Europe and breathing a sigh of relief. But don’t fool yourself. SMS revenues in the US are down for the first time driven by volume and price declines. One rather worrying outcome of last week’s Digital Arabia event was that operators in the region seem to be under the impression that the decline for them is still several years out and destined to be a relatively gentle softening of the market. There’s more here on our initial take on what they need to do to avoid complacency and start to build new business models more quickly.

Mobile Broadband 2.0: The Top Disruptive Innovations

Summary: Key trends, tactics, and technologies for mobile broadband networks and services that will influence mid-term revenue opportunities, cost structures and competitive threats. Includes consideration of LTE, network sharing, WiFi, next-gen IP (EPC), small cells, CDNs, policy control, business model enablers and more.(March 2012, Executive Briefing Service, Future of the Networks Stream).

Trends in European data usage

  Read in Full (Members only)  Buy a single user license online  To Subscribe click here

Below is an extract from this 44 page Telco 2.0 Report that can be downloaded in full in PDF format by members of the Telco 2.0 Executive Briefing service and Future Networks Stream here. Non-members can subscribe here, buy a Single User license for this report online here for £795 (+VAT for UK buyers), or for multi-user licenses or other enquiries, please email contact@telco2.net / call +44 (0) 207 247 5003. We’ll also be discussing our findings and more on Facebook at the Silicon Valley (27-28 March) and London (12-13 June) New Digital Economics Brainstorms.

To share this article easily, please click:


Introduction

Telco 2.0 has previously published a wide variety of documents and blog posts on mobile broadband topics – content delivery networks (CDNs), mobile CDNs, WiFi offloading, Public WiFi, network outsourcing (“‘Under-The-Floor’ (UTF) Players: threat or opportunity? ”) and so forth. Our conferences have featured speakers and panellists discussing operator data-plan pricing strategies, tablets, network policy and numerous other angles. We’ve also featured guest material such as Arete Research’s report LTE: Late, Tempting, and Elusive.

In our recent ‘Under the Floor (UTF) Players‘ Briefing we looked at strategies to deal with some of of the challenges facing operators’ resulting from market structure and outsourcing

Under The Floor (UTF) Players Telco 2.0

This Executive Briefing is intended to complement and extend those efforts, looking specifically at those technical and business trends which are truly “disruptive”, either immediately or in the medium-term future. In essence, the document can be thought of as a checklist for strategists – pointing out key technologies or trends around mobile broadband networks and services that will influence mid-term revenue opportunities and threats. Some of those checklist items are relatively well-known, others more obscure but nonetheless important. What this document doesn’t cover is more straightforward concepts around pricing, customer service, segmentation and so forth – all important to get right, but rarely disruptive in nature.

During 2012, Telco 2.0 will be rolling out a new MBB workshop concept, which will audit operators’ existing technology strategy and planning around mobile data services and infrastructure. This briefing document is a roundup of some of the critical issues we will be advising on, as well as our top-level thinking on the importance of each trend.

It starts by discussing some of the issues which determine the extent of any disruption:

  • Growth in mobile data usage – and whether the much-vaunted “tsunami” of traffic may be slowing down
  • The role of standardisation , and whether it is a facilitator or inhibitor of disruption
  • Whether the most important MBB disruptions are likely to be telco-driven, or will stem from other actors such as device suppliers, IT companies or Internet firms.

The report then drills into a few particular domains where technology is evolving, looking at some of the most interesting and far-reaching trends and innovations. These are split broadly between:

  • Network infrastructure evolution (radio and core)
  • Control and policy functions, and business-model enablers

It is not feasible for us to cover all these areas in huge depth in a briefing paper such as this. Some areas such as CDNs and LTE have already been subject to other Telco 2.0 analysis, and this will be linked to where appropriate. Instead, we have drilled down into certain aspects we feel are especially interesting, particularly where these are outside the mainstream of industry awareness and thinking – and tried to map technical evolution paths onto potential business model opportunities and threats.

This report cannot be truly exhaustive – it doesn’t look at the nitty-gritty of silicon components, or antenna design, for example. It also treads a fine line between technological accuracy and ease-of-understanding for the knowledgeable but business-focused reader. For more detail or clarification on any area, please get in touch with us – email mailto:contact@stlpartners.com or call +44 (0) 207 247 5003.

Telco-driven disruption vs. external trends

There are various potential sources of disruption for the mobile broadband marketplace:

  • New technologies and business models implemented by telcos, which increase revenues, decrease costs, improve performance or alter the competitive dynamics between service providers.
  • 3rd party developments that can either bolster or undermine the operators’ broadband strategies. This includes both direct MBB innovations (new uses of WiFi, for example), or bleed-over from adjacent related marketplaces such as device creation or content/application provision.
  • External, non-technology effects such as changing regulation, economic backdrop or consumer behaviour.

The majority of this report covers “official” telco-centric innovations – LTE networks, new forms of policy control and so on,

External disruptions to monitor

But the most dangerous form of innovation is that from third parties, which can undermine assumptions about the ways mobile broadband can be used, introducing new mechanisms for arbitrage, or somehow subvert operators’ pricing plans or network controls. 

In the voice communications world, there are often regulations in place to protect service providers – such as banning the use of “SIM boxes” to terminate calls and reduce interconnection payments. But in the data environment, it is far less obvious that many work-arounds can either be seen as illegal, or even outside the scope of fair-usage conditions. That said, we have already seen some attempts by telcos to manage these effects – such as charging extra for “tethering” on smartphones.

It is not really possible to predict all possible disruptions of this type – such is the nature of innovation. But by describing a few examples, market participants can gauge their level of awareness, as well as gain motivation for ongoing “scanning” of new developments.

Some of the areas being followed by Telco 2.0 include:

  • Connection-sharing. This is where users might link devices together locally, perhaps through WiFi or Bluetooth, and share multiple cellular data connections. This is essentially “multi-tethering” – for example, 3 smartphones discovering each other nearby, perhaps each with a different 3G/4G provider, and pooling their connections together for shared use. From the user’s point of view it could improve effective coverage and maximum/average throughput speed. But from the operators’ view it would break the link between user identity and subscription, and essentially offload traffic from poor-quality networks on to better ones.
  • SoftSIM or SIM-free wireless. Over the last five years, various attempts have been made to decouple mobile data connections from SIM-based authentication. In some ways this is not new – WiFi doesn’t need a SIM, while it’s optional for WiMAX, and CDMA devices have typically been “hard-coded” to just register on a specific operator network. But the GSM/UMTS/LTE world has always relied on subscriber identification through a physical card. At one level, it s very good – SIMs are distributed easily and have enabled a successful prepay ecosystem to evolve. They provide operator control points and the ability to host secure applications on the card itself. However, the need to obtain a physical card restricts business models, especially for transient/temporary use such as a “one day pass”. But the most dangerous potential change is a move to a “soft” SIM, embedded in the device software stack. Companies such as Apple have long dreamed of acting as a virtual network provider, brokering between user and multiple networks. There is even a patent for encouraging bidding per-call (or perhaps per data-connection) with telcos competing head to head on price/quality grounds. Telco 2.0 views this type of least-cost routing as a major potential risk for operators, especially for mobile data – although it also possible enables some new business models that have been difficult to achieve in the past.
  • Encryption. Various of the new business models and technology deployment intentions of operators, vendors and standards bodies are predicated on analysing data flows. Deep packet inspection (DPI) is expected to be used to identify applications or traffic types, enabling differential treatment in the network, or different charging models to be employed. Yet this is rendered largely useless (or at least severely limited) when various types of encryption are used. Various content and application types already secure data in this way – content DRM, BlackBerry traffic, corporate VPN connections and so on. But increasingly, we will see major Internet companies such as Apple, Google, Facebook and Microsoft using such techniques both for their own users’ security, but also because it hides precise indicators of usage from the network operators. If a future Android phone sends all its mobile data back via a VPN tunnel and breaks it out in Mountain View, California, operators will be unable to discern YouTube video from search of VoIP traffic. This is one of the reasons why application-based charging models – one- or two-sided – are difficult to implement.
  • Application evolution speed. One of the largest challenges for operators is the pace of change of mobile applications. The growing penetration of smartphones, appstores and ease of “viral” adoption of new services causes a fundamental problem – applications emerge and evolve on a month-by-month or even week-by-week basis. This is faster than any realistic internal telco processes for developing new pricing plans, or changing network policies. Worse, the nature of “applications” is itself changing, with the advent of HTML5 web-apps, and the ability to “mash up” multiple functions in one app “wrapper”. Is a YouTube video shared and embedded in a Facebook page a “video service”, or “social networking”?

It is also really important to recognise that certain procedures and technologies used in policy and traffic management will likely have some unanticipated side-effects. Users, devices and applications are likely to respond to controls that limit their actions, while other developments may result in “emergent behaviours” spontaneously. For instance, there is a risk that too-strict data caps might change usage models for smartphones and make users just connect to the network when absolutely necessary. This is likely to be at the same times and places when other users also feel it necessary, with the unfortunate implication that peaks of usage get “spikier” rather than being ironed-out.

There is no easy answer to addressing these type of external threats. Operator strategists and planners simply need to keep watch on emerging trends, and perhaps stress-test their assumptions and forecasts with market observers who keep tabs on such developments.

The mobile data explosion… or maybe not?

It is an undisputed fact that mobile data is growing exponentially around the world. Or is it?

A J-curve or an S-curve?

Telco 2.0 certainly thinks that growth in data usage is occurring, but is starting to see signs that the smooth curves that drive so many other decisions might not be so smooth – or so steep – after all. If this proves to be the case, it could be far more disruptive to operators and vendors than any of the individual technologies discussed later in the report. If operator strategists are not at least scenario-planning for lower data growth rates, they may find themselves in a very uncomfortable position in a year’s time.

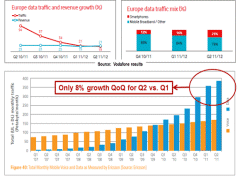
In its most recent study of mobile operators’ traffic patterns, Ericsson concluded that Q2 2011 data growth was just 8% globally, quarter-on-quarter, a far cry from the 20%+ growths seen previously, and leaving a chart that looks distinctly like the beginning of an S-curve rather than a continued “hockey stick”. Given that the 8% includes a sizeable contribution from undoubted high-growth developing markets like China, it suggests that other markets are maturing quickly. (We are rather sceptical of Ericsson’s suggestion of seasonality in the data). Other data points come from O2 in the UK , which appears to have had essentially zero traffic growth for the past few quarters, or Vodafone which now cites European data traffic to be growing more slowly (19% year-on-year) than its data revenues (21%). Our view is that current global growth is c.60-70%, c.40% in mature markets and 100%+ in developing markets.

Figure 1 – Trends in European data usage

 Trends in European Data Usage
 

Now it is possible that various one-off factors are at play here – the shift from unlimited to tiered pricing plans, the stronger enforcement of “fair-use” plans and the removal of particularly egregious heavy users. Certainly, other operators are still reporting strong growth in traffic levels. We may see resumption in growth, for example if cellular-connected tablets start to be used widely for streaming video. 

But we should also consider the potential market disruption, if the picture is less straightforward than the famous exponential charts. Even if the chart looks like a 2-stage S, or a “kinked” exponential, the gap may have implications, like a short recession in the economy. Many of the technical and business model innovations in recent years have been responses to the expected continual upward spiral of demand – either controlling users’ access to network resources, pricing it more highly and with greater granularity, or building out extra capacity at a lower price. Even leaving aside the fact that raw, aggregated “traffic” levels are a poor indicator of cost or congestion, any interruption or slow-down of the growth will invalidate a lot of assumptions and plans.

Our view is that the scary forecasts of “explosions” and “tsunamis” have led virtually all parts of the industry to create solutions to the problem. We can probably list more than 20 approaches, most of them standalone “silos”.

Figure 2 – A plethora of mobile data traffic management solutions

A Plethora of Mobile Data Traffic Management Solutions

What seems to have happened is that at least 10 of those approaches have worked – caps/tiers, video optimisation, WiFi offload, network densification and optimisation, collaboration with application firms to create “network-friendly” software and so forth. Taken collectively, there is actually a risk that they have worked “too well”, to the extent that some previous forecasts have turned into “self-denying prophesies”.

There is also another common forecasting problem occurring – the assumption that later adopters of a technology will have similar behaviour to earlier users. In many markets we are now reaching 30-50% smartphone penetration. That means that all the most enthusiastic users are already connected, and we’re left with those that are (largely) ambivalent and probably quite light users of data. That will bring the averages down, even if each individual user is still increasing their consumption over time. But even that assumption may be flawed, as caps have made people concentrate much more on their usage, offloading to WiFi and restricting their data flows. There is also some evidence that the growing numbers of free WiFi points is also reducing laptop use of mobile data, which accounts for 70-80% of the total in some markets, while the much-hyped shift to tablets isn’t driving much extra mobile data as most are WiFi-only.

So has the industry over-reacted to the threat of a “capacity crunch”? What might be the implications?

The problem is that focusing on a single, narrow metric “GB of data across the network” ignores some important nuances and finer detail. From an economics standpoint, network costs tend to be driven by two main criteria:

  • Network coverage in terms of area or population
  • Network capacity at the busiest places/times

Coverage is (generally) therefore driven by factors other than data traffic volumes. Many cells have to be built and run anyway, irrespective of whether there’s actually much load – the operators all want to claim good footprints and may be subject to regulatory rollout requirements. Peak capacity in the most popular locations, however, is a different matter. That is where issues such as spectrum availability, cell site locations and the latest high-speed networks become much more important – and hence costs do indeed rise. However, it is far from obvious that the problems at those “busy hours” are always caused by “data hogs” rather than sheer numbers of people each using a small amount of data. (There is also another issue around signalling traffic, discussed later). 

Yes, there is a generally positive correlation between network-wide volume growth and costs, but it is far from perfect, and certainly not a direct causal relationship.

So let’s hypothesise briefly about what might occur if data traffic growth does tail off, at least in mature markets.

  • Delays to LTE rollout – if 3G networks are filling up less quickly than expected, the urgency of 4G deployment is reduced.
  • The focus of policy and pricing for mobile data may switch back to encouraging use rather than discouraging/controlling it. Capacity utilisation may become an important metric, given the high fixed costs and low marginal ones. Expect more loyalty-type schemes, plus various methods to drive more usage in quiet cells or off-peak times.
  • Regulators may start to take different views of traffic management or predicted spectrum requirements.
  • Prices for mobile data might start to fall again, after a period where we have seen them rise. Some operators might be tempted back to unlimited plans, for example if they offer “unlimited off-peak” or similar options.
  • Many of the more complex and commercially-risky approaches to tariffing mobile data might be deprioritised. For example, application-specific pricing involving packet-inspection and filtering might get pushed back down the agenda.
  • In some cases, we may even end up with overcapacity on cellular data networks – not to the degree we saw in fibre in 2001-2004, but there might still be an “overhang” in some places, especially if there are multiple 4G networks.
  • Steady growth of (say) 20-30% peak data per annum should be manageable with the current trends in price/performance improvement. It should be possible to deploy and run networks to meet that demand with reducing unit “production cost”, for example through use of small cells. That may reduce the pressure to fill the “revenue gap” on the infamous scissors-diagram chart.

Overall, it is still a little too early to declare shifting growth patterns for mobile data as a “disruption”. There is a lack of clarity on what is happening, especially in terms of responses to the new controls, pricing and management technologies put recently in place. But operators need to watch extremely closely what is going on – and plan for multiple scenarios.

Specific recommendations will depend on an individual operator’s circumstances – user base, market maturity, spectrum assets, competition and so on. But broadly, we see three scenarios and implications for operators:

  • “All hands on deck!”: Continued strong growth (perhaps with a small “blip”) which maintains the pressure on networks, threatens congestion, and drives the need for additional capacity, spectrum and capex.
    • Operators should continue with current multiple strategies for dealing with data traffic – acquiring new spectrum, upgrading backhaul, exploring massive capacity enhancement with small cells and examining a variety of offload and optimisation techniques. Where possible, they should explore two-sided models for charging and use advanced pricing, policy or segmentation techniques to rein in abusers and reward those customers and applications that are parsimonious with their data use. Vigorous lobbying activities will be needed, for gaining more spectrum, relaxing Net Neutrality rules and perhaps “taxing” content/Internet companies for traffic injected onto networks.
  • “Panic over”: Moderating and patchy growth, which settles to a manageable rate – comparable with the patterns seen in the fixed broadband marketplace
    • This will mean that operators can “relax” a little, with the respite in explosive growth meaning that the continued capex cycles should be more modest and predictable. Extension of today’s pricing and segmentation strategies should improve margins, with continued innovation in business models able to proceed without rush, and without risking confrontation with Internet/content companies over traffic management techniques. Focus can shift towards monetising customer insight, ensuring that LTE rollouts are strategic rather than tactical, and exploring new content and communications services that exploit the improving capabilities of the network.
  • “Hangover”: Growth flattens off rapidly, leaving operators with unused capacity and threatening brutal price competition between telcos.
    • This scenario could prove painful, reminiscent of early-2000s experience in the fixed-broadband marketplace. Wholesale business models could help generate incremental traffic and revenue, while the emphasis will be on fixed-cost minimisation. Some operators will scale back 4G rollouts until cost and maturity go past the tipping-point for outright replacement of 3G. Restrictive policies on bandwidth use will be lifted, as operators compete to give customers the fastest / most-open access to the Internet on mobile devices. Consolidation – and perhaps bankruptcies – may ensure as declining data prices may coincide with substitution of core voice and messaging business

To read the note in full, including the following analysis…

  • Introduction
  • Telco-driven disruption vs. external trends
  • External disruptions to monitor
  • The mobile data explosion… or maybe not?
  • A J-curve or an S-curve?
  • Evolving the mobile network
  • Overview
  • LTE
  • Network sharing, wholesale and outsourcing
  • WiFi
  • Next-gen IP core networks (EPC)
  • Femtocells / small cells / “cloud RANs”
  • HetNets
  • Advanced offload: LIPA, SIPTO & others
  • Peer-to-peer connectivity
  • Self optimising networks (SON)
  • M2M-specific broadband innovations
  • Policy, control & business model enablers
  • The internal politics of mobile broadband & policy
  • Two sided business-model enablement
  • Congestion exposure
  • Mobile video networking and CDNs
  • Controlling signalling traffic
  • Device intelligence
  • Analytics & QoE awareness
  • Conclusions & recommendations
  • Index

…and the following figures…

  • Figure 1 – Trends in European data usage
  • Figure 2 – A plethora of mobile data traffic management solutions
  • Figure 3 – Not all operator WiFi is “offload” – other use cases include “onload”
  • Figure 4 – Internal ‘power tensions’ over managing mobile broadband
  • Figure 5 – How a congestion API could work
  • Figure 6 – Relative Maturity of MBB Management Solutions
  • Figure 7 – Laptops generate traffic volume, smartphones create signalling load
  • Figure 8 – Measuring Quality of Experience
  • Figure 9 – Summary of disruptive network innovations

Members of the Telco 2.0 Executive Briefing Subscription Service and Future Networks Stream can download the full 44 page report in PDF format hereNon-Members, please subscribe here, buy a Single User license for this report online here for £795 (+VAT for UK buyers), or for multi-user licenses or other enquiries, please email contact@telco2.net / call +44 (0) 207 247 5003.

Organisations, geographies, people and products referenced: 3GPP, Aero2, Alcatel Lucent, AllJoyn, ALU, Amazon, Amdocs, Android, Apple, AT&T, ATIS, BBC, BlackBerry, Bridgewater, CarrierIQ, China, China Mobile, China Unicom, Clearwire, Conex, DoCoMo, Ericsson, Europe, EverythingEverywhere, Facebook, Femto Forum, FlashLinq, Free, Germany, Google, GSMA, H3G, Huawei, IETF, IMEI, IMSI, InterDigital, iPhones,Kenya, Kindle, Light Radio, LightSquared, Los Angeles, MBNL, Microsoft, Mobily, Netflix, NGMN, Norway, NSN, O2, WiFi, Openet, Qualcomm, Radisys, Russia, Saudi Arabia, SoftBank, Sony, Stoke, Telefonica, Telenor, Time Warner Cable, T-Mobile, UK, US, Verizon, Vita, Vodafone, WhatsApp, Yota, YouTube, ZTE.

Technologies and industry terms referenced: 2G, 3G, 4.5G, 4G, Adaptive bitrate streaming, ANDSF (Access Network Discovery and Selection Function), API, backhaul, Bluetooth, BSS, capacity crunch, capex, caps/tiers, CDMA, CDN, CDNs, Cloud RAN, content delivery networks (CDNs), Continuous Computing, Deep packet inspection (DPI), DPI, DRM, Encryption, Enhanced video, EPC, ePDG (Evolved Packet Data Gateway), Evolved Packet System, Femtocells, GGSN, GPS, GSM, Heterogeneous Network (HetNet), Heterogeneous Networks (HetNets), HLRs, hotspots, HSPA, HSS (Home Subscriber Server), HTML5, HTTP Live Streaming, IFOM (IP Flow Mobility and Seamless Offload), IMS, IPR, IPv4, IPv6, LIPA (Local IP Access), LTE, M2M, M2M network enhancements, metro-cells, MiFi, MIMO (multiple in, MME (Mobility Management Entity), mobile CDNs, mobile data, MOSAP, MSISDN, MVNAs (mobile virtual network aggregators)., MVNO, Net Neutrality, network outsourcing, Network sharing, Next-generation core networks, NFC, NodeBs, offload, OSS, outsourcing, P2P, Peer-to-peer connectivity, PGW (PDN Gateway), picocells, policy, Policy and Charging Rules Function (PCRF), Pre-cached video, pricing, Proximity networks, Public WiFi, QoE, QoS, RAN optimisation, RCS, remote radio heads, RFID, self-optimising network technology (SON), Self-optimising networks (SON), SGW (Serving Gateway), SIM-free wireless, single RANs, SIPTO (Selective IP Traffic Offload), SMS, SoftSIM, spectrum, super-femtos, Telco 2.0 Happy Pipe, Transparent optimisation, UMTS, ‘Under-The-Floor’ (UTF) Players, video optimisation, VoIP, VoLTE, VPN, White space, WiFi, WiFi Direct, WiFi offloading, WiMAX, WLAN.

M2M 2.0: New Business Models for Service Enablers (Deutche Telekom) Presentation)

M2M 2.0: Service Enablers – New Business Models Needed,
Presentation by Sven Krey, Head of Sales Development, M2M Competence Centre, Deutsche Telekom.
Business model challenges facing operators in M2M and how DTAG is facing them. Presented at EMEA Brainstorm, November 2011.
M2M connections explode, prices plunge

Download presentation here.

Links here for more on New Digital Economics brainstorms and M2M 2.0 research, or call +44 (0) 207 247 5003.

Example slide from presentation:

M2M Chart from Deutsche Telekom

Optimising Mobile Broadband Economics: Key Issues and Next Steps

Summary: below is the Executive Summary and extract from a report on key issues for operators seeking to optimise mobile broadband network economics which were debated at the recent Telco 2.0 EMEA Brainstorm in London.

(NB: New video presentations exploring these issues in more detail will be broadcast online at Telco 2.0 Best Practice Live! on 28-30 June. Register here – it’s FREE.)

Executive Summary

At the 9th Telco 2.0 Executive Brainstorm, held in London on April 28-30, a dedicated session addressed the technical and business model challenges of mobile broadband, specifically looking at the cost problems and opportunities of the data boom.

The primary points made by the presenters were that:

  • New air interfaces and spectrum will not be enough to on their own to cope with the continued rise in data traffic. Building more cells alone is not a solution, and it will be necessary to address costs and pricing;
  • The challenge needs to be approached both from the network, through policy-based control including tiering and maybe traffic-shaping, backhaul optimisation, and offload through femtocells or WLAN, and from the business side with pricing, potential tiered offers and segmentation;
  • Techniques have to be deployed to manage traffic to deliver customer experiences, particularly for cloud and TV services;
  • The use of DPI for application-based traffic charging isn’t thought to be a practical solution, though device based management may be in some instances;
  • No single method of addressing capacity issues provides a complete solution and therefore a combination of offload, traffic management and segmentation is recommended.

Figure 1 – Key issues in Optimising the Economics of Mobile Broadband Networks

DB%20Conclusion%20slides.png

Source: Telco 2.0, 9th Telco 2.0 Executive Brainstorm, April 2010

Delegates: tiering sounds good but how do we do it?

Charging for providing higher and tiered Quality of Service (QoS) was a major topic of debate, and although this was ultimately voted as the most important potential current strategy, there were also strong disparate views offered by delegates. Other major themes were potential technological approaches, the role of content owners, LTE, and application based pricing.

Figure 2 – Delegate Vote on Near-Term Strategies
Vote%203%20Impact%20of%20business%20models.png

Source: 9th Telco 2.0 Executive Brainstorm, April 2010

[Ratings: 1-5, where 1 = ‘doesn’t move the needle’, and 5 = ‘dramatic positive effect on the economics of mobile broadband provision’]

Telco 2.0 Next Steps: Optimising Mobile Broadband Business Model Economics

Optimising mobile broadband economics is a complex challenge, or might perhaps be more accurately described as a collection of different challenges for different operators. There’s always a temptation to try to solve complex problems with a single ‘silver bullet’ idea, but in this instance this is almost certainly impossible, as there are many different possible solutions and different combinations of solutions will work at different times for different operators.

In our series of Future Broadband Business Models Strategy Reports, Telco 2.0 has previously explored the long term business model and technical architectures in Beyond Bundling: Growth Strategies for Fixed and Mobile Broadband – “Winning the $250Bn delivery game.”, the structure and evolution of the online video distribution market in Online Video Market Study: The impact of video on broadband business models, and most recently updated our analysis on a range of nearer term potential business model strategies in New Mobile, Fixed and Wholesale Broadband Business Models.

We will next create a new report summarizing the main options for optimizing mobile broadband business model economics. In addition, Mobile Broadband will feature in the first Telco 2.0 Best Practice Live! event at the end of June. This will provide a video-based online data bank of some of the most interesting Mobile Broadband case studies from across the world.

– Start of Detailed Report Extract –

Mobile Broadband Network Economics – Invest in Business Models as well as Technology

Moving attention away from the service side of the mobile broadband debate, speakers at the 9th Telco 2.0 Executive Brainstorm concentrated instead on how to move the needle on the cost side of the mobile broadband economics equation.

Stimulated by presentations by Dean Bubley, Senior Associate, Telco 2.0, and Dan Kirk, Director, Value Partners and a panel discussion that also included Johan Wickman, CTO Mobility, TeliaSonera, Eddie Chan, Global Head, Efficiency, NSN Consulting, and Andrew Bud, Chairman, MBlox, delegates came to the conclusion that pricing and segmentation strategies, together with offloading capabilities are more important than LTE in dealing with the data-inspired capacity crunch.

Redefining the Problem

Dean Bubley, Senior Associate, Telco 2.0, laid out the problem facing mobile operators. He displayed the now-iconic chart illustrating the ‘broadband incentive problem’ but argued that this was not a problem in itself – he said it was interesting but not necessarily a problem. It didn’t, for example, follow that the data service was going to be provided at a loss. Indeed, Johan Wickman’s TeliaSonera is one of a number of operators that are experiencing data revenues higher than is commonly believed. The incentive problem also doesn’t say anything about where cost or capacity issues would manifest themselves – in which elements of the network, or indeed what the right strategy would be to deal with them. Indeed, there are complex technology strategy issues present that aren’t addressed by such a statement at all.

Figure 3 – The ‘Broadband Incentive Problem’ Statement

BB%20incentive.png

 
Source: Telco 2.0, 9th Telco 2.0 Executive Brainstorm, April 2010 

Understanding Costs and Technology

Furthermore, he suggested that the industry may be paying more attention to how revenues from mobile broadband might be increased than how its costs could be controlled. Referring to an Agilent Technologies presentation on LTE, he pointed out that the large majority of all current and future wireless capacity was accounted for by the creation of new cells, therefore radio air interface improvements and spectrum release would not be anywhere near enough to support continued traffic growth without much more cell subdivision, with all its associated costs, and more use of “small cells” such as femtocells, WiFi, or pico-cells.

Network Solutions and Limitations

It is inevitable therefore to look at ways to better use the capacity available. However, the options for managing and shaping traffic are not straightforward and, as NSN’s Eddie Chan said, it is necessary to realise that “efficient” is not the same as “cheap” – efficiency is also about service improvements.

Traffic Management Mess

Bubley was particularly critical of traffic management solutions. He pointed to the important subtlety that traffic management could easily become a “mess”, particularly as traffic to and from PCs is difficult to manage. It tends to include many applications and, what is more, many applications and protocols can often be tunnelled within each other. The PC is a powerful open development platform and therefore there is much scope for users to circumvent traffic shaping. The share of PC traffic that consisted of non-voice data is in the order of 90%+ and essentially all of it is going to or from the public Internet, so whatever the operator does would be come at a cost. The complexity of this is illustrated below.

Figure 4 – Traffic Management Options

DB%20traffic%20management.png

Source: Telco 2.0, 9th Telco 2.0 Executive Brainstorm, April 2010

Bubley did point out that smartphone data and featurephone traffic are much more likely to be open to operators “adding value” than PC traffic as they are going to operator-hosted or operator-managed services. The traffic still has to be “managed”, but it’s now “friendly” traffic which is much more predictable. M2M devices, meanwhile, send all their traffic through the operator’s network – which might be a good reason to promote them as a line of business. Given the associated behaviours, it might be wise to segment by device rather than by application, an approach that Bubley feels is even more pertinent given concerns over DPI (Deep Packet Inspection), a technique by which network equipment looks beyond the header used for routing to non-header content (typically the actual payload) for some purpose, in this case to prioritise traffic.

The Doubtful Promise of DPI

Bubley argues that application-layer traffic shaping based on DPI has serious downsides; a major one simply being the definition of an application. For example, which service class would a YouTube video inside a Facebook plug-in have? Users would also adapt to it, use encryption, and tunnel one application in another to get round restrictions. Indeed, much of the file-sharing traffic had already moved to HTTP or HTTPS on ports 80 and 443. This may sound overly ‘techie’ but what it means is that file sharing traffic becomes indistinguishable from, and blends with, generic Web traffic. In addition, there would certainly inaccurate results and ‘false positives’, which could lead to political, regulatory, and reputational issues.

The only uses for deep packet inspection he could see were compliance with law-enforcement demands and gathering data for network optimisation, which might help the industry clear up whether its problems were caused by pirates running P2P, or bad network designs, aggressive data use by smartphones etc., or software updates.

Offload Options

So, if managing and shaping traffic effectively on one network is problematic, does it make more sense to offload it onto another?

The major advantage of the offload concept is that nobody’s data is being de-prioritised – rather than a re-allocation of (supposedly) scarce bandwidth, it represents an actual improvement in the efficiency of the network. It is therefore much less complex from a regulatory, political, and economic standpoint.

Solutions at the Business Layer

There are certainly some valuable options for addressing the data issue from a technical point of view, offload perhaps the most valuable amongst them. However, these are not all the weapons in an operator’s arsenal. They can also look to manage the impact of traffic on their networks and their bottom lines by looking at different business model and pricing options.

On the revenue side, Bubley says the bulk of revenue will be from ‘downstream’ subscription and pre-pay customers, and while helpful, that the near-term growth of new ‘upstream’ or wholesale / carrier services revenues alone would not be enough to cover the costs of capacity increases.

Figure 5 – New Revenue Streams Not Enough to Offset Capacity Requirements

Capacity%20table%20stakes.png

Source: Telco 2.0, 9th Telco 2.0 Executive Brainstorm, April 2010

This view was backed up by a delegate vote (see below) that suggests that while other options are possible, in the short term better tiering and segmentation strategies will be the best answer, followed by device-orientated solutions.

In this vote, the “New device categories” captures M2M (Machine-to-Machine) markets, “device bundled” refers to “comes with data” business models such as the connectivity Sprint provides for the Amazon Kindle, while ‘better tiering and segmentation’ refers to service and tariff packages. ‘Sender party pays’ is where users receive the service free and the sending party, be it an advertiser or other enterprise, pays, and ‘government sponsored’ is the case where the government pays for the connection as a public service.

Figure 6 – Impact of Mobile Broadband Business Models

Vote%201%20MBB%20short%20term%20revenue%20impact.png

Source: 9th Telco 2.0 Executive Brainstorm, April 2010

All Devices Are Not Equal

Returning to Bubley’s earlier claim that device segmentation may be more effective than application management policies, devices are a natural place to start when looking at business segmentation strategies. However, not all devices are created equal.

Smartphones, for example, tend to generate many relatively brief data sessions, they move around constantly and therefore carry out large numbers of register/handoff transactions with the network, and they also generate voice and messaging traffic. Because the signalling overhead for a data call is incurred when setting up and tearing down the session, a given amount of traffic split into 10 brief sessions is dramatically more demanding for the network than the same amount in one continuous session. Also, smartphones often have aggressive power-management routines that cause more signalling as they attempt to migrate to the cell that requires the least transmitter power.

On the other hand, although laptops tend to consume lots of bulk data, they do so in a relatively network-friendly fashion. The cellular dongles are typically operated much like a fixed-line modem, registering with the network and staying on-line throughout the user session. Their use profile tends to be nomadic rather than truly mobile, as the user is typically sitting down to work at the computer for an extended session. And the modems rarely have any serious power management, as they draw power over USB from the computer. These behaviours therefore create natural segments.

To read the rest of the report, covering…

  • Selling QoS/QoE
  • LTE – Build and They Will Come?
  • Four Scenarios for the Future Development of Mobile Broadband Business
  • Concluding Analysis
  • Telco 2.0 Next Steps: Optimising Mobile Broadband Business Model Economics

…and including…

  • Figure 1: Key Options for Cost Management in Mobile Broadband Networks
  • Figure 2: Delegate Vote on Near-Term Strategies
  • Figure 3: The ‘Broadband Incentive Problem’ Statement
  • Figure 4: Traffic Management Options
  • Figure 5: New Revenue Streams Not Enough to Offset Capacity Requirements
  • Figure 6: Impact of Mobile Broadband Business Models
  • Figure 7: More to Customer Experience than the Access Network
  • Figure 8: Upstream Demands for More Bandwidth
  • Figure 9: Predicted Timing of LTE Revenues in Europe
  • Figure 10: Impact of Mobile Broadband Business Models
  • Figure 11: Integrated Traffic and Segmentation Strategies More Important than LTE Alone
  • Figure 12: Key Options for Cost Management in Mobile Broadband Networks

 …Members of the Telco 2.0TM Executive Briefing Subscription Service and Future Networks Stream can download the full 20 page report in PDF format here. Non-Members, please see here for how to subscribe. Please email contact@telco2.net or call
+44 (0) 207 247 5003 for further details.

Full Article: Triple play, go away

We were running through four case studies from our new Broadband Business Models 2.0 Report looking at how the content aggregation and distribution businesses interact with one another. The four products we picked on are Joost, Iliad’s Free service, Sky Anytime and BT Vision, but of course we’ve been following many others. We’re seeing some common themes, plus some ideas of our own, that we thought we’d share with you:

  • You have to match the right content to the right distribution system. Get it wrong, for example by picking mass market content when you should be deep in the long tail, and you’ll fail. Get it right, for example by giving user generated content equal footing in the distribution system, and you’ll be rewarded.
  • Two-sided business models (with payment from users as well as merchants) generally beat one-sided models.
  • Scale matters in both content aggregation and distribution. Sponsors and advertisers demand it, and distribution efficiency needs it. Few businesses have both. Telcos trying to build both capabiliies as a “triple play? will mostly fail.
  • Indeed, always carry a wet fish with you. Whenever you hear someone say “triple play? (or “Quad? or “Quin? Play), slap them across the face with it until they wake up. It’s nonsense. A dream. If anything it’s “multiplex play? — how do I use my customer relationship and distribution assets to market and deliver content from relevant aggregators to targeted users? For example, how does an ISP serving the small business market offer multicast video from a business newscast partner?
  • The triple play is a vestige of what Umair Haque calls the “massconomy? — mass production of a standardised product, versus the “edgeconomy? where everything is personalised and also understands the user is a critical producer as well as consumer of value. Iliad’s TV Perso is a classic example here of going beyond bundling, by allowing users to create their own TV channels, including their own content.
  • Telcos have a cultural handicap: they’re obsessed with billable events. Consumers want bundles. The marketing skill is how to build and break bundles.
  • Speaking of bundling, consumers want to buy product and delivery together as a package (“FREE delivery!?). They also dislike endless small charges for calls and content — there’s a large “certainty premium? that they pay for bundles. However, the classical consumer surplus analysis of bundling only applies when you group dissimilar but complementary goods (e.g. TV and phone service). And it only works to reclaim some market power for yourself. If your basic product isn’t very good, because you’re stuck in a “massconomy? mindset, it doesn’t help.
  • That means operators need to open up their assets (network, logistics, customer data) to upstream partners to help them bundle the retail proposition.
  • Most vendors have nothing like the offering that the operators need. Nowhere near. Sorry.
  • Content still isn’t king. If you really want to make money, go re-invent the freephone number business.